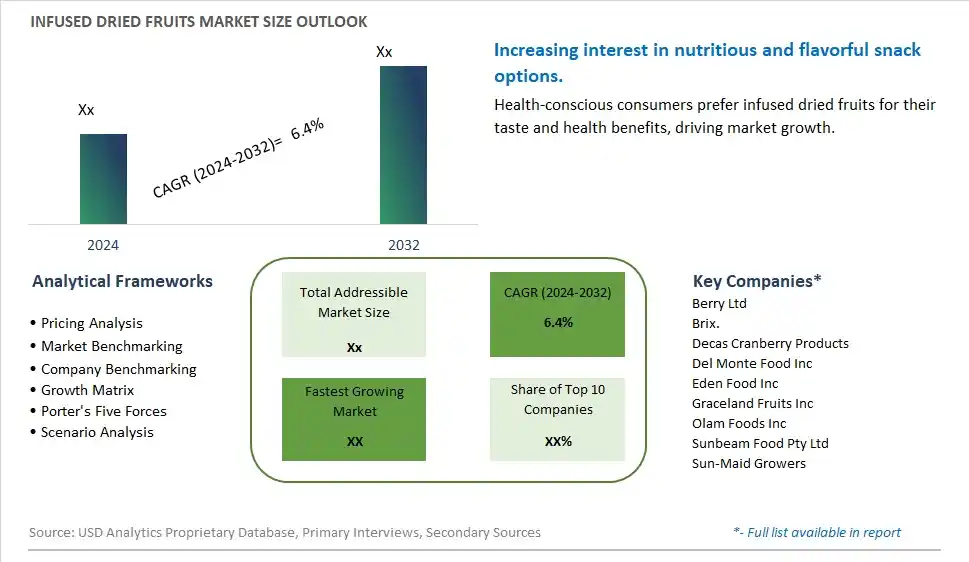
Global Infused Dried Fruits Market Size is valued at $XX Million in 2024 and is forecast to register a growth rate (CAGR) of 6.4% to reach $XX Million by 2032.
The global Infused Dried Fruits Market Comprehensive Study analyzes and forecasts the market size across 6 regions and 24 countries for diverse segments -By Fruit (Apples, Apricots, Mangoes, Cherry, Raspberry, Strawberry, Quince, Others), By Type (Organic, Conventional), By Product (Fruit Juice/Juice Concentrate Infused, Sugar Infused, Others), By Application (Breakfast Cereals, Bakery Products, Dairy & Frozen Dessert Products, Salads, Others), By Distribution Channel (Direct Sales, Indirect Sales)
An Introduction to Infused Dried Fruits Market
In 2024, the infused dried fruits market is thriving, driven by the demand for healthy, convenient, and flavorful snack options. Infused dried fruits, enhanced with natural flavors, vitamins, and minerals, offer a nutritious alternative to traditional snacks. The market is seeing innovations in infusion techniques and a growing variety of fruit options, catering to diverse consumer preferences. The trend towards clean label and organic products is also influencing market dynamics. Increasing awareness of the health benefits associated with dried fruits is supporting market growth.
Infused Dried Fruits Competitive Landscape
The market report analyses the leading companies in the industry including Berry Ltd, Brix., Decas Cranberry Products, Del Monte Food Inc, Eden Food Inc, Graceland Fruits Inc, Olam Foods Inc, Sunbeam Food Pty Ltd, Sun-Maid Growers, and Others.
Infused Dried Fruits Market Dynamics
Infused Dried Fruits Market Trend: Rising Demand for Healthy and Convenient Snack Options
The most prominent trend in the Infused Dried Fruits Market is the rising demand for healthy and convenient snack options. Consumers are increasingly seeking nutritious snacks that are easy to carry and consume on the go. Infused dried fruits, which are enriched with natural flavors and nutrients, are gaining popularity as a healthy alternative to traditional snacks. This trend is driven by the growing awareness of the benefits of dried fruits, such as their high fiber content and natural sweetness, as well as the convenience they offer. The demand for healthy and convenient snack options is encouraging manufacturers to innovate and expand their product offerings in the infused dried fruits Market
Infused Dried Fruits Market Driver: Increase in Health Consciousness and Demand for Functional Foods
A key driver for the Infused Dried Fruits Market is the increase in health consciousness and the demand for functional foods. As consumers become more aware of the impact of their diet on overall health, there is a growing preference for foods that provide additional health benefits. Infused dried fruits, which can be fortified with vitamins, minerals, and antioxidants, cater to this demand for functional and nutritious foods. The emphasis on health and wellness is significantly driving the market for infused dried fruits as consumers seek snacks that contribute to their well-being.
Infused Dried Fruits Market Opportunity: Expansion into Emerging Markets with Growing Middle-Class Populations
One potential opportunity in the Infused Dried Fruits Market lies in the expansion into emerging markets with growing middle-class populations. Regions such as Asia-Pacific, Latin America, and Africa are experiencing rapid urbanization and increasing disposable incomes, leading to a rise in the demand for healthy and convenient food options. By focusing on these emerging markets and adapting products to local tastes and preferences, manufacturers can tap into a large and expanding consumer base. This focus on geographic expansion can drive market growth and increase the global reach of infused dried fruits.
Infused Dried Fruits Market Share Analysis: Mangoes segment generated the highest revenue share in the industry
Among the fruits in the Infused Dried Fruits Market, Mangoes represent the largest segment. Mangoes are popular in the dried fruit market due to their naturally sweet flavor, vibrant color, and rich nutritional profile. Dried mangoes retain much of the fruit's natural sweetness and are commonly used as snacks, ingredients in baking, and additions to cereals and trail mixes. Their popularity is further enhanced by their versatility in culinary applications and their appeal as a healthy alternative to sugary snacks.
Infused Dried Fruits Market Share Analysis: Organic is the fastest growing segment over the forecast period to 2032
The Organic segment is anticipated to be the fastest-growing in the Infused Dried Fruits Market through 2032. This growth is driven by increasing consumer demand for organic food products perceived as healthier and more environmentally sustainable. Organic infused dried fruits are produced without synthetic pesticides, herbicides, or genetically modified organisms (GMOs), aligning with consumer preferences for clean-label and natural products. The organic certification ensures adherence to strict production standards that prioritize environmental stewardship and animal welfare, appealing to conscientious consumers seeking nutritious and ethically produced food options.
Infused Dried Fruits Market Share Analysis: Sugar Infused segment generated the highest revenue share in the industry
Among the products in the Infused Dried Fruits Market, the Sugar Infused segment is the largest. Sugar infused dried fruits are popular for their sweet flavor profile and enhanced shelf life due to the preservation properties of sugar. These products are widely used in various applications such as snacking, baking, and confectionery, appealing to consumers looking for indulgent and flavorful dried fruit options. The sugar infusion process not only enhances the taste but also helps maintain the texture and appearance of the dried fruits, making them versatile ingredients in culinary and food manufacturing sectors.
Infused Dried Fruits Market Share Analysis: Breakfast Cereals is the fastest growing segment over the forecast period to 2032
The Breakfast Cereals application segment is expected to be the fastest-growing in the Infused Dried Fruits Market through 2032. This growth is driven by the increasing consumer preference for nutritious and convenient breakfast options that include dried fruits. Infused dried fruits add natural sweetness, flavor, and texture to breakfast cereals, making them attractive to health-conscious consumers seeking balanced and flavorful morning meals. The demand for breakfast cereals fortified with vitamins, minerals, and natural ingredients like infused dried fruits reflects broader trends towards healthier eating habits and convenience in breakfast choices.
Infused Dried Fruits Market Segmentation
By Fruit
Apples
Apricots
Mangoes
Cherry
Raspberry
Strawberry
Quince
Others
By Type
Organic
Conventional
By Product
Fruit Juice/Juice Concentrate Infused
Sugar Infused
Others
By Application
Breakfast Cereals
Bakery Products
Dairy & Frozen Dessert Products
Salads
Others
By Distribution Channel
Direct Sales
Indirect Sales
Countries Analyzed
North America (US, Canada, Mexico)
Europe (Germany, UK, France, Spain, Italy, Russia, Rest of Europe)
Asia Pacific (China, India, Japan, South Korea, Australia, South East Asia, Rest of Asia)
South America (Brazil, Argentina, Rest of South America)
Middle East and Africa (Saudi Arabia, UAE, Rest of Middle East, South Africa, Egypt, Rest of Africa)
Infused Dried Fruits Companies Profiled in the Study
Berry Ltd
Brix.
Decas Cranberry Products
Del Monte Food Inc
Eden Food Inc
Graceland Fruits Inc
Olam Foods Inc
Sunbeam Food Pty Ltd
Sun-Maid Growers
*- List Not Exhaustive
Chapter 1. TABLE OF CONTENTS
Chapter 2. Introduction to Infused Dried Fruits Market
2.1. Market Overview
2.2. Key Statistics and Report Highlights
2.3. Scope of the Comprehensive Study
2.3.1. Market Definition
2.3.2 Countries and Regions Covered
2.3.3 Research Objective
2.3.4 Units, Currency, and Conversions
2.3.5 Industry Value Chain
2.4. Key Market Segments
2.5. Key Companies
2.6. Study Period
Chapter 3. Strategic Analysis Review
3.1. Infused Dried Fruits Pricing Analysis and Forecast
3.2. Porter’s Five Forces
3.3. Market Ecosystem
3.4. SWOT Analysis
3.5. Regulatory Scenario
3.3. Effects of Inflation, Russia-Ukraine War, moderating economic growth, and other macroeconomic factors
Chapter 4. Competitive Landscape
4.1. Market Share Analysis
4.1.1. Global Infused Dried Fruits Market Share by Company, 2023
4.1.2. Product Offerings of Leading Infused Dried Fruits Companies
4.2. Market Entropy
4.2.1. New Product Launches in the Industry
4.2.2. Mergers, Acquisitions, Joint ventures, and Partnerships
4.3. Key Strategies and Best Practices
Chapter 5. Global Market Projections: Best, Reference, and Low Case Scenarios
5.1. Growth Analysis- Case Scenario Definitions
5.2. Low Growth Case Scenario Forecasts
5.3. Reference Growth Case Scenario Forecasts
5.4. High Growth Case Scenario Forecasts
Chapter 6. Market Dynamics
6.1. Infused Dried Fruits Market Drivers
6.2. Infused Dried Fruits Market Challenges
6.6. Infused Dried Fruits Market Opportunities
6.4. Infused Dried Fruits Market Trends
Chapter 7. Global Infused Dried Fruits Market Outlook Trends
7.1. Global Infused Dried Fruits Revenue (USD Million) and CAGR (%) by Type (2021-2032)
7.2. Global Infused Dried Fruits Revenue (USD Million) and CAGR (%) by Application (2021-2032)
7.3. Global Infused Dried Fruits Revenue (USD Million) and CAGR (%) by Product (2021-2032)
By Fruit
Apples
Apricots
Mangoes
Cherry
Raspberry
Strawberry
Quince
Others
By Type
Organic
Conventional
By Product
Fruit Juice/Juice Concentrate Infused
Sugar Infused
Others
By Application
Breakfast Cereals
Bakery Products
Dairy & Frozen Dessert Products
Salads
Others
By Distribution Channel
Direct Sales
Indirect Sales
Chapter 8. Global Infused Dried Fruits Regional Analysis and Outlook
8.1. Global Infused Dried Fruits Revenue (USD Million) By Regions (2021- 2032)
8.2. North America Infused Dried Fruits Revenue (USD Million) by Country (2021-2032)
8.2.1. United States Infused Dried Fruits Regional Analysis and Outlook
8.2.2. Canada Infused Dried Fruits Regional Analysis and Outlook
8.2.3. Mexico Infused Dried Fruits Regional Analysis and Outlook
8.3. Europe Infused Dried Fruits Revenue (USD Million), by Country (2021-2032)
8.3.1. Germany Infused Dried Fruits Regional Analysis and Outlook
8.3.2. France Infused Dried Fruits Regional Analysis and Outlook
8.3.3. United Kingdom Infused Dried Fruits Regional Analysis and Outlook
8.3.4. Spain Infused Dried Fruits Regional Analysis and Outlook
8.3.5. Italy Infused Dried Fruits Regional Analysis and Outlook
8.3.6. Russia Infused Dried Fruits Regional Analysis and Outlook
8.3.7. Rest of Europe Infused Dried Fruits Regional Analysis and Outlook
8.4. Asia Pacific Infused Dried Fruits Revenue (USD Million) by Country (2021-2032)
8.4.1. China Infused Dried Fruits Regional Analysis and Outlook
8.4.2. Japan Infused Dried Fruits Regional Analysis and Outlook
8.4.3. India Infused Dried Fruits Regional Analysis and Outlook
8.4.4. South Korea Infused Dried Fruits Regional Analysis and Outlook
8.4.5. Australia Infused Dried Fruits Regional Analysis and Outlook
8.4.6. South East Asia Infused Dried Fruits Regional Analysis and Outlook
8.4.7. Rest of Asia Pacific Infused Dried Fruits Regional Analysis and Outlook
8.5. South America Infused Dried Fruits Revenue (USD Million), by Country (2021-2032)
8.5.1. Brazil Infused Dried Fruits Regional Analysis and Outlook
8.5.2. Argentina Infused Dried Fruits Regional Analysis and Outlook
8.5.3. Rest of South America Infused Dried Fruits Regional Analysis and Outlook
8.6. Middle East and Africa Infused Dried Fruits Revenue (USD Million) by Country (2021-2032)
8.6.1. Middle East Infused Dried Fruits Regional Analysis and Outlook
8.6.2. Africa Infused Dried Fruits Regional Analysis and Outlook
Chapter 9. North America Infused Dried Fruits Analysis and Outlook
9.1. North America Infused Dried Fruits Revenue (USD Million) by Segments (2021-2032)
9.1.1. North America Infused Dried Fruits Revenue (USD Million) by Type (2021-2032)
9.1.2. North America Infused Dried Fruits Revenue (USD Million) by Application (2021-2032)
9.1.3. North America Infused Dried Fruits Revenue (USD Million) by Product (2021-2032)
By Fruit
Apples
Apricots
Mangoes
Cherry
Raspberry
Strawberry
Quince
Others
By Type
Organic
Conventional
By Product
Fruit Juice/Juice Concentrate Infused
Sugar Infused
Others
By Application
Breakfast Cereals
Bakery Products
Dairy & Frozen Dessert Products
Salads
Others
By Distribution Channel
Direct Sales
Indirect Sales
Chapter 10. Europe Infused Dried Fruits Analysis and Outlook
10.1. Europe Infused Dried Fruits Revenue (USD Million), by Segments (USD Million) (2021-2032)
10.1.1. Europe Infused Dried Fruits Revenue (USD Million) by Type (2021-2032)
10.1.2. Europe Infused Dried Fruits Revenue (USD Million) by Application (2021-2032)
10.1.3. Europe Infused Dried Fruits Revenue (USD Million) by Product (2021-2032)
By Fruit
Apples
Apricots
Mangoes
Cherry
Raspberry
Strawberry
Quince
Others
By Type
Organic
Conventional
By Product
Fruit Juice/Juice Concentrate Infused
Sugar Infused
Others
By Application
Breakfast Cereals
Bakery Products
Dairy & Frozen Dessert Products
Salads
Others
By Distribution Channel
Direct Sales
Indirect Sales
Chapter 11. Asia Pacific Infused Dried Fruits Analysis and Outlook
11.1. Asia Pacific Infused Dried Fruits Revenue (USD Million), and Revenue (USD Million) by Segments (2021-2032)
11.1.1. Asia Pacific Infused Dried Fruits Revenue (USD Million) by Type (2021-2032)
11.1.2. Asia Pacific Infused Dried Fruits Revenue (USD Million) by Application (2021-2032)
11.1.3. Asia Pacific Infused Dried Fruits Revenue (USD Million) by Product (2021-2032)
By Fruit
Apples
Apricots
Mangoes
Cherry
Raspberry
Strawberry
Quince
Others
By Type
Organic
Conventional
By Product
Fruit Juice/Juice Concentrate Infused
Sugar Infused
Others
By Application
Breakfast Cereals
Bakery Products
Dairy & Frozen Dessert Products
Salads
Others
By Distribution Channel
Direct Sales
Indirect Sales
Chapter 12. South America Infused Dried Fruits Analysis and Outlook
12.1. South America Infused Dried Fruits Revenue (USD Million), by Segments (2021-2032)
12.1.1. South America Infused Dried Fruits Revenue (USD Million) by Type (2021-2032)
12.1.2. South America Infused Dried Fruits Revenue (USD Million) by Application (2021-2032)
12.1.3. South America Infused Dried Fruits Revenue (USD Million) by Product (2021-2032)
By Fruit
Apples
Apricots
Mangoes
Cherry
Raspberry
Strawberry
Quince
Others
By Type
Organic
Conventional
By Product
Fruit Juice/Juice Concentrate Infused
Sugar Infused
Others
By Application
Breakfast Cereals
Bakery Products
Dairy & Frozen Dessert Products
Salads
Others
By Distribution Channel
Direct Sales
Indirect Sales
Chapter 13. Middle East and Africa Infused Dried Fruits Analysis and Outlook
13.1. Middle East and Africa Infused Dried Fruits Revenue (USD Million), by Segments (2021-2032)
13.1.1. Middle East and Africa Infused Dried Fruits Revenue (USD Million) by Type (2021-2032)
13.1.2. Middle East and Africa Infused Dried Fruits Revenue (USD Million) by Application (2021-2032)
13.1.3. Middle East and Africa Infused Dried Fruits Revenue (USD Million) by Product (2021-2032)
By Fruit
Apples
Apricots
Mangoes
Cherry
Raspberry
Strawberry
Quince
Others
By Type
Organic
Conventional
By Product
Fruit Juice/Juice Concentrate Infused
Sugar Infused
Others
By Application
Breakfast Cereals
Bakery Products
Dairy & Frozen Dessert Products
Salads
Others
By Distribution Channel
Direct Sales
Indirect Sales
Chapter 14. Infused Dried Fruits Company Profiles
14.1 Business Overview
14.2 Product Profiles
14.3 SWOT Profiles
14.5 Recent Developments
14.6 Financial Profile
List of Companies
Berry Ltd
Brix.
Decas Cranberry Products
Del Monte Food Inc
Eden Food Inc
Graceland Fruits Inc
Olam Foods Inc
Sunbeam Food Pty Ltd
Sun-Maid Growers
15. Methodology and Data Sources
15.1 Customization Offerings
15.2 Subscription Services
15.3 Related Reports
15.4 Publisher Expertise
LIST OF TABLES
Table 1 Market Segmentation Analysis
Table 2 Global Infused Dried Fruits Market Share of Leading Companies, 2023
Table 3 Product Offerings of Leading Companies
Table 4 Low Growth Scenario Forecasts
Table 5 Reference Case Growth Scenario
Table 6 High Growth Case Scenario
Table 7 Global Infused Dried Fruits Revenue (USD Million) And CAGR (%) By Type (2021-2032)
Table 8 Global Infused Dried Fruits Revenue (USD Million) And CAGR (%) By Application (2021-2032)
Table 9 Global Infused Dried Fruits Revenue (USD Million) And CAGR (%) By Product (2021-2032)
Table 10 Global Infused Dried Fruits Market Revenue (USD Million) By Regions (2021-2032)
Table 11 Global Infused Dried Fruits Market Share (%) By Regions (2021-2032)
Table 12 North America Infused Dried Fruits Revenue (USD Million) By Country (2021-2032)
Table 13 Europe Infused Dried Fruits Revenue (USD Million) By Country (2021-2032)
Table 14 Asia Pacific Infused Dried Fruits Revenue (USD Million) By Country (2021-2032)
Table 15 South America Infused Dried Fruits Revenue (USD Million) By Country (2021-2032)
Table 16 Middle East and Africa Infused Dried Fruits Revenue (USD Million) By Region (2021-2032)
Table 17 North America Infused Dried Fruits Revenue (USD Million) By Type (2021-2032)
Table 18 North America Infused Dried Fruits Revenue (USD Million) By Application (2021-2032)
Table 19 North America Infused Dried Fruits Revenue (USD Million) By Product (2021-2032)
Table 20 Europe Infused Dried Fruits Revenue (USD Million) By Type (2021-2032)
Table 21 Europe Infused Dried Fruits Revenue (USD Million) By Application (2021-2032)
Table 22 Europe Infused Dried Fruits Revenue (USD Million) By Product (2021-2032)
Table 23 Asia Pacific Infused Dried Fruits Revenue (USD Million) By Type (2021-2032)
Table 24 Asia Pacific Infused Dried Fruits Revenue (USD Million) By Application (2021-2032)
Table 25 Asia Pacific Infused Dried Fruits Revenue (USD Million) By Product (2021-2032)
Table 26 South America Infused Dried Fruits Revenue (USD Million) By Type (2021-2032)
Table 27 South America Infused Dried Fruits Revenue (USD Million) By Application (2021-2032)
Table 28 South America Infused Dried Fruits Revenue (USD Million) By Product (2021-2032)
Table 29 Middle East and Africa Infused Dried Fruits Revenue (USD Million) By Type (2021-2032)
Table 30 Middle East and Africa Infused Dried Fruits Revenue (USD Million) By Application (2021-2032)
Table 31 Middle East and Africa Infused Dried Fruits Revenue (USD Million) By Product (2021-2032)
LIST OF FIGURES
Figure 1. Market Scope
Figure 2. Pricing Forecasts Per Unit, 2023- 2032
Figure 3. Porter’s Five Forces
Figure 4. Global Infused Dried Fruits Market Revenue (USD Million) By Regions (2021-2032)
Figure 5. Global Infused Dried Fruits Market Share (%) By Regions (2023)
Figure 6. North America Infused Dried Fruits Revenue (USD Million) By Country (2021-2032)
Figure 7. United States Infused Dried Fruits Revenue (USD Million) By Country (2021-2032)
Figure 8. Canada Infused Dried Fruits Revenue (USD Million) By Country (2021-2032)
Figure 9. Mexico Infused Dried Fruits Revenue (USD Million) By Country (2021-2032)
Figure 10. Europe Infused Dried Fruits Revenue (USD Million) By Country (2021-2032)
Figure 11. Germany Infused Dried Fruits Revenue (USD Million) By Country (2021-2032)
Figure 12. France Infused Dried Fruits Revenue (USD Million) By Country (2021-2032)
Figure 13. United Kingdom Infused Dried Fruits Revenue (USD Million) By Country (2021-2032)
Figure 14. Spain Infused Dried Fruits Revenue (USD Million) By Country (2021-2032)
Figure 15. Italy Infused Dried Fruits Revenue (USD Million) By Country (2021-2032)
Figure 16. Russia Infused Dried Fruits Revenue (USD Million) By Country (2021-2032)
Figure 17. Rest of Europe Infused Dried Fruits Revenue (USD Million) By Country (2021-2032)
Figure 11. Asia Pacific Infused Dried Fruits Revenue (USD Million) By Country (2021-2032)
Figure 12. China Infused Dried Fruits Revenue (USD Million) By Country (2021-2032)
Figure 13. Japan Infused Dried Fruits Revenue (USD Million) By Country (2021-2032)
Figure 14. India Infused Dried Fruits Revenue (USD Million) By Country (2021-2032)
Figure 15. South Korea Infused Dried Fruits Revenue (USD Million) By Country (2021-2032)
Figure 16. Australia Infused Dried Fruits Revenue (USD Million) By Country (2021-2032)
Figure 17. South East Asia Infused Dried Fruits Revenue (USD Million) By Country (2021-2032)
Figure 18. South America Infused Dried Fruits Revenue (USD Million) By Country (2021-2032)
Figure 19. Brazil Infused Dried Fruits Revenue (USD Million) By Country (2021-2032)
Figure 20. Argentina Infused Dried Fruits Revenue (USD Million) By Country (2021-2032)
Figure 21. Rest of Asia Pacific Infused Dried Fruits Revenue (USD Million) By Country (2021-2032)
Figure 22. Middle East and Africa Infused Dried Fruits Revenue (USD Million) By Region (2021-2032)
Figure 23. Saudi Arabia Infused Dried Fruits Revenue (USD Million) By Region (2021-2032)
Figure 24. The UAE Infused Dried Fruits Revenue (USD Million) By Region (2021-2032)
Figure 25. Rest of Middle East Infused Dried Fruits Revenue (USD Million) By Region (2021-2032)
Figure 26. South Africa Infused Dried Fruits Revenue (USD Million) By Region (2021-2032)
Figure 27. Africa Infused Dried Fruits Revenue (USD Million) By Region (2021-2032)
Figure 28. North America Infused Dried Fruits Revenue (USD Million) By Type (2021-2032)
Figure 29. North America Infused Dried Fruits Revenue (USD Million) By Application (2021-2032)
Figure 30. North America Infused Dried Fruits Revenue (USD Million) By Product (2021-2032)
Figure 31. Europe Infused Dried Fruits Revenue (USD Million) By Type (2021-2032)
Figure 32. Europe Infused Dried Fruits Revenue (USD Million) By Application (2021-2032)
Figure 33. Europe Infused Dried Fruits Revenue (USD Million) By Product (2021-2032)
Figure 34. Asia Pacific Infused Dried Fruits Revenue (USD Million) By Type (2021-2032)
Figure 35. Asia Pacific Infused Dried Fruits Revenue (USD Million) By Application (2021-2032)
Figure 36. Asia Pacific Infused Dried Fruits Revenue (USD Million) By Product (2021-2032)
Figure 37. South America Infused Dried Fruits Revenue (USD Million) By Type (2021-2032)
Figure 38. South America Infused Dried Fruits Revenue (USD Million) By Application (2021-2032)
Figure 39. South America Infused Dried Fruits Revenue (USD Million) By Product (2021-2032)
Figure 40. Middle East and Africa Infused Dried Fruits Revenue (USD Million) By Type (2021-2032)
Figure 41. Middle East and Africa Infused Dried Fruits Revenue (USD Million) By Application (2021-2032)
Figure 42. Middle East and Africa Infused Dried Fruits Revenue (USD Million) By Product (2021-2032)
By Fruit
Apples
Apricots
Mangoes
Cherry
Raspberry
Strawberry
Quince
Others
By Type
Organic
Conventional
By Product
Fruit Juice/Juice Concentrate Infused
Sugar Infused
Others
By Application
Breakfast Cereals
Bakery Products
Dairy & Frozen Dessert Products
Salads
Others
By Distribution Channel
Direct Sales
Indirect Sales
Countries Analyzed
North America (US, Canada, Mexico)
Europe (Germany, UK, France, Spain, Italy, Russia, Rest of Europe)
Asia Pacific (China, India, Japan, South Korea, Australia, South East Asia, Rest of Asia)
South America (Brazil, Argentina, Rest of South America)
Middle East and Africa (Saudi Arabia, UAE, Rest of Middle East, South Africa, Egypt, Rest of Africa)
