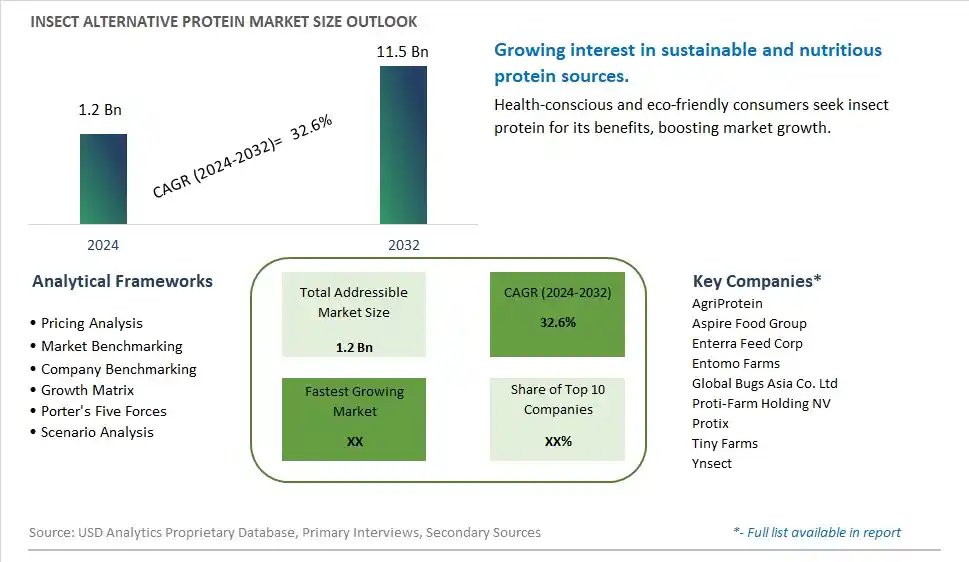
Global Insect Alternative Protein Market Size is valued at $1.2 Billion in 2024 and is forecast to register a growth rate (CAGR) of 32.6% to reach $11.5 Billion by 2032.
The global Insect Alternative Protein Market Comprehensive Study analyzes and forecasts the market size across 6 regions and 24 countries for diverse segments -By Type (Emerging, Adolescent, Matured), By Application (Food, Feed, Others)
An Introduction to Insect Alternative Protein Market
In 2024, the insect alternative protein market is expanding rapidly, driven by the increasing demand for sustainable and nutritious protein sources. Insect proteins, derived from crickets, mealworms, and other insects, offer high protein content and essential nutrients with a lower environmental footprint. The market is witnessing growing acceptance among consumers and food manufacturers, supported by innovations in processing and product development. Regulatory support and rising awareness of the environmental benefits of insect protein are further propelling market growth.
Insect Alternative Protein Competitive Landscape
The market report analyses the leading companies in the industry including AgriProtein, Aspire Food Group, Enterra Feed Corp, Entomo Farms, Global Bugs Asia Co. Ltd, Proti-Farm Holding NV, Protix, Tiny Farms, Ynsect, and Others.
Insect Alternative Protein Market Dynamics
Insect Alternative Protein Market Trend: Rising Popularity of Sustainable and Novel Protein Sources
The most prominent trend in the Insect Alternative Protein Market is the rising popularity of sustainable and novel protein sources. Consumers are increasingly seeking alternative proteins that have a lower environmental impact compared to traditional animal proteins. Insect protein, known for its high nutritional value and sustainable production, is gaining traction as a viable alternative. This trend is driven by the growing awareness of the environmental benefits of insect farming, including reduced greenhouse gas emissions, lower land and water use, and efficient feed conversion. The demand for sustainable protein sources is encouraging manufacturers to explore the potential of insect protein in various food and feed applications.
Insect Alternative Protein Market Driver: Increasing Demand for High-Quality and Nutritious Protein
A key driver for the Insect Alternative Protein Market is the increasing demand for high-quality and nutritious protein. As the global population grows and protein consumption rises, there is a growing need for protein sources that are both nutritious and sustainable. Insect protein, which is rich in essential amino acids, vitamins, and minerals, is being recognized for its nutritional benefits. The emphasis on health and nutrition is significantly driving the market for insect alternative protein as consumers and industries seek reliable and sustainable protein options.
Insect Alternative Protein Market Opportunity: Expansion into Mainstream Food and Feed Markets
One potential opportunity in the Insect Alternative Protein Market lies in the expansion into mainstream food and feed markets. While insect protein has gained acceptance in niche markets, there is a substantial opportunity to integrate it into mainstream food products such as protein bars, snacks, and meat alternatives, as well as animal feed. By focusing on product development, consumer education, and regulatory approval, manufacturers can increase the adoption of insect protein in everyday diets and feed formulations. This focus on mainstream integration can drive market growth and enhance the visibility and acceptance of insect alternative protein.
Insect Alternative Protein Market Share Analysis: Matured segment generated the highest revenue share in the industry
Among the types in the Insect Alternative Protein Market, the Matured segment is the largest. Matured insect proteins refer to those that have reached full growth and development stages, offering optimal protein content and nutritional benefits. These proteins are processed from mature insects like crickets, mealworms, and black soldier flies, which are rich sources of essential amino acids, vitamins, and minerals. The maturity stage ensures that these insect proteins are harvested at their peak nutritional value, making them suitable for various applications in the food and feed industries. Their nutritional profile and sustainable production methods contribute to their popularity as alternative protein sources.
Insect Alternative Protein Market Share Analysis: Food is the fastest growing segment over the forecast period to 2032
The Food application segment is expected to be the fastest-growing in the Insect Alternative Protein Market through 2032. This growth is driven by increasing consumer awareness of sustainable protein sources and the demand for nutritious, eco-friendly food options. Insect proteins are gaining traction as ingredients in food products such as protein bars, snacks, baked goods, and meat substitutes due to their high protein content, low environmental impact, and potential health benefits. Innovations in food processing techniques and product formulations are expanding the use of insect proteins in culinary applications, catering to diverse dietary preferences and sustainability goals.
Insect Alternative Protein Market Segmentation
By Type
Emerging
Adolescent
Matured
By Application
Food
Feed
Others
Countries Analyzed
North America (US, Canada, Mexico)
Europe (Germany, UK, France, Spain, Italy, Russia, Rest of Europe)
Asia Pacific (China, India, Japan, South Korea, Australia, South East Asia, Rest of Asia)
South America (Brazil, Argentina, Rest of South America)
Middle East and Africa (Saudi Arabia, UAE, Rest of Middle East, South Africa, Egypt, Rest of Africa)
Insect Alternative Protein Companies Profiled in the Study
AgriProtein
Aspire Food Group
Enterra Feed Corp
Entomo Farms
Global Bugs Asia Co. Ltd
Proti-Farm Holding NV
Protix
Tiny Farms
Ynsect
*- List Not Exhaustive
Chapter 1. TABLE OF CONTENTS
Chapter 2. Introduction to Insect Alternative Protein Market
2.1. Market Overview
2.2. Key Statistics and Report Highlights
2.3. Scope of the Comprehensive Study
2.3.1. Market Definition
2.3.2 Countries and Regions Covered
2.3.3 Research Objective
2.3.4 Units, Currency, and Conversions
2.3.5 Industry Value Chain
2.4. Key Market Segments
2.5. Key Companies
2.6. Study Period
Chapter 3. Strategic Analysis Review
3.1. Insect Alternative Protein Pricing Analysis and Forecast
3.2. Porter’s Five Forces
3.3. Market Ecosystem
3.4. SWOT Analysis
3.5. Regulatory Scenario
3.3. Effects of Inflation, Russia-Ukraine War, moderating economic growth, and other macroeconomic factors
Chapter 4. Competitive Landscape
4.1. Market Share Analysis
4.1.1. Global Insect Alternative Protein Market Share by Company, 2023
4.1.2. Product Offerings of Leading Insect Alternative Protein Companies
4.2. Market Entropy
4.2.1. New Product Launches in the Industry
4.2.2. Mergers, Acquisitions, Joint ventures, and Partnerships
4.3. Key Strategies and Best Practices
Chapter 5. Global Market Projections: Best, Reference, and Low Case Scenarios
5.1. Growth Analysis- Case Scenario Definitions
5.2. Low Growth Case Scenario Forecasts
5.3. Reference Growth Case Scenario Forecasts
5.4. High Growth Case Scenario Forecasts
Chapter 6. Market Dynamics
6.1. Insect Alternative Protein Market Drivers
6.2. Insect Alternative Protein Market Challenges
6.6. Insect Alternative Protein Market Opportunities
6.4. Insect Alternative Protein Market Trends
Chapter 7. Global Insect Alternative Protein Market Outlook Trends
7.1. Global Insect Alternative Protein Revenue (USD Million) and CAGR (%) by Type (2021-2032)
7.2. Global Insect Alternative Protein Revenue (USD Million) and CAGR (%) by Application (2021-2032)
7.3. Global Insect Alternative Protein Revenue (USD Million) and CAGR (%) by Product (2021-2032)
By Type
Emerging
Adolescent
Matured
By Application
Food
Feed
Others
Chapter 8. Global Insect Alternative Protein Regional Analysis and Outlook
8.1. Global Insect Alternative Protein Revenue (USD Million) By Regions (2021- 2032)
8.2. North America Insect Alternative Protein Revenue (USD Million) by Country (2021-2032)
8.2.1. United States Insect Alternative Protein Regional Analysis and Outlook
8.2.2. Canada Insect Alternative Protein Regional Analysis and Outlook
8.2.3. Mexico Insect Alternative Protein Regional Analysis and Outlook
8.3. Europe Insect Alternative Protein Revenue (USD Million), by Country (2021-2032)
8.3.1. Germany Insect Alternative Protein Regional Analysis and Outlook
8.3.2. France Insect Alternative Protein Regional Analysis and Outlook
8.3.3. United Kingdom Insect Alternative Protein Regional Analysis and Outlook
8.3.4. Spain Insect Alternative Protein Regional Analysis and Outlook
8.3.5. Italy Insect Alternative Protein Regional Analysis and Outlook
8.3.6. Russia Insect Alternative Protein Regional Analysis and Outlook
8.3.7. Rest of Europe Insect Alternative Protein Regional Analysis and Outlook
8.4. Asia Pacific Insect Alternative Protein Revenue (USD Million) by Country (2021-2032)
8.4.1. China Insect Alternative Protein Regional Analysis and Outlook
8.4.2. Japan Insect Alternative Protein Regional Analysis and Outlook
8.4.3. India Insect Alternative Protein Regional Analysis and Outlook
8.4.4. South Korea Insect Alternative Protein Regional Analysis and Outlook
8.4.5. Australia Insect Alternative Protein Regional Analysis and Outlook
8.4.6. South East Asia Insect Alternative Protein Regional Analysis and Outlook
8.4.7. Rest of Asia Pacific Insect Alternative Protein Regional Analysis and Outlook
8.5. South America Insect Alternative Protein Revenue (USD Million), by Country (2021-2032)
8.5.1. Brazil Insect Alternative Protein Regional Analysis and Outlook
8.5.2. Argentina Insect Alternative Protein Regional Analysis and Outlook
8.5.3. Rest of South America Insect Alternative Protein Regional Analysis and Outlook
8.6. Middle East and Africa Insect Alternative Protein Revenue (USD Million) by Country (2021-2032)
8.6.1. Middle East Insect Alternative Protein Regional Analysis and Outlook
8.6.2. Africa Insect Alternative Protein Regional Analysis and Outlook
Chapter 9. North America Insect Alternative Protein Analysis and Outlook
9.1. North America Insect Alternative Protein Revenue (USD Million) by Segments (2021-2032)
9.1.1. North America Insect Alternative Protein Revenue (USD Million) by Type (2021-2032)
9.1.2. North America Insect Alternative Protein Revenue (USD Million) by Application (2021-2032)
9.1.3. North America Insect Alternative Protein Revenue (USD Million) by Product (2021-2032)
By Type
Emerging
Adolescent
Matured
By Application
Food
Feed
Others
Chapter 10. Europe Insect Alternative Protein Analysis and Outlook
10.1. Europe Insect Alternative Protein Revenue (USD Million), by Segments (USD Million) (2021-2032)
10.1.1. Europe Insect Alternative Protein Revenue (USD Million) by Type (2021-2032)
10.1.2. Europe Insect Alternative Protein Revenue (USD Million) by Application (2021-2032)
10.1.3. Europe Insect Alternative Protein Revenue (USD Million) by Product (2021-2032)
By Type
Emerging
Adolescent
Matured
By Application
Food
Feed
Others
Chapter 11. Asia Pacific Insect Alternative Protein Analysis and Outlook
11.1. Asia Pacific Insect Alternative Protein Revenue (USD Million), and Revenue (USD Million) by Segments (2021-2032)
11.1.1. Asia Pacific Insect Alternative Protein Revenue (USD Million) by Type (2021-2032)
11.1.2. Asia Pacific Insect Alternative Protein Revenue (USD Million) by Application (2021-2032)
11.1.3. Asia Pacific Insect Alternative Protein Revenue (USD Million) by Product (2021-2032)
By Type
Emerging
Adolescent
Matured
By Application
Food
Feed
Others
Chapter 12. South America Insect Alternative Protein Analysis and Outlook
12.1. South America Insect Alternative Protein Revenue (USD Million), by Segments (2021-2032)
12.1.1. South America Insect Alternative Protein Revenue (USD Million) by Type (2021-2032)
12.1.2. South America Insect Alternative Protein Revenue (USD Million) by Application (2021-2032)
12.1.3. South America Insect Alternative Protein Revenue (USD Million) by Product (2021-2032)
By Type
Emerging
Adolescent
Matured
By Application
Food
Feed
Others
Chapter 13. Middle East and Africa Insect Alternative Protein Analysis and Outlook
13.1. Middle East and Africa Insect Alternative Protein Revenue (USD Million), by Segments (2021-2032)
13.1.1. Middle East and Africa Insect Alternative Protein Revenue (USD Million) by Type (2021-2032)
13.1.2. Middle East and Africa Insect Alternative Protein Revenue (USD Million) by Application (2021-2032)
13.1.3. Middle East and Africa Insect Alternative Protein Revenue (USD Million) by Product (2021-2032)
By Type
Emerging
Adolescent
Matured
By Application
Food
Feed
Others
Chapter 14. Insect Alternative Protein Company Profiles
14.1 Business Overview
14.2 Product Profiles
14.3 SWOT Profiles
14.5 Recent Developments
14.6 Financial Profile
List of Companies
AgriProtein
Aspire Food Group
Enterra Feed Corp
Entomo Farms
Global Bugs Asia Co. Ltd
Proti-Farm Holding NV
Protix
Tiny Farms
Ynsect
15. Methodology and Data Sources
15.1 Customization Offerings
15.2 Subscription Services
15.3 Related Reports
15.4 Publisher Expertise
LIST OF TABLES
Table 1 Market Segmentation Analysis
Table 2 Global Insect Alternative Protein Market Share of Leading Companies, 2023
Table 3 Product Offerings of Leading Companies
Table 4 Low Growth Scenario Forecasts
Table 5 Reference Case Growth Scenario
Table 6 High Growth Case Scenario
Table 7 Global Insect Alternative Protein Revenue (USD Million) And CAGR (%) By Type (2021-2032)
Table 8 Global Insect Alternative Protein Revenue (USD Million) And CAGR (%) By Application (2021-2032)
Table 9 Global Insect Alternative Protein Revenue (USD Million) And CAGR (%) By Product (2021-2032)
Table 10 Global Insect Alternative Protein Market Revenue (USD Million) By Regions (2021-2032)
Table 11 Global Insect Alternative Protein Market Share (%) By Regions (2021-2032)
Table 12 North America Insect Alternative Protein Revenue (USD Million) By Country (2021-2032)
Table 13 Europe Insect Alternative Protein Revenue (USD Million) By Country (2021-2032)
Table 14 Asia Pacific Insect Alternative Protein Revenue (USD Million) By Country (2021-2032)
Table 15 South America Insect Alternative Protein Revenue (USD Million) By Country (2021-2032)
Table 16 Middle East and Africa Insect Alternative Protein Revenue (USD Million) By Region (2021-2032)
Table 17 North America Insect Alternative Protein Revenue (USD Million) By Type (2021-2032)
Table 18 North America Insect Alternative Protein Revenue (USD Million) By Application (2021-2032)
Table 19 North America Insect Alternative Protein Revenue (USD Million) By Product (2021-2032)
Table 20 Europe Insect Alternative Protein Revenue (USD Million) By Type (2021-2032)
Table 21 Europe Insect Alternative Protein Revenue (USD Million) By Application (2021-2032)
Table 22 Europe Insect Alternative Protein Revenue (USD Million) By Product (2021-2032)
Table 23 Asia Pacific Insect Alternative Protein Revenue (USD Million) By Type (2021-2032)
Table 24 Asia Pacific Insect Alternative Protein Revenue (USD Million) By Application (2021-2032)
Table 25 Asia Pacific Insect Alternative Protein Revenue (USD Million) By Product (2021-2032)
Table 26 South America Insect Alternative Protein Revenue (USD Million) By Type (2021-2032)
Table 27 South America Insect Alternative Protein Revenue (USD Million) By Application (2021-2032)
Table 28 South America Insect Alternative Protein Revenue (USD Million) By Product (2021-2032)
Table 29 Middle East and Africa Insect Alternative Protein Revenue (USD Million) By Type (2021-2032)
Table 30 Middle East and Africa Insect Alternative Protein Revenue (USD Million) By Application (2021-2032)
Table 31 Middle East and Africa Insect Alternative Protein Revenue (USD Million) By Product (2021-2032)
LIST OF FIGURES
Figure 1. Market Scope
Figure 2. Pricing Forecasts Per Unit, 2023- 2032
Figure 3. Porter’s Five Forces
Figure 4. Global Insect Alternative Protein Market Revenue (USD Million) By Regions (2021-2032)
Figure 5. Global Insect Alternative Protein Market Share (%) By Regions (2023)
Figure 6. North America Insect Alternative Protein Revenue (USD Million) By Country (2021-2032)
Figure 7. United States Insect Alternative Protein Revenue (USD Million) By Country (2021-2032)
Figure 8. Canada Insect Alternative Protein Revenue (USD Million) By Country (2021-2032)
Figure 9. Mexico Insect Alternative Protein Revenue (USD Million) By Country (2021-2032)
Figure 10. Europe Insect Alternative Protein Revenue (USD Million) By Country (2021-2032)
Figure 11. Germany Insect Alternative Protein Revenue (USD Million) By Country (2021-2032)
Figure 12. France Insect Alternative Protein Revenue (USD Million) By Country (2021-2032)
Figure 13. United Kingdom Insect Alternative Protein Revenue (USD Million) By Country (2021-2032)
Figure 14. Spain Insect Alternative Protein Revenue (USD Million) By Country (2021-2032)
Figure 15. Italy Insect Alternative Protein Revenue (USD Million) By Country (2021-2032)
Figure 16. Russia Insect Alternative Protein Revenue (USD Million) By Country (2021-2032)
Figure 17. Rest of Europe Insect Alternative Protein Revenue (USD Million) By Country (2021-2032)
Figure 11. Asia Pacific Insect Alternative Protein Revenue (USD Million) By Country (2021-2032)
Figure 12. China Insect Alternative Protein Revenue (USD Million) By Country (2021-2032)
Figure 13. Japan Insect Alternative Protein Revenue (USD Million) By Country (2021-2032)
Figure 14. India Insect Alternative Protein Revenue (USD Million) By Country (2021-2032)
Figure 15. South Korea Insect Alternative Protein Revenue (USD Million) By Country (2021-2032)
Figure 16. Australia Insect Alternative Protein Revenue (USD Million) By Country (2021-2032)
Figure 17. South East Asia Insect Alternative Protein Revenue (USD Million) By Country (2021-2032)
Figure 18. South America Insect Alternative Protein Revenue (USD Million) By Country (2021-2032)
Figure 19. Brazil Insect Alternative Protein Revenue (USD Million) By Country (2021-2032)
Figure 20. Argentina Insect Alternative Protein Revenue (USD Million) By Country (2021-2032)
Figure 21. Rest of Asia Pacific Insect Alternative Protein Revenue (USD Million) By Country (2021-2032)
Figure 22. Middle East and Africa Insect Alternative Protein Revenue (USD Million) By Region (2021-2032)
Figure 23. Saudi Arabia Insect Alternative Protein Revenue (USD Million) By Region (2021-2032)
Figure 24. The UAE Insect Alternative Protein Revenue (USD Million) By Region (2021-2032)
Figure 25. Rest of Middle East Insect Alternative Protein Revenue (USD Million) By Region (2021-2032)
Figure 26. South Africa Insect Alternative Protein Revenue (USD Million) By Region (2021-2032)
Figure 27. Africa Insect Alternative Protein Revenue (USD Million) By Region (2021-2032)
Figure 28. North America Insect Alternative Protein Revenue (USD Million) By Type (2021-2032)
Figure 29. North America Insect Alternative Protein Revenue (USD Million) By Application (2021-2032)
Figure 30. North America Insect Alternative Protein Revenue (USD Million) By Product (2021-2032)
Figure 31. Europe Insect Alternative Protein Revenue (USD Million) By Type (2021-2032)
Figure 32. Europe Insect Alternative Protein Revenue (USD Million) By Application (2021-2032)
Figure 33. Europe Insect Alternative Protein Revenue (USD Million) By Product (2021-2032)
Figure 34. Asia Pacific Insect Alternative Protein Revenue (USD Million) By Type (2021-2032)
Figure 35. Asia Pacific Insect Alternative Protein Revenue (USD Million) By Application (2021-2032)
Figure 36. Asia Pacific Insect Alternative Protein Revenue (USD Million) By Product (2021-2032)
Figure 37. South America Insect Alternative Protein Revenue (USD Million) By Type (2021-2032)
Figure 38. South America Insect Alternative Protein Revenue (USD Million) By Application (2021-2032)
Figure 39. South America Insect Alternative Protein Revenue (USD Million) By Product (2021-2032)
Figure 40. Middle East and Africa Insect Alternative Protein Revenue (USD Million) By Type (2021-2032)
Figure 41. Middle East and Africa Insect Alternative Protein Revenue (USD Million) By Application (2021-2032)
Figure 42. Middle East and Africa Insect Alternative Protein Revenue (USD Million) By Product (2021-2032)
By Type
Emerging
Adolescent
Matured
By Application
Food
Feed
Others
Countries Analyzed
North America (US, Canada, Mexico)
Europe (Germany, UK, France, Spain, Italy, Russia, Rest of Europe)
Asia Pacific (China, India, Japan, South Korea, Australia, South East Asia, Rest of Asia)
South America (Brazil, Argentina, Rest of South America)
Middle East and Africa (Saudi Arabia, UAE, Rest of Middle East, South Africa, Egypt, Rest of Africa)
