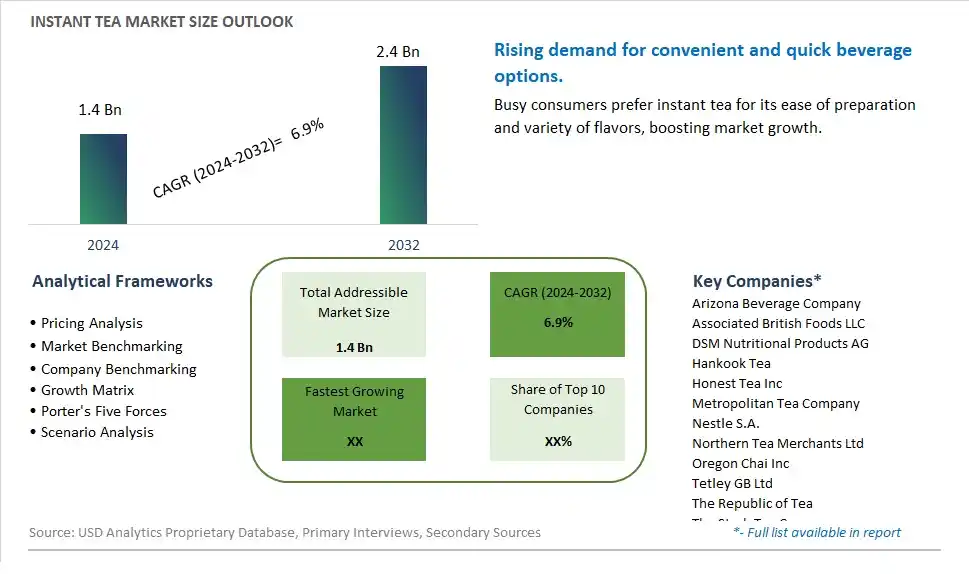
Global Instant Tea Market Size is valued at $1.4 Billion in 2024 and is forecast to register a growth rate (CAGR) of 6.9% to reach $2.4 Billion by 2032.
The global Instant Tea Market Comprehensive Study analyzes and forecasts the market size across 6 regions and 24 countries for diverse segments -By Application (Commercial, Residential), By Form (Paste, Powder, Granules)
An Introduction to Instant Tea Market
The instant tea market in 2024 is experiencing significant expansion, driven by evolving consumer lifestyles, convenience-driven preferences, and innovative product formulations. With an increasing emphasis on health and wellness, consumers are seeking convenient yet nutritious beverage options, propelling the demand for instant tea products. Manufacturers are responding by introducing a wide array of instant tea varieties, including herbal blends, green teas, and flavored options, to cater to diverse taste preferences. Moreover, advancements in processing technologies have enabled the retention of tea's natural antioxidants and flavors, enhancing the appeal of instant tea as a healthy beverage choice. Furthermore, strategic marketing initiatives and product innovations are fostering market penetration and driving sustained growth in the instant tea segment.
Instant Tea Competitive Landscape
The market report analyses the leading companies in the industry including Arizona Beverage Company, Associated British Foods LLC, DSM Nutritional Products AG, Hankook Tea, Honest Tea Inc, Metropolitan Tea Company, Nestle S.A., Northern Tea Merchants Ltd, Oregon Chai Inc, Tetley GB Ltd, The Republic of Tea, The Stash Tea Company, Yogi Tea, and Others.
Instant Tea Market Dynamics
Instant Tea Market Trend: Convenience and On-the-Go Consumption
An increasingly prominent trend in the instant tea market is the growing demand for convenience and on-the-go consumption. As consumers lead busier lifestyles and seek convenient beverage options, instant tea offers a quick and hassle-free solution for enjoying tea on the move. The rise of urbanization, hectic work schedules, and the prevalence of fast-paced lifestyles have contributed to the popularity of instant tea products, which require minimal preparation and can be enjoyed anytime, anywhere. This trend is further fueled by the increasing popularity of ready-to-drink beverages and single-serve packaging formats, catering to the need for convenience among modern consumers.
Market Driver: Rising Health Consciousness and Demand for Functional Beverages
A significant driver for the instant tea market is the rising health consciousness among consumers and their growing preference for functional beverages. Instant tea products are often perceived as healthier alternatives to sugary soft drinks and artificially flavored beverages. With increasing awareness of the health benefits associated with tea consumption, including antioxidants, polyphenols, and potential health-promoting properties, consumers are turning to instant tea as a convenient way to incorporate tea into their daily routines. Moreover, the availability of instant tea variants enriched with vitamins, minerals, and herbal extracts appeals to health-conscious consumers seeking functional beverages that offer additional nutritional value and wellness benefits.
Market Opportunity: Product Innovation and Flavor Diversification
An opportunity for the instant tea market lies in product innovation and flavor diversification to cater to evolving consumer preferences and taste profiles. While traditional tea flavors like black tea and green tea remain popular, there is potential for manufacturers to introduce a wider range of flavors and blends to attract diverse consumer segments. This includes fruit-infused instant teas, herbal tea blends, and exotic tea flavors inspired by global culinary traditions. Additionally, there is an opportunity to develop instant tea products tailored to specific dietary preferences, such as organic, caffeine-free, or sugar-free options, to appeal to health-conscious and environmentally conscious consumers. By continuously innovating and expanding their product portfolios, companies can stay ahead of market trends and capture a larger share of the growing instant tea market.
Instant Tea Market Share Analysis: Commercial Application Segment held the dominant market share in 2024
Within the Instant Tea market, the Commercial Application segment is the largest category, commanding a significant share due to the widespread use of instant tea in the foodservice industry, hospitality sector, and beverage manufacturing. Commercial establishments such as restaurants, cafes, hotels, and catering services rely on instant tea for its convenience, speed of preparation, and consistent quality, allowing them to efficiently serve large volumes of tea to customers. Further, instant tea is a preferred choice for ready-to-drink beverages, iced tea mixes, and flavored tea blends produced by beverage companies, catering to the growing demand for on-the-go and convenience beverages among consumers. With its broad application and popularity in the commercial sector, the Commercial Application segment continues to lead the Instant Tea market, presenting significant opportunities for manufacturers to cater to the needs of businesses and capitalize on the expanding foodservice and beverage industries.
Instant Tea Market Share Analysis: Powder Form Segment market is poised to register the fastest growth rae over the forecast period to 2032
Among the segments in the Instant Tea market, the Powder Form segment is the fastest-growing category, driven by its convenience, versatility, and increasing consumer demand for instant beverage solutions. Powdered instant tea offers quick and effortless preparation, allowing consumers to enjoy a refreshing cup of tea with minimal time and effort. Further, powdered instant tea can be easily customized with various flavors, sweeteners, and additives to cater to diverse consumer preferences, including iced tea mixes, flavored tea blends, and functional tea formulations. The portability and longer shelf life of powdered instant tea make it an ideal choice for on-the-go consumption, travel, and outdoor activities. Additionally, advancements in manufacturing processes and packaging technologies have improved the solubility, flavor retention, and sensory attributes of powdered instant tea, further fueling its popularity among consumers seeking convenient and high-quality beverage options. With its ease of use, versatility, and consumer appeal, the Powder Form segment experiences exponential growth in the Instant Tea market, presenting significant opportunities for manufacturers to innovate and capture market share in the rapidly expanding instant beverage industry.
Instant Tea Market Segmentation
By Application
Commercial
Residential
By Form
Paste
Powder
Granules
Countries Analyzed
North America (US, Canada, Mexico)
Europe (Germany, UK, France, Spain, Italy, Russia, Rest of Europe)
Asia Pacific (China, India, Japan, South Korea, Australia, South East Asia, Rest of Asia)
South America (Brazil, Argentina, Rest of South America)
Middle East and Africa (Saudi Arabia, UAE, Rest of Middle East, South Africa, Egypt, Rest of Africa)
Instant Tea Companies Profiled in the Study
Arizona Beverage Company
Associated British Foods LLC
DSM Nutritional Products AG
Hankook Tea
Honest Tea Inc
Metropolitan Tea Company
Nestle S.A.
Northern Tea Merchants Ltd
Oregon Chai Inc
Tetley GB Ltd
The Republic of Tea
The Stash Tea Company
Yogi Tea
*- List Not Exhaustive
Chapter 1. TABLE OF CONTENTS
Chapter 2. Introduction to Instant Tea Market
2.1. Market Overview
2.2. Key Statistics and Report Highlights
2.3. Scope of the Comprehensive Study
2.3.1. Market Definition
2.3.2 Countries and Regions Covered
2.3.3 Research Objective
2.3.4 Units, Currency, and Conversions
2.3.5 Industry Value Chain
2.4. Key Market Segments
2.5. Key Companies
2.6. Study Period
Chapter 3. Strategic Analysis Review
3.1. Instant Tea Pricing Analysis and Forecast
3.2. Porter’s Five Forces
3.3. Market Ecosystem
3.4. SWOT Analysis
3.5. Regulatory Scenario
3.3. Effects of Inflation, Russia-Ukraine War, moderating economic growth, and other macroeconomic factors
Chapter 4. Competitive Landscape
4.1. Market Share Analysis
4.1.1. Global Instant Tea Market Share by Company, 2023
4.1.2. Product Offerings of Leading Instant Tea Companies
4.2. Market Entropy
4.2.1. New Product Launches in the Industry
4.2.2. Mergers, Acquisitions, Joint ventures, and Partnerships
4.3. Key Strategies and Best Practices
Chapter 5. Global Market Projections: Best, Reference, and Low Case Scenarios
5.1. Growth Analysis- Case Scenario Definitions
5.2. Low Growth Case Scenario Forecasts
5.3. Reference Growth Case Scenario Forecasts
5.4. High Growth Case Scenario Forecasts
Chapter 6. Market Dynamics
6.1. Instant Tea Market Drivers
6.2. Instant Tea Market Challenges
6.6. Instant Tea Market Opportunities
6.4. Instant Tea Market Trends
Chapter 7. Global Instant Tea Market Outlook Trends
7.1. Global Instant Tea Revenue (USD Million) and CAGR (%) by Type (2021-2032)
7.2. Global Instant Tea Revenue (USD Million) and CAGR (%) by Application (2021-2032)
7.3. Global Instant Tea Revenue (USD Million) and CAGR (%) by Product (2021-2032)
By Application
Commercial
Residential
By Form
Paste
Powder
Granules
Chapter 8. Global Instant Tea Regional Analysis and Outlook
8.1. Global Instant Tea Revenue (USD Million) By Regions (2021- 2032)
8.2. North America Instant Tea Revenue (USD Million) by Country (2021-2032)
8.2.1. United States Instant Tea Regional Analysis and Outlook
8.2.2. Canada Instant Tea Regional Analysis and Outlook
8.2.3. Mexico Instant Tea Regional Analysis and Outlook
8.3. Europe Instant Tea Revenue (USD Million), by Country (2021-2032)
8.3.1. Germany Instant Tea Regional Analysis and Outlook
8.3.2. France Instant Tea Regional Analysis and Outlook
8.3.3. United Kingdom Instant Tea Regional Analysis and Outlook
8.3.4. Spain Instant Tea Regional Analysis and Outlook
8.3.5. Italy Instant Tea Regional Analysis and Outlook
8.3.6. Russia Instant Tea Regional Analysis and Outlook
8.3.7. Rest of Europe Instant Tea Regional Analysis and Outlook
8.4. Asia Pacific Instant Tea Revenue (USD Million) by Country (2021-2032)
8.4.1. China Instant Tea Regional Analysis and Outlook
8.4.2. Japan Instant Tea Regional Analysis and Outlook
8.4.3. India Instant Tea Regional Analysis and Outlook
8.4.4. South Korea Instant Tea Regional Analysis and Outlook
8.4.5. Australia Instant Tea Regional Analysis and Outlook
8.4.6. South East Asia Instant Tea Regional Analysis and Outlook
8.4.7. Rest of Asia Pacific Instant Tea Regional Analysis and Outlook
8.5. South America Instant Tea Revenue (USD Million), by Country (2021-2032)
8.5.1. Brazil Instant Tea Regional Analysis and Outlook
8.5.2. Argentina Instant Tea Regional Analysis and Outlook
8.5.3. Rest of South America Instant Tea Regional Analysis and Outlook
8.6. Middle East and Africa Instant Tea Revenue (USD Million) by Country (2021-2032)
8.6.1. Middle East Instant Tea Regional Analysis and Outlook
8.6.2. Africa Instant Tea Regional Analysis and Outlook
Chapter 9. North America Instant Tea Analysis and Outlook
9.1. North America Instant Tea Revenue (USD Million) by Segments (2021-2032)
9.1.1. North America Instant Tea Revenue (USD Million) by Type (2021-2032)
9.1.2. North America Instant Tea Revenue (USD Million) by Application (2021-2032)
9.1.3. North America Instant Tea Revenue (USD Million) by Product (2021-2032)
By Application
Commercial
Residential
By Form
Paste
Powder
Granules
Chapter 10. Europe Instant Tea Analysis and Outlook
10.1. Europe Instant Tea Revenue (USD Million), by Segments (USD Million) (2021-2032)
10.1.1. Europe Instant Tea Revenue (USD Million) by Type (2021-2032)
10.1.2. Europe Instant Tea Revenue (USD Million) by Application (2021-2032)
10.1.3. Europe Instant Tea Revenue (USD Million) by Product (2021-2032)
By Application
Commercial
Residential
By Form
Paste
Powder
Granules
Chapter 11. Asia Pacific Instant Tea Analysis and Outlook
11.1. Asia Pacific Instant Tea Revenue (USD Million), and Revenue (USD Million) by Segments (2021-2032)
11.1.1. Asia Pacific Instant Tea Revenue (USD Million) by Type (2021-2032)
11.1.2. Asia Pacific Instant Tea Revenue (USD Million) by Application (2021-2032)
11.1.3. Asia Pacific Instant Tea Revenue (USD Million) by Product (2021-2032)
By Application
Commercial
Residential
By Form
Paste
Powder
Granules
Chapter 12. South America Instant Tea Analysis and Outlook
12.1. South America Instant Tea Revenue (USD Million), by Segments (2021-2032)
12.1.1. South America Instant Tea Revenue (USD Million) by Type (2021-2032)
12.1.2. South America Instant Tea Revenue (USD Million) by Application (2021-2032)
12.1.3. South America Instant Tea Revenue (USD Million) by Product (2021-2032)
By Application
Commercial
Residential
By Form
Paste
Powder
Granules
Chapter 13. Middle East and Africa Instant Tea Analysis and Outlook
13.1. Middle East and Africa Instant Tea Revenue (USD Million), by Segments (2021-2032)
13.1.1. Middle East and Africa Instant Tea Revenue (USD Million) by Type (2021-2032)
13.1.2. Middle East and Africa Instant Tea Revenue (USD Million) by Application (2021-2032)
13.1.3. Middle East and Africa Instant Tea Revenue (USD Million) by Product (2021-2032)
By Application
Commercial
Residential
By Form
Paste
Powder
Granules
Chapter 14. Instant Tea Company Profiles
14.1 Business Overview
14.2 Product Profiles
14.3 SWOT Profiles
14.5 Recent Developments
14.6 Financial Profile
List of Companies
Arizona Beverage Company
Associated British Foods LLC
DSM Nutritional Products AG
Hankook Tea
Honest Tea Inc
Metropolitan Tea Company
Nestle S.A.
Northern Tea Merchants Ltd
Oregon Chai Inc
Tetley GB Ltd
The Republic of Tea
The Stash Tea Company
Yogi Tea
15. Methodology and Data Sources
15.1 Customization Offerings
15.2 Subscription Services
15.3 Related Reports
15.4 Publisher Expertise
LIST OF TABLES
Table 1 Market Segmentation Analysis
Table 2 Global Instant Tea Market Share of Leading Companies, 2023
Table 3 Product Offerings of Leading Companies
Table 4 Low Growth Scenario Forecasts
Table 5 Reference Case Growth Scenario
Table 6 High Growth Case Scenario
Table 7 Global Instant Tea Revenue (USD Million) And CAGR (%) By Type (2021-2032)
Table 8 Global Instant Tea Revenue (USD Million) And CAGR (%) By Application (2021-2032)
Table 9 Global Instant Tea Revenue (USD Million) And CAGR (%) By Product (2021-2032)
Table 10 Global Instant Tea Market Revenue (USD Million) By Regions (2021-2032)
Table 11 Global Instant Tea Market Share (%) By Regions (2021-2032)
Table 12 North America Instant Tea Revenue (USD Million) By Country (2021-2032)
Table 13 Europe Instant Tea Revenue (USD Million) By Country (2021-2032)
Table 14 Asia Pacific Instant Tea Revenue (USD Million) By Country (2021-2032)
Table 15 South America Instant Tea Revenue (USD Million) By Country (2021-2032)
Table 16 Middle East and Africa Instant Tea Revenue (USD Million) By Region (2021-2032)
Table 17 North America Instant Tea Revenue (USD Million) By Type (2021-2032)
Table 18 North America Instant Tea Revenue (USD Million) By Application (2021-2032)
Table 19 North America Instant Tea Revenue (USD Million) By Product (2021-2032)
Table 20 Europe Instant Tea Revenue (USD Million) By Type (2021-2032)
Table 21 Europe Instant Tea Revenue (USD Million) By Application (2021-2032)
Table 22 Europe Instant Tea Revenue (USD Million) By Product (2021-2032)
Table 23 Asia Pacific Instant Tea Revenue (USD Million) By Type (2021-2032)
Table 24 Asia Pacific Instant Tea Revenue (USD Million) By Application (2021-2032)
Table 25 Asia Pacific Instant Tea Revenue (USD Million) By Product (2021-2032)
Table 26 South America Instant Tea Revenue (USD Million) By Type (2021-2032)
Table 27 South America Instant Tea Revenue (USD Million) By Application (2021-2032)
Table 28 South America Instant Tea Revenue (USD Million) By Product (2021-2032)
Table 29 Middle East and Africa Instant Tea Revenue (USD Million) By Type (2021-2032)
Table 30 Middle East and Africa Instant Tea Revenue (USD Million) By Application (2021-2032)
Table 31 Middle East and Africa Instant Tea Revenue (USD Million) By Product (2021-2032)
LIST OF FIGURES
Figure 1. Market Scope
Figure 2. Pricing Forecasts Per Unit, 2023- 2032
Figure 3. Porter’s Five Forces
Figure 4. Global Instant Tea Market Revenue (USD Million) By Regions (2021-2032)
Figure 5. Global Instant Tea Market Share (%) By Regions (2023)
Figure 6. North America Instant Tea Revenue (USD Million) By Country (2021-2032)
Figure 7. United States Instant Tea Revenue (USD Million) By Country (2021-2032)
Figure 8. Canada Instant Tea Revenue (USD Million) By Country (2021-2032)
Figure 9. Mexico Instant Tea Revenue (USD Million) By Country (2021-2032)
Figure 10. Europe Instant Tea Revenue (USD Million) By Country (2021-2032)
Figure 11. Germany Instant Tea Revenue (USD Million) By Country (2021-2032)
Figure 12. France Instant Tea Revenue (USD Million) By Country (2021-2032)
Figure 13. United Kingdom Instant Tea Revenue (USD Million) By Country (2021-2032)
Figure 14. Spain Instant Tea Revenue (USD Million) By Country (2021-2032)
Figure 15. Italy Instant Tea Revenue (USD Million) By Country (2021-2032)
Figure 16. Russia Instant Tea Revenue (USD Million) By Country (2021-2032)
Figure 17. Rest of Europe Instant Tea Revenue (USD Million) By Country (2021-2032)
Figure 11. Asia Pacific Instant Tea Revenue (USD Million) By Country (2021-2032)
Figure 12. China Instant Tea Revenue (USD Million) By Country (2021-2032)
Figure 13. Japan Instant Tea Revenue (USD Million) By Country (2021-2032)
Figure 14. India Instant Tea Revenue (USD Million) By Country (2021-2032)
Figure 15. South Korea Instant Tea Revenue (USD Million) By Country (2021-2032)
Figure 16. Australia Instant Tea Revenue (USD Million) By Country (2021-2032)
Figure 17. South East Asia Instant Tea Revenue (USD Million) By Country (2021-2032)
Figure 18. South America Instant Tea Revenue (USD Million) By Country (2021-2032)
Figure 19. Brazil Instant Tea Revenue (USD Million) By Country (2021-2032)
Figure 20. Argentina Instant Tea Revenue (USD Million) By Country (2021-2032)
Figure 21. Rest of Asia Pacific Instant Tea Revenue (USD Million) By Country (2021-2032)
Figure 22. Middle East and Africa Instant Tea Revenue (USD Million) By Region (2021-2032)
Figure 23. Saudi Arabia Instant Tea Revenue (USD Million) By Region (2021-2032)
Figure 24. The UAE Instant Tea Revenue (USD Million) By Region (2021-2032)
Figure 25. Rest of Middle East Instant Tea Revenue (USD Million) By Region (2021-2032)
Figure 26. South Africa Instant Tea Revenue (USD Million) By Region (2021-2032)
Figure 27. Africa Instant Tea Revenue (USD Million) By Region (2021-2032)
Figure 28. North America Instant Tea Revenue (USD Million) By Type (2021-2032)
Figure 29. North America Instant Tea Revenue (USD Million) By Application (2021-2032)
Figure 30. North America Instant Tea Revenue (USD Million) By Product (2021-2032)
Figure 31. Europe Instant Tea Revenue (USD Million) By Type (2021-2032)
Figure 32. Europe Instant Tea Revenue (USD Million) By Application (2021-2032)
Figure 33. Europe Instant Tea Revenue (USD Million) By Product (2021-2032)
Figure 34. Asia Pacific Instant Tea Revenue (USD Million) By Type (2021-2032)
Figure 35. Asia Pacific Instant Tea Revenue (USD Million) By Application (2021-2032)
Figure 36. Asia Pacific Instant Tea Revenue (USD Million) By Product (2021-2032)
Figure 37. South America Instant Tea Revenue (USD Million) By Type (2021-2032)
Figure 38. South America Instant Tea Revenue (USD Million) By Application (2021-2032)
Figure 39. South America Instant Tea Revenue (USD Million) By Product (2021-2032)
Figure 40. Middle East and Africa Instant Tea Revenue (USD Million) By Type (2021-2032)
Figure 41. Middle East and Africa Instant Tea Revenue (USD Million) By Application (2021-2032)
Figure 42. Middle East and Africa Instant Tea Revenue (USD Million) By Product (2021-2032)
By Application
Commercial
Residential
By Form
Paste
Powder
Granules
Countries Analyzed
North America (US, Canada, Mexico)
Europe (Germany, UK, France, Spain, Italy, Russia, Rest of Europe)
Asia Pacific (China, India, Japan, South Korea, Australia, South East Asia, Rest of Asia)
South America (Brazil, Argentina, Rest of South America)
Middle East and Africa (Saudi Arabia, UAE, Rest of Middle East, South Africa, Egypt, Rest of Africa)
