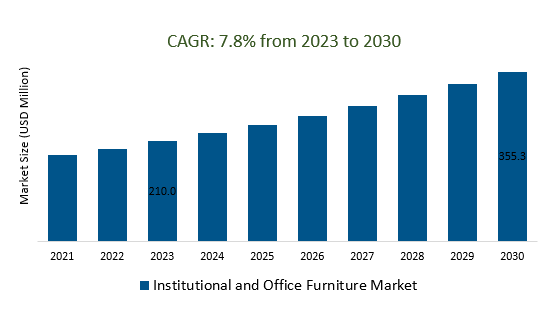
The global Institutional and Office Furniture Market Size is estimated to be US$ 210.0 Billion in 2023. It is poised to register 7.8% growth over the forecast period from 2023 to 2030 to reach US $ 355.3 billion in 2030.
The market growth is driven predominantly by Increasing emphasis on employee well-being and health is influencing the design of ergonomic furniture that promotes comfort, productivity, and a healthier work environment. Leading companies are focusing on Hybrid Work Models, Smart Furniture Integration, Well-Being-Centric Design, Sustainable Practices, Customization and Personalization, and others to boost market shares in the industry.
Market Overview
The Institutional and Office Furniture Market encompasses the design, manufacturing, and distribution of furniture tailored for various work environments, including offices, educational institutions, healthcare facilities, and public spaces. This market addresses the evolving needs of modern workplaces, where factors like employee well-being, productivity, and aesthetics are paramount. The market offers a wide range of furniture solutions, including desks, chairs, storage units, collaborative seating, and specialized furniture for specific industries Trends include a focus on ergonomic design, integration of technology, sustainability, and adaptability to flexible work arrangements. The market is driven by factors such as changing work cultures, the rise of remote and hybrid work models, demand for well-designed spaces, and the pursuit of eco-friendly practices. The Institutional and Office Furniture Market plays a crucial role in creating functional and inspiring environments that enhance productivity, collaboration, and employee satisfaction.
Market Trends- Companies are launching Technology Integration to attract a consumer base
Technology integration in the Institutional and Office Furniture Market refers to the incorporation of advanced technologies and digital solutions into furniture design to enhance functionality, user experience, and productivity within modern workspaces. This integration involves embedding features such as connectivity, smart controls, wireless charging, IoT-enabled sensors, and integrated power outlets directly into furniture items. By seamlessly merging technology with furniture, businesses can create more efficient and interactive work environments that cater to the needs of the digital age. This trend aligns with the increasing reliance on digital tools and devices, allowing furniture to support tasks like remote work, collaboration, communication, and data access while contributing to a seamless and connected workplace experience.
Market Driver- Wellness and Relaxation Areas demand for efficient Institutional and Office Furniture Market
The wellness and relaxation areas refer to the integration of furniture designed to promote mental and physical well-being within workspaces. These areas are designated for relaxation, meditation, rejuvenation, and mental breaks, acknowledging the importance of employee wellness in enhancing productivity and reducing stress. Furniture solutions for wellness areas might include comfortable seating, lounge chairs, ergonomic recliners, acoustic pods, and even yoga or meditation cushions. These spaces provide employees with the opportunity to recharge, destress, and improve focus, ultimately contributing to a healthier and more balanced work environment. The incorporation of wellness and relaxation furniture aligns with the growing emphasis on employee happiness, health, and holistic work experiences.
In the Institutional and Office Furniture Market, health and safety priorities involve integrating furniture solutions that cater to post-pandemic concerns, encompassing hygiene considerations, physical distancing, touchless technology, air quality enhancement, flexible layouts, PPE storage, barriers, ergonomic designs, wellness spaces, and communication facilitation. These priorities reflect a focus on creating safe, adaptable, and health-conscious work environments that address evolving workplace dynamics and employee well-being.
The global Institutional and Office Furniture market is analyzed across Office Furniture and Institutional Furniture. Of these, Office Furniture is poised to register the fastest growth. Office furniture in the Institutional and Office Furniture Market encompasses a wide range of furniture designed for various work settings within commercial, institutional, and corporate environments. This includes desks, chairs, workstations, conference tables, ergonomic seating, storage solutions, partitions, and collaborative furniture items tailored to enhance productivity, comfort, and aesthetics in office spaces. Office furniture caters to modern work trends, incorporating features such as technology integration, ergonomic design, sustainability, and adaptability to support different work styles, fostering a conducive and efficient work environment
.
Market Share Analysis- Exclusive showrooms held a significant market share in 2023
The global Institutional and Office Furniture market is analyzed across a wide range of Distribution channels including Exclusive showrooms, Online, Supermarkets, and Others. Of these, individuals held a significant market share in 2023. Exclusive showrooms in the Institutional and Office Furniture Market refer to dedicated spaces where manufacturers and suppliers showcase their furniture products and solutions to potential clients, professionals, and buyers. These showrooms provide a curated environment for displaying a variety of furniture options, styles, and designs, allowing visitors to experience the furniture firsthand. Exclusive showrooms play a crucial role in demonstrating the functionality, quality, and aesthetics of different furniture pieces, facilitating decision-making for businesses and individuals seeking furniture solutions for their office and institutional spaces. They also serve as platforms for introducing new products, highlighting trends, and engaging with customers in a personalized and immersive setting.
Institutional and Office Furniture Market Segmentation
By Type
- Institutional Furniture
- Office Furniture
By Distribution Channel
- Exclusive showrooms
- Online
- Supermarkets
- Others
By Raw Material
By Region
- North America (United States, Canada, Mexico)
- Europe (Germany, France, United Kingdom, Spain, Italy, Others)
- Asia Pacific (China, India, Japan, South Korea, Australia, Others)
- Latin America (Brazil, Argentina, Others)
- Middle East and Africa (Saudi Arabia, UAE, Kuwait, Other Middle East, South Africa, Nigeria, Other Africa)
Institutional and Office Furniture Market Companies
- Haworth Inc
- Steelcase Inc
- HNI Corporation
- Herman Miller Inc
- Okamura Corporation
- Itoki Corporation
- Knoll Inc
- Kokuyo Co Ltd
- Kimball International
- Godrej & Boyce Mfg. Co. Ltd.
* List not exhaustive
Institutional and Office Furniture Market Outlook 2023
1 Market Overview
1.1 Introduction to the Institutional and Office Furniture Market
1.2 Scope of the Study
1.3 Research Objective
1.3.1 Key Market Scope and Segments
1.3.2 Players Covered
1.3.3 Years Considered
2 Executive Summary
2.1 2023 Institutional and Office Furniture Industry- Market Statistics
3 Market Dynamics
3.1 Market Drivers
3.2 Market Challenges
3.3 Market Opportunities
3.4 Market Trends
4 Market Factor Analysis
4.1 Porter’s Five Forces
4.2 Market Entropy
4.2.1 Global Institutional and Office Furniture Market Companies with Area Served
4.2.2 Products Offerings Global Institutional and Office Furniture Market
5 COVID-19 Impact Analysis and Outlook Scenarios
5.1.1 Covid-19 Impact Analysis
5.1.2 Post-COVID-19 Scenario- Low Growth Case
5.1.3 Post-COVID-19 Scenario- Reference Growth Case
5.1.4 Post-COVID-19 Scenario- Low Growth Case
6 Global Institutional and Office Furniture Market Trends
6.1 Global Institutional and Office Furniture Revenue (USD Million) and CAGR (%) by Type (2018-2030)
6.2 Global Institutional and Office Furniture Revenue (USD Million) and CAGR (%) by Applications (2018-2030)
6.3 Global Institutional and Office Furniture Revenue (USD Million) and CAGR (%) by Regions (2018-2030)
7 Global Institutional and Office Furniture Market Revenue (USD Million) by Type, and Applications (2018-2022)
7.1 Global Institutional and Office Furniture Revenue (USD Million) by Type (2018-2022)
7.1.1 Global Institutional and Office Furniture Revenue (USD Million), Market Share (%) by Type (2018-2022)
7.2 Global Institutional and Office Furniture Revenue (USD Million) by Applications (2018-2022)
7.2.1 Global Institutional and Office Furniture Revenue (USD Million), Market Share (%) by Applications (2018-2022)
8 Global Institutional and Office Furniture Development Regional Status and Outlook
8.1 Global Institutional and Office Furniture Revenue (USD Million) By Regions (2018-2022)
8.2 North America Institutional and Office Furniture Revenue (USD Million) by Type, and Application (2018-2022)
8.2.1 North America Institutional and Office Furniture Revenue (USD Million) by Country (2018-2022)
8.2.2 North America Institutional and Office Furniture Revenue (USD Million) by Type (2018-2022)
8.2.3 North America Institutional and Office Furniture Revenue (USD Million) by Applications (2018-2022)
8.3 Europe Institutional and Office Furniture Revenue (USD Million), by Type, and Applications (USD Million) (2018-2022)
8.3.1 Europe Institutional and Office Furniture Revenue (USD Million), by Country (2018-2022)
8.3.2 Europe Institutional and Office Furniture Revenue (USD Million) by Type (2018-2022)
8.3.3 Europe Institutional and Office Furniture Revenue (USD Million) by Applications (2018-2022)
8.4 Asia Pacific Institutional and Office Furniture Revenue (USD Million), and Revenue (USD Million) by Type, and Applications (2018-2022)
8.4.1 Asia Pacific Institutional and Office Furniture Revenue (USD Million) by Country (2018-2022)
8.4.2 Asia Pacific Institutional and Office Furniture Revenue (USD Million) by Type (2018-2022)
8.4.3 Asia Pacific Institutional and Office Furniture Revenue (USD Million) by Applications (2018-2022)
8.5 South America Institutional and Office Furniture Revenue (USD Million), by Type, and Applications (2018-2022)
8.5.1 South America Institutional and Office Furniture Revenue (USD Million), by Country (2018-2022)
8.5.2 South America Institutional and Office Furniture Revenue (USD Million) by Type (2018-2022)
8.5.3 South America Institutional and Office Furniture Revenue (USD Million) by Applications (2018-2022)
8.6 Middle East and Africa Institutional and Office Furniture Revenue (USD Million), by Type, Technology, Application, Thickness (2018-2022)
8.6.1 Middle East and Africa Institutional and Office Furniture Revenue (USD Million) by Country (2018-2022)
8.6.2 Middle East and Africa Institutional and Office Furniture Revenue (USD Million) by Type (2018-2022)
8.6.3 Middle East and Africa Institutional and Office Furniture Revenue (USD Million) by Applications (2018-2022)
9 Company Profiles
10 Global Institutional and Office Furniture Market Revenue (USD Million), by Type, and Applications (2023-2030)
10.1 Global Institutional and Office Furniture Revenue (USD Million) and Market Share (%) by Type (2023-2030)
10.1.1 Global Institutional and Office Furniture Revenue (USD Million), and Market Share (%) by Type (2023-2030)
10.2 Global Institutional and Office Furniture Revenue (USD Million) and Market Share (%) by Applications (2023-2030)
10.2.1 Global Institutional and Office Furniture Revenue (USD Million), and Market Share (%) by Applications (2023-2030)
11 Global Institutional and Office Furniture Development Regional Status and Outlook Forecast
11.1 Global Institutional and Office Furniture Revenue (USD Million) By Regions (2023-2030)
11.2 North America Institutional and Office Furniture Revenue (USD Million) by Type, and Applications (2023-2030)
11.2.1 North America Institutional and Office Furniture Revenue (USD) Million by Country (2023-2030)
11.2.2 North America Institutional and Office Furniture Revenue (USD Million), by Type (2023-2030)
11.2.3 North America Institutional and Office Furniture Revenue (USD Million), Market Share (%) by Applications (2023-2030)
11.3 Europe Institutional and Office Furniture Revenue (USD Million), by Type, and Applications (2023-2030)
11.3.1 Europe Institutional and Office Furniture Revenue (USD Million), by Country (2023-2030)
11.3.2 Europe Institutional and Office Furniture Revenue (USD Million), by Type (2023-2030)
11.3.3 Europe Institutional and Office Furniture Revenue (USD Million), by Applications (2023-2030)
11.4 Asia Pacific Institutional and Office Furniture Revenue (USD Million) by Type, and Applications (2023-2030)
11.4.1 Asia Pacific Institutional and Office Furniture Revenue (USD Million), by Country (2023-2030)
11.4.2 Asia Pacific Institutional and Office Furniture Revenue (USD Million), by Type (2023-2030)
11.4.3 Asia Pacific Institutional and Office Furniture Revenue (USD Million), by Applications (2023-2030)
11.5 South America Institutional and Office Furniture Revenue (USD Million), by Type, and Applications (2023-2030)
11.5.1 South America Institutional and Office Furniture Revenue (USD Million), by Country (2023-2030)
11.5.2 South America Institutional and Office Furniture Revenue (USD Million), by Type (2023-2030)
11.5.3 South America Institutional and Office Furniture Revenue (USD Million), by Applications (2023-2030)
11.6 Middle East and Africa Institutional and Office Furniture Revenue (USD Million), by Type, and Applications (2023-2030)
11.6.1 Middle East and Africa Institutional and Office Furniture Revenue (USD Million), by Region (2023-2030)
11.6.2 Middle East and Africa Institutional and Office Furniture Revenue (USD Million), by Type (2023-2030)
11.6.3 Middle East and Africa Institutional and Office Furniture Revenue (USD Million), by Applications (2023-2030)
12 Methodology and Data Sources
12.1 Methodology/Research Approach
12.1.1 Research Programs/Design
12.1.2 Market Size Estimation
12.1.3 Market Breakdown and Data Triangulation
12.2 Data Sources
12.2.1 Secondary Sources
12.2.2 Primary Sources
12.3 Disclaimer
List of Tables
Table 1 Market Segmentation Analysis
Table 2 Global Institutional and Office Furniture Market Companies with Areas Served
Table 3 Products Offerings Global Institutional and Office Furniture Market
Table 4 Low Growth Scenario Forecasts
Table 5 Reference Case Growth Scenario
Table 6 High Growth Case Scenario
Table 7 Global Institutional and Office Furniture Revenue (USD Million) And CAGR (%) By Type (2018-2030)
Table 8 Global Institutional and Office Furniture Revenue (USD Million) And CAGR (%) By Applications (2018-2030)
Table 9 Global Institutional and Office Furniture Revenue (USD Million) And CAGR (%) By Regions (2018-2030)
Table 10 Global Institutional and Office Furniture Revenue (USD Million) By Type (2018-2022)
Table 11 Global Institutional and Office Furniture Revenue Market Share (%) By Type (2018-2022)
Table 12 Global Institutional and Office Furniture Revenue (USD Million) By Applications (2018-2022)
Table 13 Global Institutional and Office Furniture Revenue Market Share (%) By Applications (2018-2022)
Table 14 Global Institutional and Office Furniture Market Revenue (USD Million) By Regions (2018-2022)
Table 15 Global Institutional and Office Furniture Market Share (%) By Regions (2018-2022)
Table 16 North America Institutional and Office Furniture Revenue (USD Million) By Country (2018-2022)
Table 17 North America Institutional and Office Furniture Revenue (USD Million) By Type (2018-2022)
Table 18 North America Institutional and Office Furniture Revenue (USD Million) By Applications (2018-2022)
Table 19 Europe Institutional and Office Furniture Revenue (USD Million) By Country (2018-2022)
Table 20 Europe Institutional and Office Furniture Revenue (USD Million) By Type (2018-2022)
Table 21 Europe Institutional and Office Furniture Revenue (USD Million) By Applications (2018-2022)
Table 22 Asia Pacific Institutional and Office Furniture Revenue (USD Million) By Country (2018-2022)
Table 23 Asia Pacific Institutional and Office Furniture Revenue (USD Million) By Type (2018-2022)
Table 24 Asia Pacific Institutional and Office Furniture Revenue (USD Million) By Applications (2018-2022)
Table 25 South America Institutional and Office Furniture Revenue (USD Million) By Country (2018-2022)
Table 26 South America Institutional and Office Furniture Revenue (USD Million) By Type (2018-2022)
Table 27 South America Institutional and Office Furniture Revenue (USD Million) By Applications (2018-2022)
Table 28 Middle East and Africa Institutional and Office Furniture Revenue (USD Million) By Region (2018-2022)
Table 29 Middle East and Africa Institutional and Office Furniture Revenue (USD Million) By Type (2018-2022)
Table 30 Middle East and Africa Institutional and Office Furniture Revenue (USD Million) By Applications (2018-2022)
Table 31 Financial Analysis
Table 32 Global Institutional and Office Furniture Revenue (USD Million) By Type (2023-2030)
Table 33 Global Institutional and Office Furniture Revenue Market Share (%) By Type (2023-2030)
Table 34 Global Institutional and Office Furniture Revenue (USD Million) By Applications (2023-2030)
Table 35 Global Institutional and Office Furniture Revenue Market Share (%) By Applications (2023-2030)
Table 36 Global Institutional and Office Furniture Market Revenue (USD Million), And Revenue (USD Million) By Regions (2023-2030)
Table 37 North America Institutional and Office Furniture Revenue (USD)By Country (2023-2030)
Table 38 North America Institutional and Office Furniture Revenue (USD Million) By Type (2023-2030)
Table 39 North America Institutional and Office Furniture Revenue (USD Million) By Applications (2023-2030)
Table 40 Europe Institutional and Office Furniture Revenue (USD Million) By Country (2023-2030)
Table 41 Europe Institutional and Office Furniture Revenue (USD Million) By Type (2023-2030)
Table 42 Europe Institutional and Office Furniture Revenue (USD Million) By Applications (2023-2030)
Table 43 Asia Pacific Institutional and Office Furniture Revenue (USD Million) By Country (2023-2030)
Table 44 Asia Pacific Institutional and Office Furniture Revenue (USD Million) By Type (2023-2030)
Table 45 Asia Pacific Institutional and Office Furniture Revenue (USD Million) By Applications (2023-2030)
Table 46 South America Institutional and Office Furniture Revenue (USD Million) By Country (2023-2030)
Table 47 South America Institutional and Office Furniture Revenue (USD Million) By Type (2023-2030)
Table 48 South America Institutional and Office Furniture Revenue (USD Million) By Applications (2023-2030)
Table 49 Middle East and Africa Institutional and Office Furniture Revenue (USD Million) By Region (2023-2030)
Table 50 Middle East and Africa Institutional and Office Furniture Revenue (USD Million) By Region (2023-2030)
Table 51 Middle East and Africa Institutional and Office Furniture Revenue (USD Million) By Type (2023-2030)
Table 52 Middle East and Africa Institutional and Office Furniture Revenue (USD Million) By Applications (2023-2030)
Table 53 Research Programs/Design for This Report
Table 54 Key Data Information from Secondary Sources
Table 55 Key Data Information from Primary Sources
List of Figures
Figure 1 Market Scope
Figure 2 Porter’s Five Forces
Figure 3 Global Institutional and Office Furniture Revenue (USD Million) By Type (2018-2022)
Figure 4 Global Institutional and Office Furniture Revenue Market Share (%) By Type (2022)
Figure 5 Global Institutional and Office Furniture Revenue (USD Million) By Applications (2018-2022)
Figure 6 Global Institutional and Office Furniture Revenue Market Share (%) By Applications (2022)
Figure 7 Global Institutional and Office Furniture Market Revenue (USD Million) By Regions (2018-2022)
Figure 8 Global Institutional and Office Furniture Market Share (%) By Regions (2022)
Figure 9 North America Institutional and Office Furniture Revenue (USD Million) By Country (2018-2022)
Figure 10 North America Institutional and Office Furniture Revenue (USD Million) By Type (2018-2022)
Figure 11 North America Institutional and Office Furniture Revenue (USD Million) By Applications (2018-2022)
Figure 12 Europe Institutional and Office Furniture Revenue (USD Million) By Country (2018-2022)
Figure 13 Europe Institutional and Office Furniture Revenue (USD Million) By Type (2018-2022)
Figure 14 Europe Institutional and Office Furniture Revenue (USD Million) By Applications (2018-2022)
Figure 15 Asia Pacific Institutional and Office Furniture Revenue (USD Million) By Country (2018-2022)
Figure 16 Asia Pacific Institutional and Office Furniture Revenue (USD Million) By Type (2018-2022)
Figure 17 Asia Pacific Institutional and Office Furniture Revenue (USD Million) By Applications (2018-2022)
Figure 18 South America Institutional and Office Furniture Revenue (USD Million) By Country (2018-2022)
Figure 19 South America Institutional and Office Furniture Revenue (USD Million) By Type (2018-2022)
Figure 20 South America Institutional and Office Furniture Revenue (USD Million) By Applications (2018-2022)
Figure 21 Middle East and Africa Institutional and Office Furniture Revenue (USD Million) By Region (2018-2022)
Figure 22 Middle East and Africa Institutional and Office Furniture Revenue (USD Million) By Type (2018-2022)
Figure 23 Middle East and Africa Institutional and Office Furniture Revenue (USD Million) By Applications (2018-2022)
Figure 24 Global Institutional and Office Furniture Revenue (USD Million) By Type (2023-2030)
Figure 25 Global Institutional and Office Furniture Revenue Market Share (%) By Type (2030)
Figure 26 Global Institutional and Office Furniture Revenue (USD Million) By Applications (2023-2030)
Figure 27 Global Institutional and Office Furniture Revenue Market Share (%) By Applications (2030)
Figure 28 Global Institutional and Office Furniture Market Revenue (USD Million) By Regions (2023-2030)
Figure 29 North America Institutional and Office Furniture Revenue (USD Million) By Country (2023-2030)
Figure 30 North America Institutional and Office Furniture Revenue (USD Million) By Type (2023-2030)
Figure 31 North America Institutional and Office Furniture Revenue (USD Million) By Applications (2023-2030)
Figure 32 Europe Institutional and Office Furniture Revenue (USD Million) By Country (2023-2030)
Figure 33 Europe Institutional and Office Furniture Revenue (USD Million) By Type (2023-2030)
Figure 34 Europe Institutional and Office Furniture Revenue (USD Million) By Applications (2023-2030)
Figure 35 Asia Pacific Institutional and Office Furniture Revenue (USD Million) By Country (2023-2030)
Figure 36 Asia Pacific Institutional and Office Furniture Revenue (USD Million) By Type (2023-2030)
Figure 37 Asia Pacific Institutional and Office Furniture Revenue (USD Million) By Applications (2023-2030)
Figure 38 South America Institutional and Office Furniture Revenue (USD Million) By Country (2023-2030)
Figure 39 South America Institutional and Office Furniture Revenue (USD Million) By Type (2023-2030)
Figure 40 South America Institutional and Office Furniture Revenue (USD Million) By Applications (2023-2030)
Figure 41 Middle East and Africa Institutional and Office Furniture Revenue (USD Million) By Region (2023-2030)
Figure 42 Middle East and Africa Institutional and Office Furniture Revenue (USD Million) By Region (2023-2030)
Figure 43 Middle East and Africa Institutional and Office Furniture Revenue (USD Million) By Type (2023-2030)
Figure 44 Middle East and Africa Institutional and Office Furniture Revenue (USD Million) By Applications (2023-2030)
Figure 45 Bottom-Up and Top-Down Approaches For This Report
Figure 46 Data Triangulation
