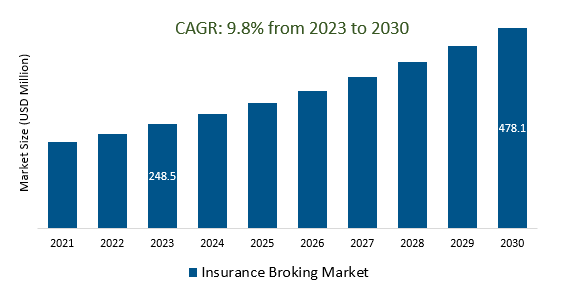
The Global Insurance Broking Market Size is estimated to be US 248.5 billion in 2023. It is poised to register 9.8% growth over the forecast period from 2023 to 2030 to reach US $ 478.1 billion in 2030.
The market growth is driven by an increase in the insurance industry is increasingly adopting digital technologies for customer acquisition, underwriting, claims processing, and overall customer experience. This trend is pushing insurance brokers to adapt and invest in digital tools and platforms. Leading Companies focusing on Digital Transformation, Data Analytics and Personalization, Cybersecurity and Data Privacy, Emerging Risks, Globalization and International Expansion, Sustainable Practices, Customer-Centric Approach, and others to boost market shares in the industry.
Market Overview
The insurance broking market serves as a vital intermediary between insurance buyers and providers, offering expertise in risk assessment, policy selection, negotiation, and claims assistance. With a competitive landscape, regulatory considerations, and a growing focus on technology and sustainability, brokers adapt to the evolving insurance landscape while maintaining a client-centric approach. This dynamic industry caters to both businesses and individuals, and its global reach allows brokers to navigate international markets and complex regulatory environments, offering tailored insurance solutions to meet the diverse needs of clients.
Market Dynamics
Market Trends- Sustainable and ESG insurance offers a number of benefits for both brokers and clients, including improved risk management, enhanced reputation, and access to new products and services
Sustainable and ESG (Environmental, Social, Governance) insurance is a burgeoning sector in the insurance broking market, offering improved risk management through policies that align with clients' values and reduce exposure to emerging environmental and social risks. Brokers embracing ESG insurance also enjoy a bolstered reputation as responsible service providers, attracting new clients and fostering loyalty. This trend enables brokers to diversify their product offerings, meeting the demand for innovative insurance solutions that address ethical and sustainable business practices, thereby benefiting both brokers and clients.
Market Driver- The demand for cyber insurance is increasing in the insurance broking market, driven by the growing risk of cyber-attacks and the increasing availability of cyber insurance products.
The insurance broking market is witnessing a surge in the demand for cyber insurance due to the growing risk of cyber-attacks and the availability of a wider range of cyber insurance products. With businesses and individuals facing increased cyber threats, insurance brokers play a critical role in educating clients, assessing their specific risks, and helping them select appropriate coverage. Regulatory requirements for data protection and the need for financial protection against cyber incidents further drive this demand. Brokers act as intermediaries, guiding clients through policy selection and claims processes, making them essential in safeguarding businesses and individuals in an increasingly digital world.
Market Opportunity- The introduction of alternative distribution channels is expanding the reach of insurance brokers and making it easier for customers to access insurance products
The adoption of alternative distribution channels in the insurance broking market is revolutionizing the industry, extending brokers' reach, and enhancing customer accessibility to insurance products. These digital platforms, including insurtech startups and online marketplaces, offer convenience and a diverse array of options for clients. Brokers are leveraging technology to provide personalized services, enabling clients to make informed insurance decisions. This shift not only improves the overall customer experience but also enables brokers to diversify their offerings and remain competitive in a rapidly evolving market, benefiting both clients and brokers alike.
Market Share Analysis- Composite Insurance Broking Market will register the fastest growth
The Global Insurance Broking Market is analyzed across Direct, Re-insurance, Composite, and others. Composite is poised to register the fastest growth. The composite insurance broking market is a segment of the insurance industry where brokers offer a comprehensive range of insurance products and services, including property, casualty, life, health, and specialty coverage. These brokers provide clients with an integrated, one-stop solution for their various insurance needs, simplifying the purchasing process and optimizing risk protection for both businesses and individuals.
Market Share Analysis- Organizations held a significant market share in 2023
The Global Insurance Broking Market is analyzed across various applications including Individuals, Organizations, and others. Of these, Organizations held a significant market share in 2023. In the insurance broking market, key organizations include insurance brokers who act as intermediaries between clients and insurers, regulatory authorities overseeing industry compliance, industry associations providing support to brokers, insurtech companies offering innovative technology solutions, reinsurers providing risk coverage to insurers, financial institutions often collaborating with brokers, and risk management firms aiding in risk assessment. These organizations collectively shape the market, facilitating the purchase of insurance policies and the management of risk for businesses and individuals.
Insurance Broking Market Segmentation
By Type
- Direct
- Re-insurance
- Composite
By Application
By Region
- North America (United States, Canada, Mexico)
- Europe (Germany, France, United Kingdom, Spain, Italy, Others)
- Asia Pacific (China, India, Japan, South Korea, Australia, Others)
- Latin America (Brazil, Argentina, Others)
- Middle East and Africa (Saudi Arabia, UAE, Kuwait, Other Middle East, South Africa, Nigeria, Other Africa)
Insurance Broking Market Companies
- HDFC
- Brown & Brown Insurance Inc
- Life Insurance Corporation
- ICICI Lombard
- Truist Insurance Holdings
- Aon plc
- Marsh & McLennan Companies Inc
- Aditya Birla Capital Ltd
- Acrisure LLC
*List not exhaustive
Insurance Broking Market Outlook 2023
1 Market Overview
1.1 Introduction to the Insurance Broking Market
1.2 Scope of the Study
1.3 Research Objective
1.3.1 Key Market Scope and Segments
1.3.2 Players Covered
1.3.3 Years Considered
2 Executive Summary
2.1 2023 Insurance Broking Industry- Market Statistics
3 Market Dynamics
3.1 Market Drivers
3.2 Market Challenges
3.3 Market Opportunities
3.4 Market Trends
4 Market Factor Analysis
4.1 Porter’s Five Forces
4.2 Market Entropy
4.2.1 Global Insurance Broking Market Companies with Area Served
4.2.2 Products Offerings Global Insurance Broking Market
5 COVID-19 Impact Analysis and Outlook Scenarios
5.1.1 Covid-19 Impact Analysis
5.1.2 post-COVID-19 Scenario- Low Growth Case
5.1.3 post-COVID-19 Scenario- Reference Growth Case
5.1.4 post-COVID-19 Scenario- Low Growth Case
6 Global Insurance Broking Market Trends
6.1 Global Insurance Broking Revenue (USD Million) and CAGR (%) by Type (2018-2030)
6.2 Global Insurance Broking Revenue (USD Million) and CAGR (%) by Applications (2018-2030)
6.3 Global Insurance Broking Revenue (USD Million) and CAGR (%) by regions (2018-2030)
7 Global Insurance Broking Market Revenue (USD Million) by Type, and Applications (2018-2022)
7.1 Global Insurance Broking Revenue (USD Million) by Type (2018-2022)
7.1.1 Global Insurance Broking Revenue (USD Million), Market Share (%) by Type (2018-2022)
7.2 Global Insurance Broking Revenue (USD Million) by Applications (2018-2022)
7.2.1 Global Insurance Broking Revenue (USD Million), Market Share (%) by Applications (2018-2022)
8 Global Insurance Broking Development Regional Status and Outlook
8.1 Global Insurance Broking Revenue (USD Million) By Regions (2018-2022)
8.2 North America Insurance Broking Revenue (USD Million) by Type, and Application (2018-2022)
8.2.1 North America Insurance Broking Revenue (USD Million) by Country (2018-2022)
8.2.2 North America Insurance Broking Revenue (USD Million) by Type (2018-2022)
8.2.3 North America Insurance Broking Revenue (USD Million) by Applications (2018-2022)
8.3 Europe Insurance Broking Revenue (USD Million), by Type, and Applications (USD Million) (2018-2022)
8.3.1 Europe Insurance Broking Revenue (USD Million), by Country (2018-2022)
8.3.2 Europe Insurance Broking Revenue (USD Million) by Type (2018-2022)
8.3.3 Europe Insurance Broking Revenue (USD Million) by Applications (2018-2022)
8.4 Asia Pacific Insurance Broking Revenue (USD Million), and Revenue (USD Million) by Type, and Applications (2018-2022)
8.4.1 Asia Pacific Insurance Broking Revenue (USD Million) by Country (2018-2022)
8.4.2 Asia Pacific Insurance Broking Revenue (USD Million) by Type (2018-2022)
8.4.3 Asia Pacific Insurance Broking Revenue (USD Million) by Applications (2018-2022)
8.5 South America Insurance Broking Revenue (USD Million), by Type, and Applications (2018-2022)
8.5.1 South America Insurance Broking Revenue (USD Million), by Country (2018-2022)
8.5.2 South America Insurance Broking Revenue (USD Million) by Type (2018-2022)
8.5.3 South America Insurance Broking Revenue (USD Million) by Applications (2018-2022)
8.6 Middle East and Africa Insurance Broking Revenue (USD Million), by Type, Technology, Application, Thickness (2018-2022)
8.6.1 Middle East and Africa Insurance Broking Revenue (USD Million) by Country (2018-2022)
8.6.2 Middle East and Africa Insurance Broking Revenue (USD Million) by Type (2018-2022)
8.6.3 Middle East and Africa Insurance Broking Revenue (USD Million) by Applications (2018-2022)
9 Company Profiles
10 Global Insurance Broking Market Revenue (USD Million), by Type, and Applications (2023-2030)
10.1 Global Insurance Broking Revenue (USD Million) and Market Share (%) by Type (2023-2030)
10.1.1 Global Insurance Broking Revenue (USD Million), and Market Share (%) by Type (2023-2030)
10.2 Global Insurance Broking Revenue (USD Million) and Market Share (%) by Applications (2023-2030)
10.2.1 Global Insurance Broking Revenue (USD Million), and Market Share (%) by Applications (2023-2030)
11 Global Insurance Broking Development Regional Status and Outlook Forecast
11.1 Global Insurance Broking Revenue (USD Million) By Regions (2023-2030)
11.2 North America Insurance Broking Revenue (USD Million) by Type, and Applications (2023-2030)
11.2.1 North America Insurance Broking Revenue (USD) Million by Country (2023-2030)
11.2.2 North America Insurance Broking Revenue (USD Million), by Type (2023-2030)
11.2.3 North America Insurance Broking Revenue (USD Million), Market Share (%) by Applications (2023-2030)
11.3 Europe Insurance Broking Revenue (USD Million), by Type, and Applications (2023-2030)
11.3.1 Europe Insurance Broking Revenue (USD Million), by Country (2023-2030)
11.3.2 Europe Insurance Broking Revenue (USD Million), by Type (2023-2030)
11.3.3 Europe Insurance Broking Revenue (USD Million), by Applications (2023-2030)
11.4 Asia Pacific Insurance Broking Revenue (USD Million) by Type, and Applications (2023-2030)
11.4.1 Asia Pacific Insurance Broking Revenue (USD Million), by Country (2023-2030)
11.4.2 Asia Pacific Insurance Broking Revenue (USD Million), by Type (2023-2030)
11.4.3 Asia Pacific Insurance Broking Revenue (USD Million), by Applications (2023-2030)
11.5 South America Insurance Broking Revenue (USD Million), by Type, and Applications (2023-2030)
11.5.1 South America Insurance Broking Revenue (USD Million), by Country (2023-2030)
11.5.2 South America Insurance Broking Revenue (USD Million), by Type (2023-2030)
11.5.3 South America Insurance Broking Revenue (USD Million), by Applications (2023-2030)
11.6 Middle East and Africa Insurance Broking Revenue (USD Million), by Type, and Applications (2023-2030)
11.6.1 Middle East and Africa Insurance Broking Revenue (USD Million), by region (2023-2030)
11.6.2 Middle East and Africa Insurance Broking Revenue (USD Million), by Type (2023-2030)
11.6.3 Middle East and Africa Insurance Broking Revenue (USD Million), by Applications (2023-2030)
12 Methodology and Data Sources
12.1 Methodology/Research Approach
12.1.1 Research Programs/Design
12.1.2 Market Size Estimation
12.1.3 Market Breakdown and Data Triangulation
12.2 Data Sources
12.2.1 Secondary Sources
12.2.2 Primary Sources
12.3 Disclaimer
List of Tables
Table 1 Market Segmentation Analysis
Table 2 Global Insurance Broking Market Companies with Areas Served
Table 3 Products Offerings Global Insurance Broking Market
Table 4 Low Growth Scenario Forecasts
Table 5 Reference Case Growth Scenario
Table 6 High Growth Case Scenario
Table 7 Global Insurance Broking Revenue (USD Million) And CAGR (%) By Type (2018-2030)
Table 8 Global Insurance Broking Revenue (USD Million) And CAGR (%) By Applications (2018-2030)
Table 9 Global Insurance Broking Revenue (USD Million) And CAGR (%) By Regions (2018-2030)
Table 10 Global Insurance Broking Revenue (USD Million) By Type (2018-2022)
Table 11 Global Insurance Broking Revenue Market Share (%) By Type (2018-2022)
Table 12 Global Insurance Broking Revenue (USD Million) By Applications (2018-2022)
Table 13 Global Insurance Broking Revenue Market Share (%) By Applications (2018-2022)
Table 14 Global Insurance Broking Market Revenue (USD Million) By Regions (2018-2022)
Table 15 Global Insurance Broking Market Share (%) By Regions (2018-2022)
Table 16 North America Insurance Broking Revenue (USD Million) By Country (2018-2022)
Table 17 North America Insurance Broking Revenue (USD Million) By Type (2018-2022)
Table 18 North America Insurance Broking Revenue (USD Million) By Applications (2018-2022)
Table 19 Europe Insurance Broking Revenue (USD Million) By Country (2018-2022)
Table 20 Europe Insurance Broking Revenue (USD Million) By Type (2018-2022)
Table 21 Europe Insurance Broking Revenue (USD Million) By Applications (2018-2022)
Table 22 Asia Pacific Insurance Broking Revenue (USD Million) By Country (2018-2022)
Table 23 Asia Pacific Insurance Broking Revenue (USD Million) By Type (2018-2022)
Table 24 Asia Pacific Insurance Broking Revenue (USD Million) By Applications (2018-2022)
Table 25 South America Insurance Broking Revenue (USD Million) By Country (2018-2022)
Table 26 South America Insurance Broking Revenue (USD Million) By Type (2018-2022)
Table 27 South America Insurance Broking Revenue (USD Million) By Applications (2018-2022)
Table 28 Middle East and Africa Insurance Broking Revenue (USD Million) By Region (2018-2022)
Table 29 Middle East and Africa Insurance Broking Revenue (USD Million) By Type (2018-2022)
Table 30 Middle East and Africa Insurance Broking Revenue (USD Million) By Applications (2018-2022)
Table 31 Financial Analysis
Table 32 Global Insurance Broking Revenue (USD Million) By Type (2023-2030)
Table 33 Global Insurance Broking Revenue Market Share (%) By Type (2023-2030)
Table 34 Global Insurance Broking Revenue (USD Million) By Applications (2023-2030)
Table 35 Global Insurance Broking Revenue Market Share (%) By Applications (2023-2030)
Table 36 Global Insurance Broking Market Revenue (USD Million), And Revenue (USD Million) By Regions (2023-2030)
Table 37 North America Insurance Broking Revenue (USD)By Country (2023-2030)
Table 38 North America Insurance Broking Revenue (USD Million) By Type (2023-2030)
Table 39 North America Insurance Broking Revenue (USD Million) By Applications (2023-2030)
Table 40 Europe Insurance Broking Revenue (USD Million) By Country (2023-2030)
Table 41 Europe Insurance Broking Revenue (USD Million) By Type (2023-2030)
Table 42 Europe Insurance Broking Revenue (USD Million) By Applications (2023-2030)
Table 43 Asia Pacific Insurance Broking Revenue (USD Million) By Country (2023-2030)
Table 44 Asia Pacific Insurance Broking Revenue (USD Million) By Type (2023-2030)
Table 45 Asia Pacific Insurance Broking Revenue (USD Million) By Applications (2023-2030)
Table 46 South America Insurance Broking Revenue (USD Million) By Country (2023-2030)
Table 47 South America Insurance Broking Revenue (USD Million) By Type (2023-2030)
Table 48 South America Insurance Broking Revenue (USD Million) By Applications (2023-2030)
Table 49 Middle East and Africa Insurance Broking Revenue (USD Million) By Region (2023-2030)
Table 50 Middle East and Africa Insurance Broking Revenue (USD Million) By Region (2023-2030)
Table 51 Middle East and Africa Insurance Broking Revenue (USD Million) By Type (2023-2030)
Table 52 Middle East and Africa Insurance Broking Revenue (USD Million) By Applications (2023-2030)
Table 53 Research Programs/Design for This Report
Table 54 Key Data Information from Secondary Sources
Table 55 Key Data Information from Primary Sources
List of Figures
Figure 1 Market Scope
Figure 2 Porter’s Five Forces
Figure 3 Global Insurance Broking Revenue (USD Million) By Type (2018-2022)
Figure 4 Global Insurance Broking Revenue Market Share (%) By Type (2022)
Figure 5 Global Insurance Broking Revenue (USD Million) By Applications (2018-2022)
Figure 6 Global Insurance Broking Revenue Market Share (%) By Applications (2022)
Figure 7 Global Insurance Broking Market Revenue (USD Million) By Regions (2018-2022)
Figure 8 Global Insurance Broking Market Share (%) By Regions (2022)
Figure 9 North America Insurance Broking Revenue (USD Million) By Country (2018-2022)
Figure 10 North America Insurance Broking Revenue (USD Million) By Type (2018-2022)
Figure 11 North America Insurance Broking Revenue (USD Million) By Applications (2018-2022)
Figure 12 Europe Insurance Broking Revenue (USD Million) By Country (2018-2022)
Figure 13 Europe Insurance Broking Revenue (USD Million) By Type (2018-2022)
Figure 14 Europe Insurance Broking Revenue (USD Million) By Applications (2018-2022)
Figure 15 Asia Pacific Insurance Broking Revenue (USD Million) By Country (2018-2022)
Figure 16 Asia Pacific Insurance Broking Revenue (USD Million) By Type (2018-2022)
Figure 17 Asia Pacific Insurance Broking Revenue (USD Million) By Applications (2018-2022)
Figure 18 South America Insurance Broking Revenue (USD Million) By Country (2018-2022)
Figure 19 South America Insurance Broking Revenue (USD Million) By Type (2018-2022)
Figure 20 South America Insurance Broking Revenue (USD Million) By Applications (2018-2022)
Figure 21 Middle East and Africa Insurance Broking Revenue (USD Million) By Region (2018-2022)
Figure 22 Middle East and Africa Insurance Broking Revenue (USD Million) By Type (2018-2022)
Figure 23 Middle East and Africa Insurance Broking Revenue (USD Million) By Applications (2018-2022)
Figure 24 Global Insurance Broking Revenue (USD Million) By Type (2023-2030)
Figure 25 Global Insurance Broking Revenue Market Share (%) By Type (2030)
Figure 26 Global Insurance Broking Revenue (USD Million) By Applications (2023-2030)
Figure 27 Global Insurance Broking Revenue Market Share (%) By Applications (2030)
Figure 28 Global Insurance Broking Market Revenue (USD Million) By Regions (2023-2030)
Figure 29 North America Insurance Broking Revenue (USD Million) By Country (2023-2030)
Figure 30 North America Insurance Broking Revenue (USD Million) By Type (2023-2030)
Figure 31 North America Insurance Broking Revenue (USD Million) By Applications (2023-2030)
Figure 32 Europe Insurance Broking Revenue (USD Million) By Country (2023-2030)
Figure 33 Europe Insurance Broking Revenue (USD Million) By Type (2023-2030)
Figure 34 Europe Insurance Broking Revenue (USD Million) By Applications (2023-2030)
Figure 35 Asia Pacific Insurance Broking Revenue (USD Million) By Country (2023-2030)
Figure 36 Asia Pacific Insurance Broking Revenue (USD Million) By Type (2023-2030)
Figure 37 Asia Pacific Insurance Broking Revenue (USD Million) By Applications (2023-2030)
Figure 38 South America Insurance Broking Revenue (USD Million) By Country (2023-2030)
Figure 39 South America Insurance Broking Revenue (USD Million) By Type (2023-2030)
Figure 40 South America Insurance Broking Revenue (USD Million) By Applications (2023-2030)
Figure 41 Middle East and Africa Insurance Broking Revenue (USD Million) By Region (2023-2030)
Figure 42 Middle East and Africa Insurance Broking Revenue (USD Million) By Region (2023-2030)
Figure 43 Middle East and Africa Insurance Broking Revenue (USD Million) By Type (2023-2030)
Figure 44 Middle East and Africa Insurance Broking Revenue (USD Million) By Applications (2023-2030)
Figure 45 Bottom-Up and Top-Down Approaches for This Report
Figure 46 Data Triangulation
