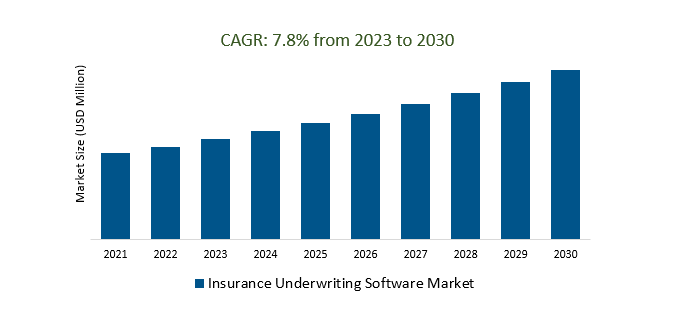
The Global Insurance Underwriting Software Market Size is estimated to register 7.8% growth over the forecast period from 2023 to 2030.
The market growth is driven by an increasing international expansion of insurance companies is driving the need for underwriting software capable of handling diverse markets and regulations. Leading Companies focusing on Increased Adoption of AI and Data Analytics, Enhanced Customer Experience, Blockchain for Data Security, Personalized Pricing, Cyber Risk Assessment, Integration with Claims Processing, Mobile Underwriting, and others to boost market shares in the industry.
Market Overview
The Insurance Underwriting Software market comprises software solutions aimed at enhancing the efficiency and accuracy of the insurance underwriting process. Key players in this global market include traditional insurance software providers and insurtech startups, offering features such as risk assessment, predictive modeling, and automation. Market trends include the adoption of AI and data analytics, while drivers include the need for cost reduction, regulatory compliance, and improved risk assessment. The future outlook is positive, with continued growth and innovation expected as technology evolves, customer expectations change, and data analytics play a pivotal role in the industry's transformation.
Market Dynamics
Market Trends- Predictive underwriting is poised to revolutionize the insurance underwriting software market, as insurers increasingly adopt this technology to improve their risk assessment, reduce fraud, and increase efficiency.
Predictive underwriting technology is poised to revolutionize the insurance underwriting software market, enabling insurers to make more data-informed decisions, improve risk assessment accuracy, streamline processes, and reduce fraudulent claims. This shift represents a fundamental change in the insurance industry's approach and has the potential to reshape how insurers assess and manage risks in the future.
Market Driver- Insurtech startups are driving demand for insurance underwriting software, as they increasingly look to adopt this technology to streamline their operations and improve their underwriting performance.
The insurance underwriting software market is experiencing heightened demand driven by insurtech startups at the vanguard of a digital revolution in the insurance sector. These innovative companies are using advanced underwriting software to revamp their operations and enhance underwriting performance. They are enticed by the potential for streamlined processes, increased efficiency, and superior risk assessment provided by cutting-edge underwriting technology. This surge in demand underscores the central role of underwriting software as a driver of industry transformation, adapting to the evolving needs and expectations of insurers and policyholders. As insurtech startups continue to disrupt traditional practices and champion technological innovation, the insurance underwriting software market emerges as a key driver of industry progress, promising a more agile, data-driven, and customer-centric future for the insurance sector.
Market Opportunity- Natural disasters and catastrophe modeling are increasingly important considerations for insurance underwriting software providers, as they develop solutions to help insurers manage and mitigate risk.
The insurance underwriting software market is increasingly prioritizing natural disaster and catastrophe modeling. This reflects the industry's acknowledgment of the growing importance of these factors. Insurance software providers are actively developing solutions to help insurers understand, manage, and mitigate risks related to natural disasters. These solutions use advanced modeling to assess potential catastrophic impacts, providing valuable insights for more accurate risk assessment and pricing. As natural disasters become more frequent and severe, this emphasis on catastrophe modeling demonstrates the industry's dedication to addressing evolving risks and strengthening its resilience.
Market Share Analysis- Cloud-based Insurance Underwriting Software Market will register the fastest growth
The Global Insurance Underwriting Software Market is analyzed across On-premises, Cloud-based, and others. Cloud-based is poised to register the fastest growth. The Cloud-based Insurance Underwriting Software Market delivers underwriting solutions through cloud computing platforms, offering insurers remote access to streamline underwriting processes. Key players in this global market include established software providers and insurtech startups, providing features like real-time data access, collaboration tools, scalability, and data security. Current trends encompass the adoption of cloud-based solutions for remote work, data analytics integration, and heightened data security focus, while the drivers include cost-efficiency and scalability. Challenges involve data privacy and cybersecurity, and the market's future looks promising, driven by insurers seeking agility, remote capabilities, and enhanced underwriting processes in an evolving digital landscape.
Market Share Analysis- Property and Casualty Insurance held a significant market share in 2023
The Global Insurance Underwriting Software Market is analyzed across various applications including Life Insurance, Accident and Health Insurance, Property and Casualty Insurance, and others. Of these, Property and Casualty Insurance held a significant market share in 2023. The Property and Casualty Insurance Underwriting Software Market provides tailored software solutions for underwriting processes specific to property and casualty insurance lines, including personal and commercial policies related to property damage and liability. Key players include established software providers and specialized insurtech companies, offering features such as risk assessment, data analytics, claims data integration, and compliance support. Market trends encompass the integration of telematics and IoT for usage-based insurance, enhanced data analytics for risk assessment, and claims processing integration. Drivers include the need for precise risk assessment, compliance, and cost-efficiency.
Insurance Underwriting Software Market Segmentation
By Type
By Applications
- Life Insurance
- Accident and Health Insurance
- Property and Casualty Insurance
- Others
By Region
- North America (United States, Canada, Mexico)
- Europe (Germany, France, United Kingdom, Spain, Italy, Others)
- Asia Pacific (China, India, Japan, South Korea, Australia, Others)
- Latin America (Brazil, Argentina, Others)
- Middle East and Africa (Saudi Arabia, UAE, Kuwait, Other Middle East, South Africa, Nigeria, Other Africa)
Insurance Underwriting Software Market Companies
- Newgen
- CGI
- Pyramid Solutions
- Pega
- AdvantageGo
- FINEOS
*List not exhaustive
Insurance Underwriting Software Market Outlook 2023
1 Market Overview
1.1 Introduction to the Insurance Underwriting Software Market
1.2 Scope of the Study
1.3 Research Objective
1.3.1 Key Market Scope and Segments
1.3.2 Players Covered
1.3.3 Years Considered
2 Executive Summary
2.1 2023 Insurance Underwriting Software Industry- Market Statistics
3 Market Dynamics
3.1 Market Drivers
3.2 Market Challenges
3.3 Market Opportunities
3.4 Market Trends
4 Market Factor Analysis
4.1 Porter’s Five Forces
4.2 Market Entropy
4.2.1 Global Insurance Underwriting Software Market Companies with Area Served
4.2.2 Products Offerings Global Insurance Underwriting Software Market
5 COVID-19 Impact Analysis and Outlook Scenarios
5.1.1 Covid-19 Impact Analysis
5.1.2 post-COVID-19 Scenario- Low Growth Case
5.1.3 post-COVID-19 Scenario- Reference Growth Case
5.1.4 post-COVID-19 Scenario- Low Growth Case
6 Global Insurance Underwriting Software Market Trends
6.1 Global Insurance Underwriting Software Revenue (USD Million) and CAGR (%) by Type (2018-2030)
6.2 Global Insurance Underwriting Software Revenue (USD Million) and CAGR (%) by Applications (2018-2030)
6.3 Global Insurance Underwriting Software Revenue (USD Million) and CAGR (%) by regions (2018-2030)
7 Global Insurance Underwriting Software Market Revenue (USD Million) by Type, and Applications (2018-2022)
7.1 Global Insurance Underwriting Software Revenue (USD Million) by Type (2018-2022)
7.1.1 Global Insurance Underwriting Software Revenue (USD Million), Market Share (%) by Type (2018-2022)
7.2 Global Insurance Underwriting Software Revenue (USD Million) by Applications (2018-2022)
7.2.1 Global Insurance Underwriting Software Revenue (USD Million), Market Share (%) by Applications (2018-2022)
8 Global Insurance Underwriting Software Development Regional Status and Outlook
8.1 Global Insurance Underwriting Software Revenue (USD Million) By Regions (2018-2022)
8.2 North America Insurance Underwriting Software Revenue (USD Million) by Type, and Application (2018-2022)
8.2.1 North America Insurance Underwriting Software Revenue (USD Million) by Country (2018-2022)
8.2.2 North America Insurance Underwriting Software Revenue (USD Million) by Type (2018-2022)
8.2.3 North America Insurance Underwriting Software Revenue (USD Million) by Applications (2018-2022)
8.3 Europe Insurance Underwriting Software Revenue (USD Million), by Type, and Applications (USD Million) (2018-2022)
8.3.1 Europe Insurance Underwriting Software Revenue (USD Million), by Country (2018-2022)
8.3.2 Europe Insurance Underwriting Software Revenue (USD Million) by Type (2018-2022)
8.3.3 Europe Insurance Underwriting Software Revenue (USD Million) by Applications (2018-2022)
8.4 Asia Pacific Insurance Underwriting Software Revenue (USD Million), and Revenue (USD Million) by Type, and Applications (2018-2022)
8.4.1 Asia Pacific Insurance Underwriting Software Revenue (USD Million) by Country (2018-2022)
8.4.2 Asia Pacific Insurance Underwriting Software Revenue (USD Million) by Type (2018-2022)
8.4.3 Asia Pacific Insurance Underwriting Software Revenue (USD Million) by Applications (2018-2022)
8.5 South America Insurance Underwriting Software Revenue (USD Million), by Type, and Applications (2018-2022)
8.5.1 South America Insurance Underwriting Software Revenue (USD Million), by Country (2018-2022)
8.5.2 South America Insurance Underwriting Software Revenue (USD Million) by Type (2018-2022)
8.5.3 South America Insurance Underwriting Software Revenue (USD Million) by Applications (2018-2022)
8.6 Middle East and Africa Insurance Underwriting Software Revenue (USD Million), by Type, Technology, Application, Thickness (2018-2022)
8.6.1 Middle East and Africa Insurance Underwriting Software Revenue (USD Million) by Country (2018-2022)
8.6.2 Middle East and Africa Insurance Underwriting Software Revenue (USD Million) by Type (2018-2022)
8.6.3 Middle East and Africa Insurance Underwriting Software Revenue (USD Million) by Applications (2018-2022)
9 Company Profiles
10 Global Insurance Underwriting Software Market Revenue (USD Million), by Type, and Applications (2023-2030)
10.1 Global Insurance Underwriting Software Revenue (USD Million) and Market Share (%) by Type (2023-2030)
10.1.1 Global Insurance Underwriting Software Revenue (USD Million), and Market Share (%) by Type (2023-2030)
10.2 Global Insurance Underwriting Software Revenue (USD Million) and Market Share (%) by Applications (2023-2030)
10.2.1 Global Insurance Underwriting Software Revenue (USD Million), and Market Share (%) by Applications (2023-2030)
11 Global Insurance Underwriting Software Development Regional Status and Outlook Forecast
11.1 Global Insurance Underwriting Software Revenue (USD Million) By Regions (2023-2030)
11.2 North America Insurance Underwriting Software Revenue (USD Million) by Type, and Applications (2023-2030)
11.2.1 North America Insurance Underwriting Software Revenue (USD) Million by Country (2023-2030)
11.2.2 North America Insurance Underwriting Software Revenue (USD Million), by Type (2023-2030)
11.2.3 North America Insurance Underwriting Software Revenue (USD Million), Market Share (%) by Applications (2023-2030)
11.3 Europe Insurance Underwriting Software Revenue (USD Million), by Type, and Applications (2023-2030)
11.3.1 Europe Insurance Underwriting Software Revenue (USD Million), by Country (2023-2030)
11.3.2 Europe Insurance Underwriting Software Revenue (USD Million), by Type (2023-2030)
11.3.3 Europe Insurance Underwriting Software Revenue (USD Million), by Applications (2023-2030)
11.4 Asia Pacific Insurance Underwriting Software Revenue (USD Million) by Type, and Applications (2023-2030)
11.4.1 Asia Pacific Insurance Underwriting Software Revenue (USD Million), by Country (2023-2030)
11.4.2 Asia Pacific Insurance Underwriting Software Revenue (USD Million), by Type (2023-2030)
11.4.3 Asia Pacific Insurance Underwriting Software Revenue (USD Million), by Applications (2023-2030)
11.5 South America Insurance Underwriting Software Revenue (USD Million), by Type, and Applications (2023-2030)
11.5.1 South America Insurance Underwriting Software Revenue (USD Million), by Country (2023-2030)
11.5.2 South America Insurance Underwriting Software Revenue (USD Million), by Type (2023-2030)
11.5.3 South America Insurance Underwriting Software Revenue (USD Million), by Applications (2023-2030)
11.6 Middle East and Africa Insurance Underwriting Software Revenue (USD Million), by Type, and Applications (2023-2030)
11.6.1 Middle East and Africa Insurance Underwriting Software Revenue (USD Million), by region (2023-2030)
11.6.2 Middle East and Africa Insurance Underwriting Software Revenue (USD Million), by Type (2023-2030)
11.6.3 Middle East and Africa Insurance Underwriting Software Revenue (USD Million), by Applications (2023-2030)
12 Methodology and Data Sources
12.1 Methodology/Research Approach
12.1.1 Research Programs/Design
12.1.2 Market Size Estimation
12.1.3 Market Breakdown and Data Triangulation
12.2 Data Sources
12.2.1 Secondary Sources
12.2.2 Primary Sources
12.3 Disclaimer
List of Tables
Table 1 Market Segmentation Analysis
Table 2 Global Insurance Underwriting Software Market Companies with Areas Served
Table 3 Products Offerings Global Insurance Underwriting Software Market
Table 4 Low Growth Scenario Forecasts
Table 5 Reference Case Growth Scenario
Table 6 High Growth Case Scenario
Table 7 Global Insurance Underwriting Software Revenue (USD Million) And CAGR (%) By Type (2018-2030)
Table 8 Global Insurance Underwriting Software Revenue (USD Million) And CAGR (%) By Applications (2018-2030)
Table 9 Global Insurance Underwriting Software Revenue (USD Million) And CAGR (%) By Regions (2018-2030)
Table 10 Global Insurance Underwriting Software Revenue (USD Million) By Type (2018-2022)
Table 11 Global Insurance Underwriting Software Revenue Market Share (%) By Type (2018-2022)
Table 12 Global Insurance Underwriting Software Revenue (USD Million) By Applications (2018-2022)
Table 13 Global Insurance Underwriting Software Revenue Market Share (%) By Applications (2018-2022)
Table 14 Global Insurance Underwriting Software Market Revenue (USD Million) By Regions (2018-2022)
Table 15 Global Insurance Underwriting Software Market Share (%) By Regions (2018-2022)
Table 16 North America Insurance Underwriting Software Revenue (USD Million) By Country (2018-2022)
Table 17 North America Insurance Underwriting Software Revenue (USD Million) By Type (2018-2022)
Table 18 North America Insurance Underwriting Software Revenue (USD Million) By Applications (2018-2022)
Table 19 Europe Insurance Underwriting Software Revenue (USD Million) By Country (2018-2022)
Table 20 Europe Insurance Underwriting Software Revenue (USD Million) By Type (2018-2022)
Table 21 Europe Insurance Underwriting Software Revenue (USD Million) By Applications (2018-2022)
Table 22 Asia Pacific Insurance Underwriting Software Revenue (USD Million) By Country (2018-2022)
Table 23 Asia Pacific Insurance Underwriting Software Revenue (USD Million) By Type (2018-2022)
Table 24 Asia Pacific Insurance Underwriting Software Revenue (USD Million) By Applications (2018-2022)
Table 25 South America Insurance Underwriting Software Revenue (USD Million) By Country (2018-2022)
Table 26 South America Insurance Underwriting Software Revenue (USD Million) By Type (2018-2022)
Table 27 South America Insurance Underwriting Software Revenue (USD Million) By Applications (2018-2022)
Table 28 Middle East and Africa Insurance Underwriting Software Revenue (USD Million) By Region (2018-2022)
Table 29 Middle East and Africa Insurance Underwriting Software Revenue (USD Million) By Type (2018-2022)
Table 30 Middle East and Africa Insurance Underwriting Software Revenue (USD Million) By Applications (2018-2022)
Table 31 Financial Analysis
Table 32 Global Insurance Underwriting Software Revenue (USD Million) By Type (2023-2030)
Table 33 Global Insurance Underwriting Software Revenue Market Share (%) By Type (2023-2030)
Table 34 Global Insurance Underwriting Software Revenue (USD Million) By Applications (2023-2030)
Table 35 Global Insurance Underwriting Software Revenue Market Share (%) By Applications (2023-2030)
Table 36 Global Insurance Underwriting Software Market Revenue (USD Million), And Revenue (USD Million) By Regions (2023-2030)
Table 37 North America Insurance Underwriting Software Revenue (USD)By Country (2023-2030)
Table 38 North America Insurance Underwriting Software Revenue (USD Million) By Type (2023-2030)
Table 39 North America Insurance Underwriting Software Revenue (USD Million) By Applications (2023-2030)
Table 40 Europe Insurance Underwriting Software Revenue (USD Million) By Country (2023-2030)
Table 41 Europe Insurance Underwriting Software Revenue (USD Million) By Type (2023-2030)
Table 42 Europe Insurance Underwriting Software Revenue (USD Million) By Applications (2023-2030)
Table 43 Asia Pacific Insurance Underwriting Software Revenue (USD Million) By Country (2023-2030)
Table 44 Asia Pacific Insurance Underwriting Software Revenue (USD Million) By Type (2023-2030)
Table 45 Asia Pacific Insurance Underwriting Software Revenue (USD Million) By Applications (2023-2030)
Table 46 South America Insurance Underwriting Software Revenue (USD Million) By Country (2023-2030)
Table 47 South America Insurance Underwriting Software Revenue (USD Million) By Type (2023-2030)
Table 48 South America Insurance Underwriting Software Revenue (USD Million) By Applications (2023-2030)
Table 49 Middle East and Africa Insurance Underwriting Software Revenue (USD Million) By Region (2023-2030)
Table 50 Middle East and Africa Insurance Underwriting Software Revenue (USD Million) By Region (2023-2030)
Table 51 Middle East and Africa Insurance Underwriting Software Revenue (USD Million) By Type (2023-2030)
Table 52 Middle East and Africa Insurance Underwriting Software Revenue (USD Million) By Applications (2023-2030)
Table 53 Research Programs/Design for This Report
Table 54 Key Data Information from Secondary Sources
Table 55 Key Data Information from Primary Sources
List of Figures
Figure 1 Market Scope
Figure 2 Porter’s Five Forces
Figure 3 Global Insurance Underwriting Software Revenue (USD Million) By Type (2018-2022)
Figure 4 Global Insurance Underwriting Software Revenue Market Share (%) By Type (2022)
Figure 5 Global Insurance Underwriting Software Revenue (USD Million) By Applications (2018-2022)
Figure 6 Global Insurance Underwriting Software Revenue Market Share (%) By Applications (2022)
Figure 7 Global Insurance Underwriting Software Market Revenue (USD Million) By Regions (2018-2022)
Figure 8 Global Insurance Underwriting Software Market Share (%) By Regions (2022)
Figure 9 North America Insurance Underwriting Software Revenue (USD Million) By Country (2018-2022)
Figure 10 North America Insurance Underwriting Software Revenue (USD Million) By Type (2018-2022)
Figure 11 North America Insurance Underwriting Software Revenue (USD Million) By Applications (2018-2022)
Figure 12 Europe Insurance Underwriting Software Revenue (USD Million) By Country (2018-2022)
Figure 13 Europe Insurance Underwriting Software Revenue (USD Million) By Type (2018-2022)
Figure 14 Europe Insurance Underwriting Software Revenue (USD Million) By Applications (2018-2022)
Figure 15 Asia Pacific Insurance Underwriting Software Revenue (USD Million) By Country (2018-2022)
Figure 16 Asia Pacific Insurance Underwriting Software Revenue (USD Million) By Type (2018-2022)
Figure 17 Asia Pacific Insurance Underwriting Software Revenue (USD Million) By Applications (2018-2022)
Figure 18 South America Insurance Underwriting Software Revenue (USD Million) By Country (2018-2022)
Figure 19 South America Insurance Underwriting Software Revenue (USD Million) By Type (2018-2022)
Figure 20 South America Insurance Underwriting Software Revenue (USD Million) By Applications (2018-2022)
Figure 21 Middle East and Africa Insurance Underwriting Software Revenue (USD Million) By Region (2018-2022)
Figure 22 Middle East and Africa Insurance Underwriting Software Revenue (USD Million) By Type (2018-2022)
Figure 23 Middle East and Africa Insurance Underwriting Software Revenue (USD Million) By Applications (2018-2022)
Figure 24 Global Insurance Underwriting Software Revenue (USD Million) By Type (2023-2030)
Figure 25 Global Insurance Underwriting Software Revenue Market Share (%) By Type (2030)
Figure 26 Global Insurance Underwriting Software Revenue (USD Million) By Applications (2023-2030)
Figure 27 Global Insurance Underwriting Software Revenue Market Share (%) By Applications (2030)
Figure 28 Global Insurance Underwriting Software Market Revenue (USD Million) By Regions (2023-2030)
Figure 29 North America Insurance Underwriting Software Revenue (USD Million) By Country (2023-2030)
Figure 30 North America Insurance Underwriting Software Revenue (USD Million) By Type (2023-2030)
Figure 31 North America Insurance Underwriting Software Revenue (USD Million) By Applications (2023-2030)
Figure 32 Europe Insurance Underwriting Software Revenue (USD Million) By Country (2023-2030)
Figure 33 Europe Insurance Underwriting Software Revenue (USD Million) By Type (2023-2030)
Figure 34 Europe Insurance Underwriting Software Revenue (USD Million) By Applications (2023-2030)
Figure 35 Asia Pacific Insurance Underwriting Software Revenue (USD Million) By Country (2023-2030)
Figure 36 Asia Pacific Insurance Underwriting Software Revenue (USD Million) By Type (2023-2030)
Figure 37 Asia Pacific Insurance Underwriting Software Revenue (USD Million) By Applications (2023-2030)
Figure 38 South America Insurance Underwriting Software Revenue (USD Million) By Country (2023-2030)
Figure 39 South America Insurance Underwriting Software Revenue (USD Million) By Type (2023-2030)
Figure 40 South America Insurance Underwriting Software Revenue (USD Million) By Applications (2023-2030)
Figure 41 Middle East and Africa Insurance Underwriting Software Revenue (USD Million) By Region (2023-2030)
Figure 42 Middle East and Africa Insurance Underwriting Software Revenue (USD Million) By Region (2023-2030)
Figure 43 Middle East and Africa Insurance Underwriting Software Revenue (USD Million) By Type (2023-2030)
Figure 44 Middle East and Africa Insurance Underwriting Software Revenue (USD Million) By Applications (2023-2030)
Figure 45 Bottom-Up and Top-Down Approaches for This Report
Figure 46 Data Triangulation
