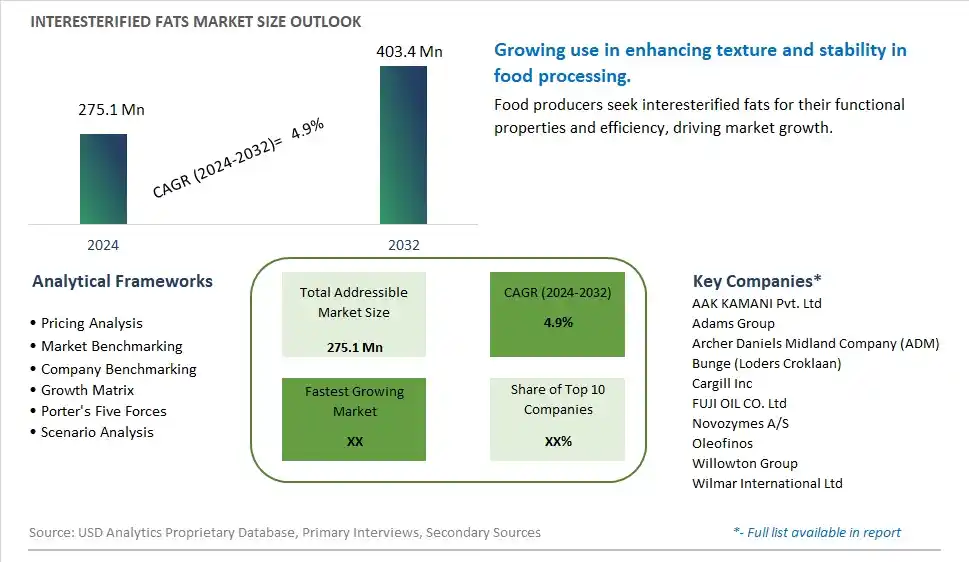
Global Interesterified Fats Market Size is valued at $275.1 Million in 2024 and is forecast to register a growth rate (CAGR) of 4.9% to reach $403.4 Million by 2032.
The global Interesterified Fats Market Comprehensive Study analyzes and forecasts the market size across 6 regions and 24 countries for diverse segments -By Interesterification Process (Chemical, Enzymatic), By Source (Soybean Oil, Palm Oil, Groundnut Oil, Coconut Oil, Rapeseed Oil, Sunflower Oil, Cottonseed Oil, Others), By End-User (Food Processing, Food Service, Pharmaceuticals, Cosmetics & Personal Care, Bakery & Confectionery, Others)
An Introduction to Interesterified Fats Market
In 2024, the interesterified fats market is growing, driven by the demand for healthier alternatives to traditional trans fats in food processing. Interesterified fats, which are chemically modified to alter their melting properties, offer improved stability and functionality in baked goods, margarine, and confectionery products. The market is witnessing innovations in fat modification techniques that enhance the nutritional profile of these fats. The trend towards clean label and natural ingredients is also influencing product development. Regulatory support and increasing consumer awareness of the health benefits of interesterified fats are further propelling market growth.
Interesterified Fats Competitive Landscape
The market report analyses the leading companies in the industry including AAK KAMANI Pvt. Ltd, Adams Group, Archer Daniels Midland Company (ADM), Bunge (Loders Croklaan), Cargill Inc, FUJI OIL CO. Ltd, Novozymes A/S, Oleofinos, Willowton Group, Wilmar International Ltd, and Others.
Interesterified Fats Market Dynamics
Interesterified Fats Market Trend: Shift Towards Healthier Fat Alternatives
The most prominent trend in the Interesterified Fats Market is the shift towards healthier fat alternatives. Interesterified fats, which can be modified to improve their functionality and health profile, are becoming increasingly popular as consumers seek healthier options to replace trans fats and partially hydrogenated oils. This trend is driven by the growing awareness of the negative health impacts of trans fats and the demand for healthier food ingredients.
Interesterified Fats Market Driver: Regulatory Changes and Health Guidelines
A key driver in the Interesterified Fats Market is regulatory changes and health guidelines aimed at reducing trans fat consumption. Many countries have implemented regulations that limit or ban the use of trans fats in food products, prompting manufacturers to seek alternative fat sources. Interesterified fats offer a viable solution, providing the desired functional properties without the adverse health effects, thus supporting market growth.
Interesterified Fats Market Opportunity: Expansion into New Food Applications
One significant opportunity in the Interesterified Fats Market lies in the expansion into new food applications. Interesterified fats can be used in a variety of products, including baked goods, confectionery, and processed foods, to improve texture, stability, and shelf life. Companies that explore innovative applications for interesterified fats can capitalize on this opportunity and drive market growth by offering healthier and versatile fat alternatives to the food industry.
Interesterified Fats Market Share Analysis: Low-Density Polyethylene (LDPE) segment generated the highest revenue share in the industry
Low-Density Polyethylene (LDPE) is the largest segment in the Grip Seal Bags market. LDPE is favored due to its flexibility, transparency, and excellent chemical resistance. These properties make LDPE bags highly suitable for various applications, including food packaging, pharmaceuticals, and retail products. The growing demand for convenient and secure packaging solutions in these industries is driving the rapid growth of the LDPE segment. Additionally, LDPE grip seal bags are lightweight, cost-effective, and provide a good moisture barrier, further enhancing their appeal. The increasing emphasis on sustainability is also propelling the demand for LDPE bags, as they can be recycled more efficiently compared to other types of plastic. Overall, the versatility and practical benefits of LDPE are key factors contributing to its dominance and fast growth in the grip seal bags market.
Interesterified Fats Market Segmentation
By Interesterification Process
Chemical
Enzymatic
By Source
Soybean Oil
Palm Oil
Groundnut Oil
Coconut Oil
Rapeseed Oil
Sunflower Oil
Cottonseed Oil
Others
By End-User
Food Processing
Food Service
Pharmaceuticals
Cosmetics & Personal Care
Bakery & Confectionery
Others
Countries Analyzed
North America (US, Canada, Mexico)
Europe (Germany, UK, France, Spain, Italy, Russia, Rest of Europe)
Asia Pacific (China, India, Japan, South Korea, Australia, South East Asia, Rest of Asia)
South America (Brazil, Argentina, Rest of South America)
Middle East and Africa (Saudi Arabia, UAE, Rest of Middle East, South Africa, Egypt, Rest of Africa)
Interesterified Fats Companies Profiled in the Study
AAK KAMANI Pvt. Ltd
Adams Group
Archer Daniels Midland Company (ADM)
Bunge (Loders Croklaan)
Cargill Inc
FUJI OIL CO. Ltd
Novozymes A/S
Oleofinos
Willowton Group
Wilmar International Ltd
*- List Not Exhaustive
Chapter 1. TABLE OF CONTENTS
Chapter 2. Introduction to Interesterified Fats Market
2.1. Market Overview
2.2. Key Statistics and Report Highlights
2.3. Scope of the Comprehensive Study
2.3.1. Market Definition
2.3.2 Countries and Regions Covered
2.3.3 Research Objective
2.3.4 Units, Currency, and Conversions
2.3.5 Industry Value Chain
2.4. Key Market Segments
2.5. Key Companies
2.6. Study Period
Chapter 3. Strategic Analysis Review
3.1. Interesterified Fats Pricing Analysis and Forecast
3.2. Porter’s Five Forces
3.3. Market Ecosystem
3.4. SWOT Analysis
3.5. Regulatory Scenario
3.3. Effects of Inflation, Russia-Ukraine War, moderating economic growth, and other macroeconomic factors
Chapter 4. Competitive Landscape
4.1. Market Share Analysis
4.1.1. Global Interesterified Fats Market Share by Company, 2023
4.1.2. Product Offerings of Leading Interesterified Fats Companies
4.2. Market Entropy
4.2.1. New Product Launches in the Industry
4.2.2. Mergers, Acquisitions, Joint ventures, and Partnerships
4.3. Key Strategies and Best Practices
Chapter 5. Global Market Projections: Best, Reference, and Low Case Scenarios
5.1. Growth Analysis- Case Scenario Definitions
5.2. Low Growth Case Scenario Forecasts
5.3. Reference Growth Case Scenario Forecasts
5.4. High Growth Case Scenario Forecasts
Chapter 6. Market Dynamics
6.1. Interesterified Fats Market Drivers
6.2. Interesterified Fats Market Challenges
6.6. Interesterified Fats Market Opportunities
6.4. Interesterified Fats Market Trends
Chapter 7. Global Interesterified Fats Market Outlook Trends
7.1. Global Interesterified Fats Revenue (USD Million) and CAGR (%) by Type (2021-2032)
7.2. Global Interesterified Fats Revenue (USD Million) and CAGR (%) by Application (2021-2032)
7.3. Global Interesterified Fats Revenue (USD Million) and CAGR (%) by Product (2021-2032)
By Interesterification Process
Chemical
Enzymatic
By Source
Soybean Oil
Palm Oil
Groundnut Oil
Coconut Oil
Rapeseed Oil
Sunflower Oil
Cottonseed Oil
Others
By End-User
Food Processing
Food Service
Pharmaceuticals
Cosmetics & Personal Care
Bakery & Confectionery
Others
Chapter 8. Global Interesterified Fats Regional Analysis and Outlook
8.1. Global Interesterified Fats Revenue (USD Million) By Regions (2021- 2032)
8.2. North America Interesterified Fats Revenue (USD Million) by Country (2021-2032)
8.2.1. United States Interesterified Fats Regional Analysis and Outlook
8.2.2. Canada Interesterified Fats Regional Analysis and Outlook
8.2.3. Mexico Interesterified Fats Regional Analysis and Outlook
8.3. Europe Interesterified Fats Revenue (USD Million), by Country (2021-2032)
8.3.1. Germany Interesterified Fats Regional Analysis and Outlook
8.3.2. France Interesterified Fats Regional Analysis and Outlook
8.3.3. United Kingdom Interesterified Fats Regional Analysis and Outlook
8.3.4. Spain Interesterified Fats Regional Analysis and Outlook
8.3.5. Italy Interesterified Fats Regional Analysis and Outlook
8.3.6. Russia Interesterified Fats Regional Analysis and Outlook
8.3.7. Rest of Europe Interesterified Fats Regional Analysis and Outlook
8.4. Asia Pacific Interesterified Fats Revenue (USD Million) by Country (2021-2032)
8.4.1. China Interesterified Fats Regional Analysis and Outlook
8.4.2. Japan Interesterified Fats Regional Analysis and Outlook
8.4.3. India Interesterified Fats Regional Analysis and Outlook
8.4.4. South Korea Interesterified Fats Regional Analysis and Outlook
8.4.5. Australia Interesterified Fats Regional Analysis and Outlook
8.4.6. South East Asia Interesterified Fats Regional Analysis and Outlook
8.4.7. Rest of Asia Pacific Interesterified Fats Regional Analysis and Outlook
8.5. South America Interesterified Fats Revenue (USD Million), by Country (2021-2032)
8.5.1. Brazil Interesterified Fats Regional Analysis and Outlook
8.5.2. Argentina Interesterified Fats Regional Analysis and Outlook
8.5.3. Rest of South America Interesterified Fats Regional Analysis and Outlook
8.6. Middle East and Africa Interesterified Fats Revenue (USD Million) by Country (2021-2032)
8.6.1. Middle East Interesterified Fats Regional Analysis and Outlook
8.6.2. Africa Interesterified Fats Regional Analysis and Outlook
Chapter 9. North America Interesterified Fats Analysis and Outlook
9.1. North America Interesterified Fats Revenue (USD Million) by Segments (2021-2032)
9.1.1. North America Interesterified Fats Revenue (USD Million) by Type (2021-2032)
9.1.2. North America Interesterified Fats Revenue (USD Million) by Application (2021-2032)
9.1.3. North America Interesterified Fats Revenue (USD Million) by Product (2021-2032)
By Interesterification Process
Chemical
Enzymatic
By Source
Soybean Oil
Palm Oil
Groundnut Oil
Coconut Oil
Rapeseed Oil
Sunflower Oil
Cottonseed Oil
Others
By End-User
Food Processing
Food Service
Pharmaceuticals
Cosmetics & Personal Care
Bakery & Confectionery
Others
Chapter 10. Europe Interesterified Fats Analysis and Outlook
10.1. Europe Interesterified Fats Revenue (USD Million), by Segments (USD Million) (2021-2032)
10.1.1. Europe Interesterified Fats Revenue (USD Million) by Type (2021-2032)
10.1.2. Europe Interesterified Fats Revenue (USD Million) by Application (2021-2032)
10.1.3. Europe Interesterified Fats Revenue (USD Million) by Product (2021-2032)
By Interesterification Process
Chemical
Enzymatic
By Source
Soybean Oil
Palm Oil
Groundnut Oil
Coconut Oil
Rapeseed Oil
Sunflower Oil
Cottonseed Oil
Others
By End-User
Food Processing
Food Service
Pharmaceuticals
Cosmetics & Personal Care
Bakery & Confectionery
Others
Chapter 11. Asia Pacific Interesterified Fats Analysis and Outlook
11.1. Asia Pacific Interesterified Fats Revenue (USD Million), and Revenue (USD Million) by Segments (2021-2032)
11.1.1. Asia Pacific Interesterified Fats Revenue (USD Million) by Type (2021-2032)
11.1.2. Asia Pacific Interesterified Fats Revenue (USD Million) by Application (2021-2032)
11.1.3. Asia Pacific Interesterified Fats Revenue (USD Million) by Product (2021-2032)
By Interesterification Process
Chemical
Enzymatic
By Source
Soybean Oil
Palm Oil
Groundnut Oil
Coconut Oil
Rapeseed Oil
Sunflower Oil
Cottonseed Oil
Others
By End-User
Food Processing
Food Service
Pharmaceuticals
Cosmetics & Personal Care
Bakery & Confectionery
Others
Chapter 12. South America Interesterified Fats Analysis and Outlook
12.1. South America Interesterified Fats Revenue (USD Million), by Segments (2021-2032)
12.1.1. South America Interesterified Fats Revenue (USD Million) by Type (2021-2032)
12.1.2. South America Interesterified Fats Revenue (USD Million) by Application (2021-2032)
12.1.3. South America Interesterified Fats Revenue (USD Million) by Product (2021-2032)
By Interesterification Process
Chemical
Enzymatic
By Source
Soybean Oil
Palm Oil
Groundnut Oil
Coconut Oil
Rapeseed Oil
Sunflower Oil
Cottonseed Oil
Others
By End-User
Food Processing
Food Service
Pharmaceuticals
Cosmetics & Personal Care
Bakery & Confectionery
Others
Chapter 13. Middle East and Africa Interesterified Fats Analysis and Outlook
13.1. Middle East and Africa Interesterified Fats Revenue (USD Million), by Segments (2021-2032)
13.1.1. Middle East and Africa Interesterified Fats Revenue (USD Million) by Type (2021-2032)
13.1.2. Middle East and Africa Interesterified Fats Revenue (USD Million) by Application (2021-2032)
13.1.3. Middle East and Africa Interesterified Fats Revenue (USD Million) by Product (2021-2032)
By Interesterification Process
Chemical
Enzymatic
By Source
Soybean Oil
Palm Oil
Groundnut Oil
Coconut Oil
Rapeseed Oil
Sunflower Oil
Cottonseed Oil
Others
By End-User
Food Processing
Food Service
Pharmaceuticals
Cosmetics & Personal Care
Bakery & Confectionery
Others
Chapter 14. Interesterified Fats Company Profiles
14.1 Business Overview
14.2 Product Profiles
14.3 SWOT Profiles
14.5 Recent Developments
14.6 Financial Profile
List of Companies
AAK KAMANI Pvt. Ltd
Adams Group
Archer Daniels Midland Company (ADM)
Bunge (Loders Croklaan)
Cargill Inc
FUJI OIL CO. Ltd
Novozymes A/S
Oleofinos
Willowton Group
Wilmar International Ltd
15. Methodology and Data Sources
15.1 Customization Offerings
15.2 Subscription Services
15.3 Related Reports
15.4 Publisher Expertise
LIST OF TABLES
Table 1 Market Segmentation Analysis
Table 2 Global Interesterified Fats Market Share of Leading Companies, 2023
Table 3 Product Offerings of Leading Companies
Table 4 Low Growth Scenario Forecasts
Table 5 Reference Case Growth Scenario
Table 6 High Growth Case Scenario
Table 7 Global Interesterified Fats Revenue (USD Million) And CAGR (%) By Type (2021-2032)
Table 8 Global Interesterified Fats Revenue (USD Million) And CAGR (%) By Application (2021-2032)
Table 9 Global Interesterified Fats Revenue (USD Million) And CAGR (%) By Product (2021-2032)
Table 10 Global Interesterified Fats Market Revenue (USD Million) By Regions (2021-2032)
Table 11 Global Interesterified Fats Market Share (%) By Regions (2021-2032)
Table 12 North America Interesterified Fats Revenue (USD Million) By Country (2021-2032)
Table 13 Europe Interesterified Fats Revenue (USD Million) By Country (2021-2032)
Table 14 Asia Pacific Interesterified Fats Revenue (USD Million) By Country (2021-2032)
Table 15 South America Interesterified Fats Revenue (USD Million) By Country (2021-2032)
Table 16 Middle East and Africa Interesterified Fats Revenue (USD Million) By Region (2021-2032)
Table 17 North America Interesterified Fats Revenue (USD Million) By Type (2021-2032)
Table 18 North America Interesterified Fats Revenue (USD Million) By Application (2021-2032)
Table 19 North America Interesterified Fats Revenue (USD Million) By Product (2021-2032)
Table 20 Europe Interesterified Fats Revenue (USD Million) By Type (2021-2032)
Table 21 Europe Interesterified Fats Revenue (USD Million) By Application (2021-2032)
Table 22 Europe Interesterified Fats Revenue (USD Million) By Product (2021-2032)
Table 23 Asia Pacific Interesterified Fats Revenue (USD Million) By Type (2021-2032)
Table 24 Asia Pacific Interesterified Fats Revenue (USD Million) By Application (2021-2032)
Table 25 Asia Pacific Interesterified Fats Revenue (USD Million) By Product (2021-2032)
Table 26 South America Interesterified Fats Revenue (USD Million) By Type (2021-2032)
Table 27 South America Interesterified Fats Revenue (USD Million) By Application (2021-2032)
Table 28 South America Interesterified Fats Revenue (USD Million) By Product (2021-2032)
Table 29 Middle East and Africa Interesterified Fats Revenue (USD Million) By Type (2021-2032)
Table 30 Middle East and Africa Interesterified Fats Revenue (USD Million) By Application (2021-2032)
Table 31 Middle East and Africa Interesterified Fats Revenue (USD Million) By Product (2021-2032)
LIST OF FIGURES
Figure 1. Market Scope
Figure 2. Pricing Forecasts Per Unit, 2023- 2032
Figure 3. Porter’s Five Forces
Figure 4. Global Interesterified Fats Market Revenue (USD Million) By Regions (2021-2032)
Figure 5. Global Interesterified Fats Market Share (%) By Regions (2023)
Figure 6. North America Interesterified Fats Revenue (USD Million) By Country (2021-2032)
Figure 7. United States Interesterified Fats Revenue (USD Million) By Country (2021-2032)
Figure 8. Canada Interesterified Fats Revenue (USD Million) By Country (2021-2032)
Figure 9. Mexico Interesterified Fats Revenue (USD Million) By Country (2021-2032)
Figure 10. Europe Interesterified Fats Revenue (USD Million) By Country (2021-2032)
Figure 11. Germany Interesterified Fats Revenue (USD Million) By Country (2021-2032)
Figure 12. France Interesterified Fats Revenue (USD Million) By Country (2021-2032)
Figure 13. United Kingdom Interesterified Fats Revenue (USD Million) By Country (2021-2032)
Figure 14. Spain Interesterified Fats Revenue (USD Million) By Country (2021-2032)
Figure 15. Italy Interesterified Fats Revenue (USD Million) By Country (2021-2032)
Figure 16. Russia Interesterified Fats Revenue (USD Million) By Country (2021-2032)
Figure 17. Rest of Europe Interesterified Fats Revenue (USD Million) By Country (2021-2032)
Figure 11. Asia Pacific Interesterified Fats Revenue (USD Million) By Country (2021-2032)
Figure 12. China Interesterified Fats Revenue (USD Million) By Country (2021-2032)
Figure 13. Japan Interesterified Fats Revenue (USD Million) By Country (2021-2032)
Figure 14. India Interesterified Fats Revenue (USD Million) By Country (2021-2032)
Figure 15. South Korea Interesterified Fats Revenue (USD Million) By Country (2021-2032)
Figure 16. Australia Interesterified Fats Revenue (USD Million) By Country (2021-2032)
Figure 17. South East Asia Interesterified Fats Revenue (USD Million) By Country (2021-2032)
Figure 18. South America Interesterified Fats Revenue (USD Million) By Country (2021-2032)
Figure 19. Brazil Interesterified Fats Revenue (USD Million) By Country (2021-2032)
Figure 20. Argentina Interesterified Fats Revenue (USD Million) By Country (2021-2032)
Figure 21. Rest of Asia Pacific Interesterified Fats Revenue (USD Million) By Country (2021-2032)
Figure 22. Middle East and Africa Interesterified Fats Revenue (USD Million) By Region (2021-2032)
Figure 23. Saudi Arabia Interesterified Fats Revenue (USD Million) By Region (2021-2032)
Figure 24. The UAE Interesterified Fats Revenue (USD Million) By Region (2021-2032)
Figure 25. Rest of Middle East Interesterified Fats Revenue (USD Million) By Region (2021-2032)
Figure 26. South Africa Interesterified Fats Revenue (USD Million) By Region (2021-2032)
Figure 27. Africa Interesterified Fats Revenue (USD Million) By Region (2021-2032)
Figure 28. North America Interesterified Fats Revenue (USD Million) By Type (2021-2032)
Figure 29. North America Interesterified Fats Revenue (USD Million) By Application (2021-2032)
Figure 30. North America Interesterified Fats Revenue (USD Million) By Product (2021-2032)
Figure 31. Europe Interesterified Fats Revenue (USD Million) By Type (2021-2032)
Figure 32. Europe Interesterified Fats Revenue (USD Million) By Application (2021-2032)
Figure 33. Europe Interesterified Fats Revenue (USD Million) By Product (2021-2032)
Figure 34. Asia Pacific Interesterified Fats Revenue (USD Million) By Type (2021-2032)
Figure 35. Asia Pacific Interesterified Fats Revenue (USD Million) By Application (2021-2032)
Figure 36. Asia Pacific Interesterified Fats Revenue (USD Million) By Product (2021-2032)
Figure 37. South America Interesterified Fats Revenue (USD Million) By Type (2021-2032)
Figure 38. South America Interesterified Fats Revenue (USD Million) By Application (2021-2032)
Figure 39. South America Interesterified Fats Revenue (USD Million) By Product (2021-2032)
Figure 40. Middle East and Africa Interesterified Fats Revenue (USD Million) By Type (2021-2032)
Figure 41. Middle East and Africa Interesterified Fats Revenue (USD Million) By Application (2021-2032)
Figure 42. Middle East and Africa Interesterified Fats Revenue (USD Million) By Product (2021-2032)
By Interesterification Process
Chemical
Enzymatic
By Source
Soybean Oil
Palm Oil
Groundnut Oil
Coconut Oil
Rapeseed Oil
Sunflower Oil
Cottonseed Oil
Others
By End-User
Food Processing
Food Service
Pharmaceuticals
Cosmetics & Personal Care
Bakery & Confectionery
Others
Countries Analyzed
North America (US, Canada, Mexico)
Europe (Germany, UK, France, Spain, Italy, Russia, Rest of Europe)
Asia Pacific (China, India, Japan, South Korea, Australia, South East Asia, Rest of Asia)
South America (Brazil, Argentina, Rest of South America)
Middle East and Africa (Saudi Arabia, UAE, Rest of Middle East, South Africa, Egypt, Rest of Africa)
