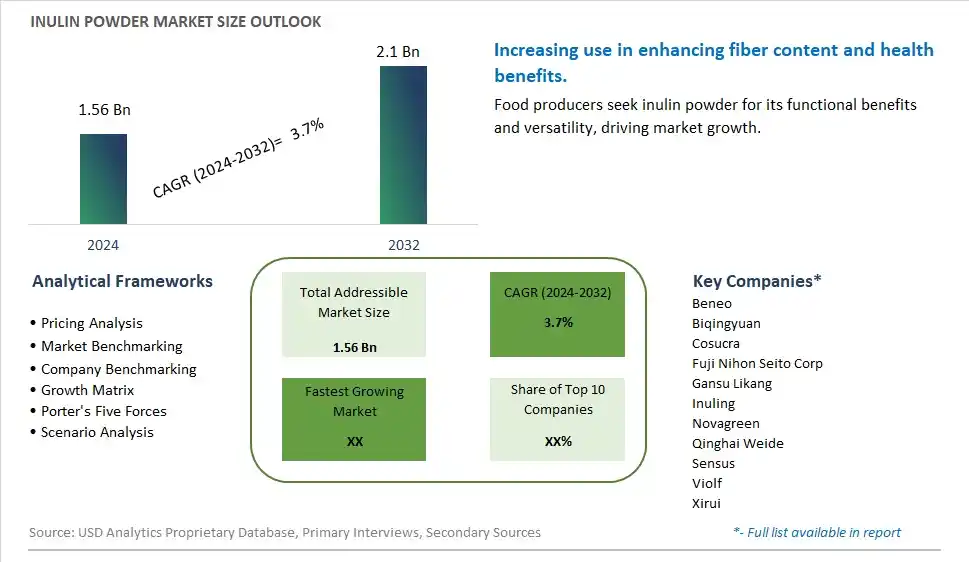
Global Inulin Powder Market Size is valued at $1.56 Billion in 2024 and is forecast to register a growth rate (CAGR) of 3.7% to reach $2.1 Billion by 2032.
The global Inulin Powder Market Comprehensive Study analyzes and forecasts the market size across 6 regions and 24 countries for diverse segments -By Type (Chicory Roots Inulin, Artichoke Inulin), By Application (Food and Beverage, Health Care Products, Others)
An Introduction to Inulin Powder Market
In 2024, the inulin powder market is experiencing robust growth, driven by the increasing demand for natural dietary fibers in food and beverage products. Inulin powder, derived from chicory roots, is valued for its prebiotic properties and ability to enhance digestive health. The market is benefiting from innovations in extraction and purification processes that improve the quality and functionality of inulin powder. The trend towards health and wellness is driving demand for fiber-rich products, including inulin-fortified foods and supplements. Additionally, the rising popularity of clean label and plant-based ingredients is further propelling market growth.
Inulin Powder Competitive Landscape
The market report analyses the leading companies in the industry including Beneo, Biqingyuan, Cosucra, Fuji Nihon Seito Corp, Gansu Likang, Inuling, Novagreen, Qinghai Weide, Sensus, Violf, Xirui, and Others.
Inulin Powder Market Dynamics
Inulin Powder Market Trend: Increasing Demand for Natural and Functional Ingredients
The most prominent trend in the Inulin Powder Market is the increasing demand for natural and functional ingredients. Inulin powder, derived from chicory root, is gaining popularity due to its prebiotic properties and health benefits, including improved digestion and enhanced nutrient absorption. This trend is driven by the growing consumer preference for clean-label products that offer functional health benefits.
Inulin Powder Market Driver: Rising Health Consciousness
A key driver in the Inulin Powder Market is the rising health consciousness among consumers. As individuals become more aware of the impact of diet on health, there is a growing demand for ingredients that contribute to overall well-being. Inulin powder, known for its ability to support gut health and provide dietary fiber, is increasingly incorporated into food and beverage products to meet this demand.
Inulin Powder Market Opportunity: Development of Health-Focused Product Lines
One significant opportunity in the Inulin Powder Market lies in the development of health-focused product lines. Companies can explore creating new products that leverage the health benefits of inulin powder, such as functional foods, dietary supplements, and beverages. By highlighting the prebiotic and fiber content, manufacturers can attract health-conscious consumers and drive market growth through innovative product offerings.
Inulin Powder Market Share Analysis: Chicory Roots Inulin segment generated the highest revenue share in the industry
Chicory Roots Inulin stands as the largest segment within the Inulin Powder Market. Derived from chicory roots, this type of inulin is favored for its high concentration of prebiotic fibers that support digestive health and overall well-being. Chicory roots inulin is widely utilized in the food and beverage industry as a functional ingredient, offering benefits such as improved texture, enhanced shelf stability, and its ability to replace fats and sugars in formulations without compromising taste or quality. The growing consumer preference for natural and clean-label products has driven the demand for chicory roots inulin, as it aligns with trends towards healthier eating habits and nutritional awareness. Additionally, chicory roots inulin's versatility extends beyond food applications to include dietary supplements and pharmaceutical formulations, further expanding its market reach and potential growth. With ongoing innovation in extraction technologies and increasing research into its health benefits, chicory roots inulin is poised to maintain its leadership position in the global Inulin Powder Market.
Inulin Powder Market Share Analysis: Health Care Products is the fastest growing segment over the forecast period to 2032
Health care products emerge as the fastest-growing segment within the Inulin Powder Market through 2032. This growth is driven by increasing awareness of the health benefits associated with inulin, such as its prebiotic properties that support digestive health and its role in managing blood sugar levels and promoting weight management. Inulin powder is highly valued in health care products, including dietary supplements, functional foods, and pharmaceuticals, due to its ability to enhance nutritional value and provide functional benefits without compromising taste or texture. The rising prevalence of chronic diseases, coupled with the growing emphasis on preventive health care and wellness, has fueled the demand for inulin-based products in the health care sector. Further, advancements in formulation techniques and manufacturing processes have expanded the application of inulin powder in a wide range of health care products, catering to diverse consumer needs and preferences globally. As research continues to uncover new health benefits and applications for inulin, the health care products segment is expected to experience robust growth, driving market expansion and innovation in the coming years.
Inulin Powder Market Segmentation
By Type
Chicory Roots Inulin
Artichoke Inulin
By Application
Food and Beverage
Health Care Products
Others
Countries Analyzed
North America (US, Canada, Mexico)
Europe (Germany, UK, France, Spain, Italy, Russia, Rest of Europe)
Asia Pacific (China, India, Japan, South Korea, Australia, South East Asia, Rest of Asia)
South America (Brazil, Argentina, Rest of South America)
Middle East and Africa (Saudi Arabia, UAE, Rest of Middle East, South Africa, Egypt, Rest of Africa)
Inulin Powder Companies Profiled in the Study
Beneo
Biqingyuan
Cosucra
Fuji Nihon Seito Corp
Gansu Likang
Inuling
Novagreen
Qinghai Weide
Sensus
Violf
Xirui
*- List Not Exhaustive
Chapter 1. TABLE OF CONTENTS
Chapter 2. Introduction to Inulin Powder Market
2.1. Market Overview
2.2. Key Statistics and Report Highlights
2.3. Scope of the Comprehensive Study
2.3.1. Market Definition
2.3.2 Countries and Regions Covered
2.3.3 Research Objective
2.3.4 Units, Currency, and Conversions
2.3.5 Industry Value Chain
2.4. Key Market Segments
2.5. Key Companies
2.6. Study Period
Chapter 3. Strategic Analysis Review
3.1. Inulin Powder Pricing Analysis and Forecast
3.2. Porter’s Five Forces
3.3. Market Ecosystem
3.4. SWOT Analysis
3.5. Regulatory Scenario
3.3. Effects of Inflation, Russia-Ukraine War, moderating economic growth, and other macroeconomic factors
Chapter 4. Competitive Landscape
4.1. Market Share Analysis
4.1.1. Global Inulin Powder Market Share by Company, 2023
4.1.2. Product Offerings of Leading Inulin Powder Companies
4.2. Market Entropy
4.2.1. New Product Launches in the Industry
4.2.2. Mergers, Acquisitions, Joint ventures, and Partnerships
4.3. Key Strategies and Best Practices
Chapter 5. Global Market Projections: Best, Reference, and Low Case Scenarios
5.1. Growth Analysis- Case Scenario Definitions
5.2. Low Growth Case Scenario Forecasts
5.3. Reference Growth Case Scenario Forecasts
5.4. High Growth Case Scenario Forecasts
Chapter 6. Market Dynamics
6.1. Inulin Powder Market Drivers
6.2. Inulin Powder Market Challenges
6.6. Inulin Powder Market Opportunities
6.4. Inulin Powder Market Trends
Chapter 7. Global Inulin Powder Market Outlook Trends
7.1. Global Inulin Powder Revenue (USD Million) and CAGR (%) by Type (2021-2032)
7.2. Global Inulin Powder Revenue (USD Million) and CAGR (%) by Application (2021-2032)
7.3. Global Inulin Powder Revenue (USD Million) and CAGR (%) by Product (2021-2032)
By Type
Chicory Roots Inulin
Artichoke Inulin
By Application
Food and Beverage
Health Care Products
Others
Chapter 8. Global Inulin Powder Regional Analysis and Outlook
8.1. Global Inulin Powder Revenue (USD Million) By Regions (2021- 2032)
8.2. North America Inulin Powder Revenue (USD Million) by Country (2021-2032)
8.2.1. United States Inulin Powder Regional Analysis and Outlook
8.2.2. Canada Inulin Powder Regional Analysis and Outlook
8.2.3. Mexico Inulin Powder Regional Analysis and Outlook
8.3. Europe Inulin Powder Revenue (USD Million), by Country (2021-2032)
8.3.1. Germany Inulin Powder Regional Analysis and Outlook
8.3.2. France Inulin Powder Regional Analysis and Outlook
8.3.3. United Kingdom Inulin Powder Regional Analysis and Outlook
8.3.4. Spain Inulin Powder Regional Analysis and Outlook
8.3.5. Italy Inulin Powder Regional Analysis and Outlook
8.3.6. Russia Inulin Powder Regional Analysis and Outlook
8.3.7. Rest of Europe Inulin Powder Regional Analysis and Outlook
8.4. Asia Pacific Inulin Powder Revenue (USD Million) by Country (2021-2032)
8.4.1. China Inulin Powder Regional Analysis and Outlook
8.4.2. Japan Inulin Powder Regional Analysis and Outlook
8.4.3. India Inulin Powder Regional Analysis and Outlook
8.4.4. South Korea Inulin Powder Regional Analysis and Outlook
8.4.5. Australia Inulin Powder Regional Analysis and Outlook
8.4.6. South East Asia Inulin Powder Regional Analysis and Outlook
8.4.7. Rest of Asia Pacific Inulin Powder Regional Analysis and Outlook
8.5. South America Inulin Powder Revenue (USD Million), by Country (2021-2032)
8.5.1. Brazil Inulin Powder Regional Analysis and Outlook
8.5.2. Argentina Inulin Powder Regional Analysis and Outlook
8.5.3. Rest of South America Inulin Powder Regional Analysis and Outlook
8.6. Middle East and Africa Inulin Powder Revenue (USD Million) by Country (2021-2032)
8.6.1. Middle East Inulin Powder Regional Analysis and Outlook
8.6.2. Africa Inulin Powder Regional Analysis and Outlook
Chapter 9. North America Inulin Powder Analysis and Outlook
9.1. North America Inulin Powder Revenue (USD Million) by Segments (2021-2032)
9.1.1. North America Inulin Powder Revenue (USD Million) by Type (2021-2032)
9.1.2. North America Inulin Powder Revenue (USD Million) by Application (2021-2032)
9.1.3. North America Inulin Powder Revenue (USD Million) by Product (2021-2032)
By Type
Chicory Roots Inulin
Artichoke Inulin
By Application
Food and Beverage
Health Care Products
Others
Chapter 10. Europe Inulin Powder Analysis and Outlook
10.1. Europe Inulin Powder Revenue (USD Million), by Segments (USD Million) (2021-2032)
10.1.1. Europe Inulin Powder Revenue (USD Million) by Type (2021-2032)
10.1.2. Europe Inulin Powder Revenue (USD Million) by Application (2021-2032)
10.1.3. Europe Inulin Powder Revenue (USD Million) by Product (2021-2032)
By Type
Chicory Roots Inulin
Artichoke Inulin
By Application
Food and Beverage
Health Care Products
Others
Chapter 11. Asia Pacific Inulin Powder Analysis and Outlook
11.1. Asia Pacific Inulin Powder Revenue (USD Million), and Revenue (USD Million) by Segments (2021-2032)
11.1.1. Asia Pacific Inulin Powder Revenue (USD Million) by Type (2021-2032)
11.1.2. Asia Pacific Inulin Powder Revenue (USD Million) by Application (2021-2032)
11.1.3. Asia Pacific Inulin Powder Revenue (USD Million) by Product (2021-2032)
By Type
Chicory Roots Inulin
Artichoke Inulin
By Application
Food and Beverage
Health Care Products
Others
Chapter 12. South America Inulin Powder Analysis and Outlook
12.1. South America Inulin Powder Revenue (USD Million), by Segments (2021-2032)
12.1.1. South America Inulin Powder Revenue (USD Million) by Type (2021-2032)
12.1.2. South America Inulin Powder Revenue (USD Million) by Application (2021-2032)
12.1.3. South America Inulin Powder Revenue (USD Million) by Product (2021-2032)
By Type
Chicory Roots Inulin
Artichoke Inulin
By Application
Food and Beverage
Health Care Products
Others
Chapter 13. Middle East and Africa Inulin Powder Analysis and Outlook
13.1. Middle East and Africa Inulin Powder Revenue (USD Million), by Segments (2021-2032)
13.1.1. Middle East and Africa Inulin Powder Revenue (USD Million) by Type (2021-2032)
13.1.2. Middle East and Africa Inulin Powder Revenue (USD Million) by Application (2021-2032)
13.1.3. Middle East and Africa Inulin Powder Revenue (USD Million) by Product (2021-2032)
By Type
Chicory Roots Inulin
Artichoke Inulin
By Application
Food and Beverage
Health Care Products
Others
Chapter 14. Inulin Powder Company Profiles
14.1 Business Overview
14.2 Product Profiles
14.3 SWOT Profiles
14.5 Recent Developments
14.6 Financial Profile
List of Companies
Beneo
Biqingyuan
Cosucra
Fuji Nihon Seito Corp
Gansu Likang
Inuling
Novagreen
Qinghai Weide
Sensus
Violf
Xirui
15. Methodology and Data Sources
15.1 Customization Offerings
15.2 Subscription Services
15.3 Related Reports
15.4 Publisher Expertise
LIST OF TABLES
Table 1 Market Segmentation Analysis
Table 2 Global Inulin Powder Market Share of Leading Companies, 2023
Table 3 Product Offerings of Leading Companies
Table 4 Low Growth Scenario Forecasts
Table 5 Reference Case Growth Scenario
Table 6 High Growth Case Scenario
Table 7 Global Inulin Powder Revenue (USD Million) And CAGR (%) By Type (2021-2032)
Table 8 Global Inulin Powder Revenue (USD Million) And CAGR (%) By Application (2021-2032)
Table 9 Global Inulin Powder Revenue (USD Million) And CAGR (%) By Product (2021-2032)
Table 10 Global Inulin Powder Market Revenue (USD Million) By Regions (2021-2032)
Table 11 Global Inulin Powder Market Share (%) By Regions (2021-2032)
Table 12 North America Inulin Powder Revenue (USD Million) By Country (2021-2032)
Table 13 Europe Inulin Powder Revenue (USD Million) By Country (2021-2032)
Table 14 Asia Pacific Inulin Powder Revenue (USD Million) By Country (2021-2032)
Table 15 South America Inulin Powder Revenue (USD Million) By Country (2021-2032)
Table 16 Middle East and Africa Inulin Powder Revenue (USD Million) By Region (2021-2032)
Table 17 North America Inulin Powder Revenue (USD Million) By Type (2021-2032)
Table 18 North America Inulin Powder Revenue (USD Million) By Application (2021-2032)
Table 19 North America Inulin Powder Revenue (USD Million) By Product (2021-2032)
Table 20 Europe Inulin Powder Revenue (USD Million) By Type (2021-2032)
Table 21 Europe Inulin Powder Revenue (USD Million) By Application (2021-2032)
Table 22 Europe Inulin Powder Revenue (USD Million) By Product (2021-2032)
Table 23 Asia Pacific Inulin Powder Revenue (USD Million) By Type (2021-2032)
Table 24 Asia Pacific Inulin Powder Revenue (USD Million) By Application (2021-2032)
Table 25 Asia Pacific Inulin Powder Revenue (USD Million) By Product (2021-2032)
Table 26 South America Inulin Powder Revenue (USD Million) By Type (2021-2032)
Table 27 South America Inulin Powder Revenue (USD Million) By Application (2021-2032)
Table 28 South America Inulin Powder Revenue (USD Million) By Product (2021-2032)
Table 29 Middle East and Africa Inulin Powder Revenue (USD Million) By Type (2021-2032)
Table 30 Middle East and Africa Inulin Powder Revenue (USD Million) By Application (2021-2032)
Table 31 Middle East and Africa Inulin Powder Revenue (USD Million) By Product (2021-2032)
LIST OF FIGURES
Figure 1. Market Scope
Figure 2. Pricing Forecasts Per Unit, 2023- 2032
Figure 3. Porter’s Five Forces
Figure 4. Global Inulin Powder Market Revenue (USD Million) By Regions (2021-2032)
Figure 5. Global Inulin Powder Market Share (%) By Regions (2023)
Figure 6. North America Inulin Powder Revenue (USD Million) By Country (2021-2032)
Figure 7. United States Inulin Powder Revenue (USD Million) By Country (2021-2032)
Figure 8. Canada Inulin Powder Revenue (USD Million) By Country (2021-2032)
Figure 9. Mexico Inulin Powder Revenue (USD Million) By Country (2021-2032)
Figure 10. Europe Inulin Powder Revenue (USD Million) By Country (2021-2032)
Figure 11. Germany Inulin Powder Revenue (USD Million) By Country (2021-2032)
Figure 12. France Inulin Powder Revenue (USD Million) By Country (2021-2032)
Figure 13. United Kingdom Inulin Powder Revenue (USD Million) By Country (2021-2032)
Figure 14. Spain Inulin Powder Revenue (USD Million) By Country (2021-2032)
Figure 15. Italy Inulin Powder Revenue (USD Million) By Country (2021-2032)
Figure 16. Russia Inulin Powder Revenue (USD Million) By Country (2021-2032)
Figure 17. Rest of Europe Inulin Powder Revenue (USD Million) By Country (2021-2032)
Figure 11. Asia Pacific Inulin Powder Revenue (USD Million) By Country (2021-2032)
Figure 12. China Inulin Powder Revenue (USD Million) By Country (2021-2032)
Figure 13. Japan Inulin Powder Revenue (USD Million) By Country (2021-2032)
Figure 14. India Inulin Powder Revenue (USD Million) By Country (2021-2032)
Figure 15. South Korea Inulin Powder Revenue (USD Million) By Country (2021-2032)
Figure 16. Australia Inulin Powder Revenue (USD Million) By Country (2021-2032)
Figure 17. South East Asia Inulin Powder Revenue (USD Million) By Country (2021-2032)
Figure 18. South America Inulin Powder Revenue (USD Million) By Country (2021-2032)
Figure 19. Brazil Inulin Powder Revenue (USD Million) By Country (2021-2032)
Figure 20. Argentina Inulin Powder Revenue (USD Million) By Country (2021-2032)
Figure 21. Rest of Asia Pacific Inulin Powder Revenue (USD Million) By Country (2021-2032)
Figure 22. Middle East and Africa Inulin Powder Revenue (USD Million) By Region (2021-2032)
Figure 23. Saudi Arabia Inulin Powder Revenue (USD Million) By Region (2021-2032)
Figure 24. The UAE Inulin Powder Revenue (USD Million) By Region (2021-2032)
Figure 25. Rest of Middle East Inulin Powder Revenue (USD Million) By Region (2021-2032)
Figure 26. South Africa Inulin Powder Revenue (USD Million) By Region (2021-2032)
Figure 27. Africa Inulin Powder Revenue (USD Million) By Region (2021-2032)
Figure 28. North America Inulin Powder Revenue (USD Million) By Type (2021-2032)
Figure 29. North America Inulin Powder Revenue (USD Million) By Application (2021-2032)
Figure 30. North America Inulin Powder Revenue (USD Million) By Product (2021-2032)
Figure 31. Europe Inulin Powder Revenue (USD Million) By Type (2021-2032)
Figure 32. Europe Inulin Powder Revenue (USD Million) By Application (2021-2032)
Figure 33. Europe Inulin Powder Revenue (USD Million) By Product (2021-2032)
Figure 34. Asia Pacific Inulin Powder Revenue (USD Million) By Type (2021-2032)
Figure 35. Asia Pacific Inulin Powder Revenue (USD Million) By Application (2021-2032)
Figure 36. Asia Pacific Inulin Powder Revenue (USD Million) By Product (2021-2032)
Figure 37. South America Inulin Powder Revenue (USD Million) By Type (2021-2032)
Figure 38. South America Inulin Powder Revenue (USD Million) By Application (2021-2032)
Figure 39. South America Inulin Powder Revenue (USD Million) By Product (2021-2032)
Figure 40. Middle East and Africa Inulin Powder Revenue (USD Million) By Type (2021-2032)
Figure 41. Middle East and Africa Inulin Powder Revenue (USD Million) By Application (2021-2032)
Figure 42. Middle East and Africa Inulin Powder Revenue (USD Million) By Product (2021-2032)
By Type
Chicory Roots Inulin
Artichoke Inulin
By Application
Food and Beverage
Health Care Products
Others
Countries Analyzed
North America (US, Canada, Mexico)
Europe (Germany, UK, France, Spain, Italy, Russia, Rest of Europe)
Asia Pacific (China, India, Japan, South Korea, Australia, South East Asia, Rest of Asia)
South America (Brazil, Argentina, Rest of South America)
Middle East and Africa (Saudi Arabia, UAE, Rest of Middle East, South Africa, Egypt, Rest of Africa)
