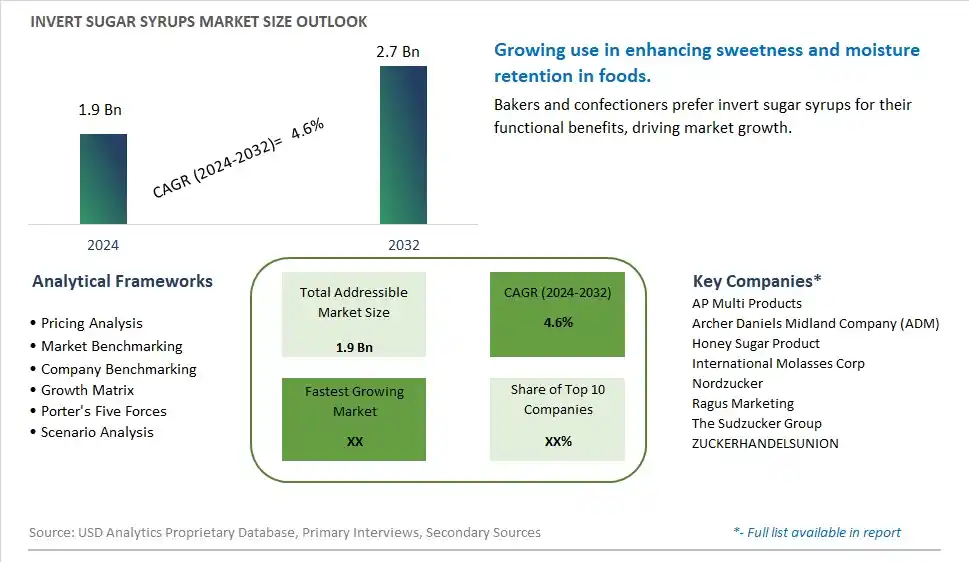
Global Invert Sugar Syrups Market Size is valued at $1.9 Billion in 2024 and is forecast to register a growth rate (CAGR) of 4.6% to reach $2.7 Billion by 2032.
The global Invert Sugar Syrups Market Comprehensive Study analyzes and forecasts the market size across 6 regions and 24 countries for diverse segments -By Type (Organic, Conventional), By Application (Food Industry, Beverage Industry, Personal Care, Dietary Supplements, Pharmaceuticals, Others)
An Introduction to Invert Sugar Syrups Market
In 2024, the invert sugar syrups market is witnessing steady growth, driven by their extensive use in the food and beverage industry for enhancing sweetness, moisture retention, and shelf life of products. Invert sugar syrups, which are a mixture of glucose and fructose, are preferred for their ability to prevent crystallization in confectioneries and improve texture in baked goods. The market benefits from increasing demand for natural sweeteners and clean label products. Innovations in production processes are enhancing the quality and efficiency of invert sugar syrups, catering to a wide range of applications from beverages to processed foods.
Invert Sugar Syrups Competitive Landscape
The market report analyses the leading companies in the industry including AP Multi Products, Archer Daniels Midland Company (ADM), Honey Sugar Product, International Molasses Corp, Nordzucker, Ragus Marketing, The Sudzucker Group, ZUCKERHANDELSUNION, and Others.
Invert Sugar Syrups Market Dynamics
Invert Sugar Syrups Market Trend: Growing Use in Confectionery and Bakery Products
The most prominent trend in the Invert Sugar Syrups Market is the growing use of invert sugar syrups in confectionery and bakery products. Invert sugar syrups, known for their ability to retain moisture and enhance sweetness, are becoming essential ingredients in a variety of sweet treats and baked goods. This trend is driven by the demand for products with improved texture, extended shelf life, and consistent quality.
Invert Sugar Syrups Market Driver: Expansion of the Confectionery and Bakery Industries
A key driver in the Invert Sugar Syrups Market is the expansion of the confectionery and bakery industries. As these sectors continue to grow, particularly in emerging markets, there is an increasing need for ingredients that enhance product quality and consumer appeal. Invert sugar syrups offer multiple functional benefits, making them a preferred choice for manufacturers looking to improve the taste, texture, and shelf life of their products.
Invert Sugar Syrups Market Opportunity: Development of Specialty Invert Sugar Syrups
One significant opportunity in the Invert Sugar Syrups Market lies in the development of specialty invert sugar syrups. Companies can innovate by creating syrups with unique flavor profiles, organic certification, or tailored functional properties to cater to specific product needs. This approach can help manufacturers differentiate their offerings, attract niche markets, and drive growth in the invert sugar syrups segment.
Invert Sugar Syrups Market Share Analysis: Conventional segment generated the highest revenue share in the industry
The conventional segment is identified as the largest within the Invert Sugar Syrups Market. Conventional invert sugar syrups are widely used in the food and beverage industry due to their affordability, consistent quality, and versatility in various applications. These syrups are produced through the hydrolysis of sucrose, resulting in a mixture of glucose and fructose that enhances sweetness, improves texture, and prolongs shelf life in products such as baked goods, confectionery, beverages, and processed foods. The demand for conventional invert sugar syrups is driven by their functional properties, which help in enhancing flavor profiles, providing moisture retention, and preventing crystallization in food products. Further, the established infrastructure for conventional sugar processing and distribution supports its widespread availability and adoption across different regions. As consumer preferences evolve towards cleaner labels and natural ingredients, conventional invert sugar syrups continue to play a crucial role in meeting the demand for cost-effective sweetening solutions without compromising on taste or product performance.
Invert Sugar Syrups Market Share Analysis: Dietary Supplements is the fastest growing segment over the forecast period to 2032
Dietary supplements emerge as the fastest-growing segment within the Invert Sugar Syrups Market through 2032. This growth is driven by increasing consumer awareness and demand for functional and nutritional supplements that incorporate invert sugar syrups as a source of quick energy and enhanced taste. Invert sugar syrups, rich in glucose and fructose, are valued in dietary supplements for their ability to improve palatability and facilitate nutrient absorption, making them ideal carriers for vitamins, minerals, and other active ingredients. The rising popularity of dietary supplements for maintaining overall health and well-being, coupled with the convenience and effectiveness of invert sugar syrups in formulation, drives their usage across a diverse range of supplement categories. Further, advancements in manufacturing processes and formulation techniques continue to expand the application of invert sugar syrups in dietary supplements, meeting the evolving preferences of health-conscious consumers globally. As the dietary supplement market grows and diversifies, the demand for invert sugar syrups is expected to surge, contributing significantly to the overall market expansion in the coming years.
Invert Sugar Syrups Market Segmentation
By Type
Organic
Conventional
By Application
Food Industry
Beverage Industry
Personal Care
Dietary Supplements
Pharmaceuticals
Others
Countries Analyzed
North America (US, Canada, Mexico)
Europe (Germany, UK, France, Spain, Italy, Russia, Rest of Europe)
Asia Pacific (China, India, Japan, South Korea, Australia, South East Asia, Rest of Asia)
South America (Brazil, Argentina, Rest of South America)
Middle East and Africa (Saudi Arabia, UAE, Rest of Middle East, South Africa, Egypt, Rest of Africa)
Invert Sugar Syrups Companies Profiled in the Study
AP Multi Products
Archer Daniels Midland Company (ADM)
Honey Sugar Product
International Molasses Corp
Nordzucker
Ragus Marketing
The Sudzucker Group
ZUCKERHANDELSUNION
*- List Not Exhaustive
Chapter 1. TABLE OF CONTENTS
Chapter 2. Introduction to Invert Sugar Syrups Market
2.1. Market Overview
2.2. Key Statistics and Report Highlights
2.3. Scope of the Comprehensive Study
2.3.1. Market Definition
2.3.2 Countries and Regions Covered
2.3.3 Research Objective
2.3.4 Units, Currency, and Conversions
2.3.5 Industry Value Chain
2.4. Key Market Segments
2.5. Key Companies
2.6. Study Period
Chapter 3. Strategic Analysis Review
3.1. Invert Sugar Syrups Pricing Analysis and Forecast
3.2. Porter’s Five Forces
3.3. Market Ecosystem
3.4. SWOT Analysis
3.5. Regulatory Scenario
3.3. Effects of Inflation, Russia-Ukraine War, moderating economic growth, and other macroeconomic factors
Chapter 4. Competitive Landscape
4.1. Market Share Analysis
4.1.1. Global Invert Sugar Syrups Market Share by Company, 2023
4.1.2. Product Offerings of Leading Invert Sugar Syrups Companies
4.2. Market Entropy
4.2.1. New Product Launches in the Industry
4.2.2. Mergers, Acquisitions, Joint ventures, and Partnerships
4.3. Key Strategies and Best Practices
Chapter 5. Global Market Projections: Best, Reference, and Low Case Scenarios
5.1. Growth Analysis- Case Scenario Definitions
5.2. Low Growth Case Scenario Forecasts
5.3. Reference Growth Case Scenario Forecasts
5.4. High Growth Case Scenario Forecasts
Chapter 6. Market Dynamics
6.1. Invert Sugar Syrups Market Drivers
6.2. Invert Sugar Syrups Market Challenges
6.6. Invert Sugar Syrups Market Opportunities
6.4. Invert Sugar Syrups Market Trends
Chapter 7. Global Invert Sugar Syrups Market Outlook Trends
7.1. Global Invert Sugar Syrups Revenue (USD Million) and CAGR (%) by Type (2021-2032)
7.2. Global Invert Sugar Syrups Revenue (USD Million) and CAGR (%) by Application (2021-2032)
7.3. Global Invert Sugar Syrups Revenue (USD Million) and CAGR (%) by Product (2021-2032)
By Type
Organic
Conventional
By Application
Food Industry
Beverage Industry
Personal Care
Dietary Supplements
Pharmaceuticals
Others
Chapter 8. Global Invert Sugar Syrups Regional Analysis and Outlook
8.1. Global Invert Sugar Syrups Revenue (USD Million) By Regions (2021- 2032)
8.2. North America Invert Sugar Syrups Revenue (USD Million) by Country (2021-2032)
8.2.1. United States Invert Sugar Syrups Regional Analysis and Outlook
8.2.2. Canada Invert Sugar Syrups Regional Analysis and Outlook
8.2.3. Mexico Invert Sugar Syrups Regional Analysis and Outlook
8.3. Europe Invert Sugar Syrups Revenue (USD Million), by Country (2021-2032)
8.3.1. Germany Invert Sugar Syrups Regional Analysis and Outlook
8.3.2. France Invert Sugar Syrups Regional Analysis and Outlook
8.3.3. United Kingdom Invert Sugar Syrups Regional Analysis and Outlook
8.3.4. Spain Invert Sugar Syrups Regional Analysis and Outlook
8.3.5. Italy Invert Sugar Syrups Regional Analysis and Outlook
8.3.6. Russia Invert Sugar Syrups Regional Analysis and Outlook
8.3.7. Rest of Europe Invert Sugar Syrups Regional Analysis and Outlook
8.4. Asia Pacific Invert Sugar Syrups Revenue (USD Million) by Country (2021-2032)
8.4.1. China Invert Sugar Syrups Regional Analysis and Outlook
8.4.2. Japan Invert Sugar Syrups Regional Analysis and Outlook
8.4.3. India Invert Sugar Syrups Regional Analysis and Outlook
8.4.4. South Korea Invert Sugar Syrups Regional Analysis and Outlook
8.4.5. Australia Invert Sugar Syrups Regional Analysis and Outlook
8.4.6. South East Asia Invert Sugar Syrups Regional Analysis and Outlook
8.4.7. Rest of Asia Pacific Invert Sugar Syrups Regional Analysis and Outlook
8.5. South America Invert Sugar Syrups Revenue (USD Million), by Country (2021-2032)
8.5.1. Brazil Invert Sugar Syrups Regional Analysis and Outlook
8.5.2. Argentina Invert Sugar Syrups Regional Analysis and Outlook
8.5.3. Rest of South America Invert Sugar Syrups Regional Analysis and Outlook
8.6. Middle East and Africa Invert Sugar Syrups Revenue (USD Million) by Country (2021-2032)
8.6.1. Middle East Invert Sugar Syrups Regional Analysis and Outlook
8.6.2. Africa Invert Sugar Syrups Regional Analysis and Outlook
Chapter 9. North America Invert Sugar Syrups Analysis and Outlook
9.1. North America Invert Sugar Syrups Revenue (USD Million) by Segments (2021-2032)
9.1.1. North America Invert Sugar Syrups Revenue (USD Million) by Type (2021-2032)
9.1.2. North America Invert Sugar Syrups Revenue (USD Million) by Application (2021-2032)
9.1.3. North America Invert Sugar Syrups Revenue (USD Million) by Product (2021-2032)
By Type
Organic
Conventional
By Application
Food Industry
Beverage Industry
Personal Care
Dietary Supplements
Pharmaceuticals
Others
Chapter 10. Europe Invert Sugar Syrups Analysis and Outlook
10.1. Europe Invert Sugar Syrups Revenue (USD Million), by Segments (USD Million) (2021-2032)
10.1.1. Europe Invert Sugar Syrups Revenue (USD Million) by Type (2021-2032)
10.1.2. Europe Invert Sugar Syrups Revenue (USD Million) by Application (2021-2032)
10.1.3. Europe Invert Sugar Syrups Revenue (USD Million) by Product (2021-2032)
By Type
Organic
Conventional
By Application
Food Industry
Beverage Industry
Personal Care
Dietary Supplements
Pharmaceuticals
Others
Chapter 11. Asia Pacific Invert Sugar Syrups Analysis and Outlook
11.1. Asia Pacific Invert Sugar Syrups Revenue (USD Million), and Revenue (USD Million) by Segments (2021-2032)
11.1.1. Asia Pacific Invert Sugar Syrups Revenue (USD Million) by Type (2021-2032)
11.1.2. Asia Pacific Invert Sugar Syrups Revenue (USD Million) by Application (2021-2032)
11.1.3. Asia Pacific Invert Sugar Syrups Revenue (USD Million) by Product (2021-2032)
By Type
Organic
Conventional
By Application
Food Industry
Beverage Industry
Personal Care
Dietary Supplements
Pharmaceuticals
Others
Chapter 12. South America Invert Sugar Syrups Analysis and Outlook
12.1. South America Invert Sugar Syrups Revenue (USD Million), by Segments (2021-2032)
12.1.1. South America Invert Sugar Syrups Revenue (USD Million) by Type (2021-2032)
12.1.2. South America Invert Sugar Syrups Revenue (USD Million) by Application (2021-2032)
12.1.3. South America Invert Sugar Syrups Revenue (USD Million) by Product (2021-2032)
By Type
Organic
Conventional
By Application
Food Industry
Beverage Industry
Personal Care
Dietary Supplements
Pharmaceuticals
Others
Chapter 13. Middle East and Africa Invert Sugar Syrups Analysis and Outlook
13.1. Middle East and Africa Invert Sugar Syrups Revenue (USD Million), by Segments (2021-2032)
13.1.1. Middle East and Africa Invert Sugar Syrups Revenue (USD Million) by Type (2021-2032)
13.1.2. Middle East and Africa Invert Sugar Syrups Revenue (USD Million) by Application (2021-2032)
13.1.3. Middle East and Africa Invert Sugar Syrups Revenue (USD Million) by Product (2021-2032)
By Type
Organic
Conventional
By Application
Food Industry
Beverage Industry
Personal Care
Dietary Supplements
Pharmaceuticals
Others
Chapter 14. Invert Sugar Syrups Company Profiles
14.1 Business Overview
14.2 Product Profiles
14.3 SWOT Profiles
14.5 Recent Developments
14.6 Financial Profile
List of Companies
AP Multi Products
Archer Daniels Midland Company (ADM)
Honey Sugar Product
International Molasses Corp
Nordzucker
Ragus Marketing
The Sudzucker Group
ZUCKERHANDELSUNION
15. Methodology and Data Sources
15.1 Customization Offerings
15.2 Subscription Services
15.3 Related Reports
15.4 Publisher Expertise
LIST OF TABLES
Table 1 Market Segmentation Analysis
Table 2 Global Invert Sugar Syrups Market Share of Leading Companies, 2023
Table 3 Product Offerings of Leading Companies
Table 4 Low Growth Scenario Forecasts
Table 5 Reference Case Growth Scenario
Table 6 High Growth Case Scenario
Table 7 Global Invert Sugar Syrups Revenue (USD Million) And CAGR (%) By Type (2021-2032)
Table 8 Global Invert Sugar Syrups Revenue (USD Million) And CAGR (%) By Application (2021-2032)
Table 9 Global Invert Sugar Syrups Revenue (USD Million) And CAGR (%) By Product (2021-2032)
Table 10 Global Invert Sugar Syrups Market Revenue (USD Million) By Regions (2021-2032)
Table 11 Global Invert Sugar Syrups Market Share (%) By Regions (2021-2032)
Table 12 North America Invert Sugar Syrups Revenue (USD Million) By Country (2021-2032)
Table 13 Europe Invert Sugar Syrups Revenue (USD Million) By Country (2021-2032)
Table 14 Asia Pacific Invert Sugar Syrups Revenue (USD Million) By Country (2021-2032)
Table 15 South America Invert Sugar Syrups Revenue (USD Million) By Country (2021-2032)
Table 16 Middle East and Africa Invert Sugar Syrups Revenue (USD Million) By Region (2021-2032)
Table 17 North America Invert Sugar Syrups Revenue (USD Million) By Type (2021-2032)
Table 18 North America Invert Sugar Syrups Revenue (USD Million) By Application (2021-2032)
Table 19 North America Invert Sugar Syrups Revenue (USD Million) By Product (2021-2032)
Table 20 Europe Invert Sugar Syrups Revenue (USD Million) By Type (2021-2032)
Table 21 Europe Invert Sugar Syrups Revenue (USD Million) By Application (2021-2032)
Table 22 Europe Invert Sugar Syrups Revenue (USD Million) By Product (2021-2032)
Table 23 Asia Pacific Invert Sugar Syrups Revenue (USD Million) By Type (2021-2032)
Table 24 Asia Pacific Invert Sugar Syrups Revenue (USD Million) By Application (2021-2032)
Table 25 Asia Pacific Invert Sugar Syrups Revenue (USD Million) By Product (2021-2032)
Table 26 South America Invert Sugar Syrups Revenue (USD Million) By Type (2021-2032)
Table 27 South America Invert Sugar Syrups Revenue (USD Million) By Application (2021-2032)
Table 28 South America Invert Sugar Syrups Revenue (USD Million) By Product (2021-2032)
Table 29 Middle East and Africa Invert Sugar Syrups Revenue (USD Million) By Type (2021-2032)
Table 30 Middle East and Africa Invert Sugar Syrups Revenue (USD Million) By Application (2021-2032)
Table 31 Middle East and Africa Invert Sugar Syrups Revenue (USD Million) By Product (2021-2032)
LIST OF FIGURES
Figure 1. Market Scope
Figure 2. Pricing Forecasts Per Unit, 2023- 2032
Figure 3. Porter’s Five Forces
Figure 4. Global Invert Sugar Syrups Market Revenue (USD Million) By Regions (2021-2032)
Figure 5. Global Invert Sugar Syrups Market Share (%) By Regions (2023)
Figure 6. North America Invert Sugar Syrups Revenue (USD Million) By Country (2021-2032)
Figure 7. United States Invert Sugar Syrups Revenue (USD Million) By Country (2021-2032)
Figure 8. Canada Invert Sugar Syrups Revenue (USD Million) By Country (2021-2032)
Figure 9. Mexico Invert Sugar Syrups Revenue (USD Million) By Country (2021-2032)
Figure 10. Europe Invert Sugar Syrups Revenue (USD Million) By Country (2021-2032)
Figure 11. Germany Invert Sugar Syrups Revenue (USD Million) By Country (2021-2032)
Figure 12. France Invert Sugar Syrups Revenue (USD Million) By Country (2021-2032)
Figure 13. United Kingdom Invert Sugar Syrups Revenue (USD Million) By Country (2021-2032)
Figure 14. Spain Invert Sugar Syrups Revenue (USD Million) By Country (2021-2032)
Figure 15. Italy Invert Sugar Syrups Revenue (USD Million) By Country (2021-2032)
Figure 16. Russia Invert Sugar Syrups Revenue (USD Million) By Country (2021-2032)
Figure 17. Rest of Europe Invert Sugar Syrups Revenue (USD Million) By Country (2021-2032)
Figure 11. Asia Pacific Invert Sugar Syrups Revenue (USD Million) By Country (2021-2032)
Figure 12. China Invert Sugar Syrups Revenue (USD Million) By Country (2021-2032)
Figure 13. Japan Invert Sugar Syrups Revenue (USD Million) By Country (2021-2032)
Figure 14. India Invert Sugar Syrups Revenue (USD Million) By Country (2021-2032)
Figure 15. South Korea Invert Sugar Syrups Revenue (USD Million) By Country (2021-2032)
Figure 16. Australia Invert Sugar Syrups Revenue (USD Million) By Country (2021-2032)
Figure 17. South East Asia Invert Sugar Syrups Revenue (USD Million) By Country (2021-2032)
Figure 18. South America Invert Sugar Syrups Revenue (USD Million) By Country (2021-2032)
Figure 19. Brazil Invert Sugar Syrups Revenue (USD Million) By Country (2021-2032)
Figure 20. Argentina Invert Sugar Syrups Revenue (USD Million) By Country (2021-2032)
Figure 21. Rest of Asia Pacific Invert Sugar Syrups Revenue (USD Million) By Country (2021-2032)
Figure 22. Middle East and Africa Invert Sugar Syrups Revenue (USD Million) By Region (2021-2032)
Figure 23. Saudi Arabia Invert Sugar Syrups Revenue (USD Million) By Region (2021-2032)
Figure 24. The UAE Invert Sugar Syrups Revenue (USD Million) By Region (2021-2032)
Figure 25. Rest of Middle East Invert Sugar Syrups Revenue (USD Million) By Region (2021-2032)
Figure 26. South Africa Invert Sugar Syrups Revenue (USD Million) By Region (2021-2032)
Figure 27. Africa Invert Sugar Syrups Revenue (USD Million) By Region (2021-2032)
Figure 28. North America Invert Sugar Syrups Revenue (USD Million) By Type (2021-2032)
Figure 29. North America Invert Sugar Syrups Revenue (USD Million) By Application (2021-2032)
Figure 30. North America Invert Sugar Syrups Revenue (USD Million) By Product (2021-2032)
Figure 31. Europe Invert Sugar Syrups Revenue (USD Million) By Type (2021-2032)
Figure 32. Europe Invert Sugar Syrups Revenue (USD Million) By Application (2021-2032)
Figure 33. Europe Invert Sugar Syrups Revenue (USD Million) By Product (2021-2032)
Figure 34. Asia Pacific Invert Sugar Syrups Revenue (USD Million) By Type (2021-2032)
Figure 35. Asia Pacific Invert Sugar Syrups Revenue (USD Million) By Application (2021-2032)
Figure 36. Asia Pacific Invert Sugar Syrups Revenue (USD Million) By Product (2021-2032)
Figure 37. South America Invert Sugar Syrups Revenue (USD Million) By Type (2021-2032)
Figure 38. South America Invert Sugar Syrups Revenue (USD Million) By Application (2021-2032)
Figure 39. South America Invert Sugar Syrups Revenue (USD Million) By Product (2021-2032)
Figure 40. Middle East and Africa Invert Sugar Syrups Revenue (USD Million) By Type (2021-2032)
Figure 41. Middle East and Africa Invert Sugar Syrups Revenue (USD Million) By Application (2021-2032)
Figure 42. Middle East and Africa Invert Sugar Syrups Revenue (USD Million) By Product (2021-2032)
By Type
Organic
Conventional
By Application
Food Industry
Beverage Industry
Personal Care
Dietary Supplements
Pharmaceuticals
Others
Countries Analyzed
North America (US, Canada, Mexico)
Europe (Germany, UK, France, Spain, Italy, Russia, Rest of Europe)
Asia Pacific (China, India, Japan, South Korea, Australia, South East Asia, Rest of Asia)
South America (Brazil, Argentina, Rest of South America)
Middle East and Africa (Saudi Arabia, UAE, Rest of Middle East, South Africa, Egypt, Rest of Africa)
