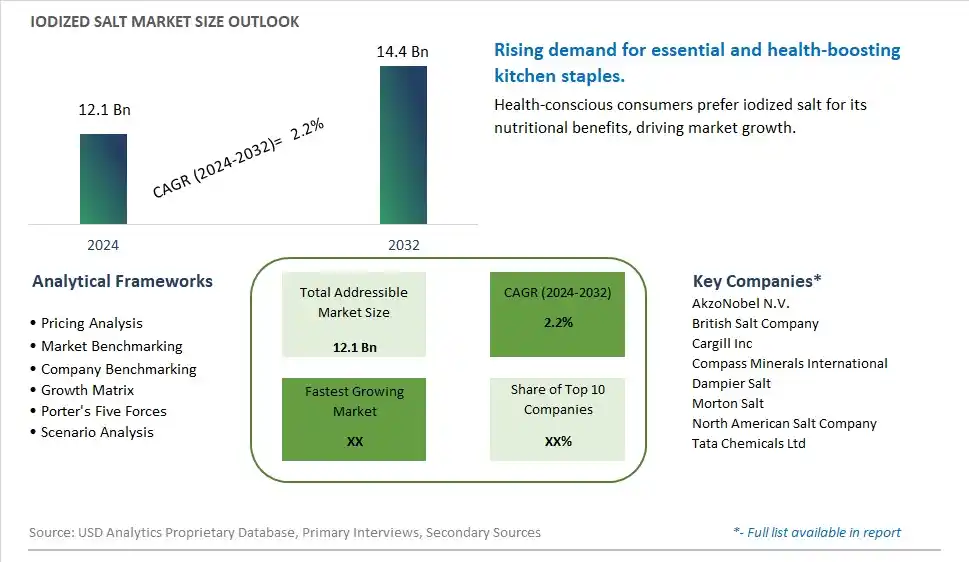
Global Iodized Salt Market Size is valued at $12.1 Billion in 2024 and is forecast to register a growth rate (CAGR) of 2.2% to reach $14.4 Billion by 2032.
The global Iodized Salt Market Comprehensive Study analyzes and forecasts the market size across 6 regions and 24 countries for diverse segments -By Type (Mineral Halite, Rock Salt), By Application (Food, Chemical, Industrial, Medical)
An Introduction to Iodized Salt Market
The iodized salt market in 2024 is expanding, fueled by growing health awareness and government initiatives to combat iodine deficiency disorders. Iodized salt, enriched with essential iodine, is crucial for preventing thyroid-related health issues and promoting overall wellness. The market is benefiting from increasing consumer demand for fortified foods and regulatory mandates in various countries to ensure adequate iodine intake. Innovations in salt packaging and distribution are making iodized salt more accessible to remote and underserved populations. Additionally, the trend towards natural and unrefined salts with added health benefits is gaining traction in the market.
Iodized Salt Competitive Landscape
The market report analyses the leading companies in the industry including AkzoNobel N.V., British Salt Company, Cargill Inc, Compass Minerals International, Dampier Salt, Morton Salt, North American Salt Company, Tata Chemicals Ltd, and Others.
Iodized Salt Market Dynamics
Iodized Salt Market Trend: Increasing Focus on Nutritional Fortification
The most prominent trend in the Iodized Salt Market is the increasing focus on nutritional fortification to address iodine deficiency. Iodized salt, which is fortified with iodine, is widely recognized as an effective solution to prevent iodine deficiency disorders (IDDs). This trend is driven by public health initiatives and growing awareness of the importance of iodine in maintaining thyroid function and overall health.
Iodized Salt Market Driver: Government Initiatives and Public Health Campaigns
A key driver in the Iodized Salt Market is the strong support from government initiatives and public health campaigns aimed at combating iodine deficiency. Many countries have implemented mandatory iodization programs, promoting the use of iodized salt to improve public health outcomes. These efforts are supported by international organizations such as the World Health Organization (WHO), which advocate for universal salt iodization to eradicate IDDs globally.
Iodized Salt Market Opportunity: Expansion in Emerging Markets
One significant opportunity in the Iodized Salt Market lies in the expansion in emerging markets, where iodine deficiency remains prevalent. Companies can capitalize on this opportunity by increasing production and distribution of iodized salt in these regions, supported by educational campaigns to raise awareness about the health benefits of iodized salt. Additionally, partnerships with local governments and health organizations can enhance market penetration and drive growth.
Iodized Salt Market Share Analysis: Mineral Halite segment generated the highest revenue share in the industry
Mineral Halite stands as the largest segment within the Iodized Salt Market. This type of iodized salt, sourced primarily from underground salt deposits, is widely recognized for its high purity and consistency in iodine content, essential for preventing iodine deficiency disorders (IDDs) globally. Mineral Halite undergoes a rigorous iodization process where potassium iodate or potassium iodide is added to ensure adequate iodine levels, crucial for thyroid function and overall health. Its widespread use in households, food processing, and catering industries stems from its affordability, reliability, and regulatory compliance with iodine fortification standards mandated by health authorities worldwide. As public health initiatives and nutritional awareness campaigns continue to emphasize the importance of iodine supplementation through everyday foods like iodized salt, the Mineral Halite segment remains pivotal in addressing iodine deficiency and promoting public health across diverse populations and geographic regions.
Iodized Salt Market Share Analysis: Medical is the fastest growing segment over the forecast period to 2032
The medical segment emerges as the fastest-growing segment within the Iodized Salt Market through 2032. This growth is driven by the increasing recognition of iodized salt's role in healthcare settings, particularly in iodine supplementation programs and treatments for iodine deficiency disorders (IDDs). Medical-grade iodized salt is crucial for ensuring adequate iodine intake among patients with thyroid conditions, pregnant women, and populations at risk of iodine deficiency. Healthcare institutions and pharmaceutical companies utilize iodized salt in formulations for iodine supplements and medications aimed at managing thyroid disorders and supporting overall thyroid health. The rising prevalence of thyroid-related health issues globally, coupled with ongoing public health initiatives to combat IDD through iodine fortification programs, fuels the demand for medical-grade iodized salt. Further, advancements in salt iodization technologies and quality assurance practices ensure that medical-grade iodized salt meets stringent regulatory standards and pharmaceutical requirements, further bolstering its market growth and significance in healthcare applications. As healthcare systems prioritize preventive care and nutritional interventions, the medical segment of the iodized salt market is expected to expand significantly, supporting improved public health outcomes worldwide.
Iodized Salt Market Segmentation
By Type
Mineral Halite
Rock Salt
By Application
Food
Chemical
Industrial
Medical
Countries Analyzed
North America (US, Canada, Mexico)
Europe (Germany, UK, France, Spain, Italy, Russia, Rest of Europe)
Asia Pacific (China, India, Japan, South Korea, Australia, South East Asia, Rest of Asia)
South America (Brazil, Argentina, Rest of South America)
Middle East and Africa (Saudi Arabia, UAE, Rest of Middle East, South Africa, Egypt, Rest of Africa)
Iodized Salt Companies Profiled in the Study
AkzoNobel N.V.
British Salt Company
Cargill Inc
Compass Minerals International
Dampier Salt
Morton Salt
North American Salt Company
Tata Chemicals Ltd
*- List Not Exhaustive
Chapter 1. TABLE OF CONTENTS
Chapter 2. Introduction to Iodized Salt Market
2.1. Market Overview
2.2. Key Statistics and Report Highlights
2.3. Scope of the Comprehensive Study
2.3.1. Market Definition
2.3.2 Countries and Regions Covered
2.3.3 Research Objective
2.3.4 Units, Currency, and Conversions
2.3.5 Industry Value Chain
2.4. Key Market Segments
2.5. Key Companies
2.6. Study Period
Chapter 3. Strategic Analysis Review
3.1. Iodized Salt Pricing Analysis and Forecast
3.2. Porter’s Five Forces
3.3. Market Ecosystem
3.4. SWOT Analysis
3.5. Regulatory Scenario
3.3. Effects of Inflation, Russia-Ukraine War, moderating economic growth, and other macroeconomic factors
Chapter 4. Competitive Landscape
4.1. Market Share Analysis
4.1.1. Global Iodized Salt Market Share by Company, 2023
4.1.2. Product Offerings of Leading Iodized Salt Companies
4.2. Market Entropy
4.2.1. New Product Launches in the Industry
4.2.2. Mergers, Acquisitions, Joint ventures, and Partnerships
4.3. Key Strategies and Best Practices
Chapter 5. Global Market Projections: Best, Reference, and Low Case Scenarios
5.1. Growth Analysis- Case Scenario Definitions
5.2. Low Growth Case Scenario Forecasts
5.3. Reference Growth Case Scenario Forecasts
5.4. High Growth Case Scenario Forecasts
Chapter 6. Market Dynamics
6.1. Iodized Salt Market Drivers
6.2. Iodized Salt Market Challenges
6.6. Iodized Salt Market Opportunities
6.4. Iodized Salt Market Trends
Chapter 7. Global Iodized Salt Market Outlook Trends
7.1. Global Iodized Salt Revenue (USD Million) and CAGR (%) by Type (2021-2032)
7.2. Global Iodized Salt Revenue (USD Million) and CAGR (%) by Application (2021-2032)
7.3. Global Iodized Salt Revenue (USD Million) and CAGR (%) by Product (2021-2032)
By Type
Mineral Halite
Rock Salt
By Application
Food
Chemical
Industrial
Medical
Chapter 8. Global Iodized Salt Regional Analysis and Outlook
8.1. Global Iodized Salt Revenue (USD Million) By Regions (2021- 2032)
8.2. North America Iodized Salt Revenue (USD Million) by Country (2021-2032)
8.2.1. United States Iodized Salt Regional Analysis and Outlook
8.2.2. Canada Iodized Salt Regional Analysis and Outlook
8.2.3. Mexico Iodized Salt Regional Analysis and Outlook
8.3. Europe Iodized Salt Revenue (USD Million), by Country (2021-2032)
8.3.1. Germany Iodized Salt Regional Analysis and Outlook
8.3.2. France Iodized Salt Regional Analysis and Outlook
8.3.3. United Kingdom Iodized Salt Regional Analysis and Outlook
8.3.4. Spain Iodized Salt Regional Analysis and Outlook
8.3.5. Italy Iodized Salt Regional Analysis and Outlook
8.3.6. Russia Iodized Salt Regional Analysis and Outlook
8.3.7. Rest of Europe Iodized Salt Regional Analysis and Outlook
8.4. Asia Pacific Iodized Salt Revenue (USD Million) by Country (2021-2032)
8.4.1. China Iodized Salt Regional Analysis and Outlook
8.4.2. Japan Iodized Salt Regional Analysis and Outlook
8.4.3. India Iodized Salt Regional Analysis and Outlook
8.4.4. South Korea Iodized Salt Regional Analysis and Outlook
8.4.5. Australia Iodized Salt Regional Analysis and Outlook
8.4.6. South East Asia Iodized Salt Regional Analysis and Outlook
8.4.7. Rest of Asia Pacific Iodized Salt Regional Analysis and Outlook
8.5. South America Iodized Salt Revenue (USD Million), by Country (2021-2032)
8.5.1. Brazil Iodized Salt Regional Analysis and Outlook
8.5.2. Argentina Iodized Salt Regional Analysis and Outlook
8.5.3. Rest of South America Iodized Salt Regional Analysis and Outlook
8.6. Middle East and Africa Iodized Salt Revenue (USD Million) by Country (2021-2032)
8.6.1. Middle East Iodized Salt Regional Analysis and Outlook
8.6.2. Africa Iodized Salt Regional Analysis and Outlook
Chapter 9. North America Iodized Salt Analysis and Outlook
9.1. North America Iodized Salt Revenue (USD Million) by Segments (2021-2032)
9.1.1. North America Iodized Salt Revenue (USD Million) by Type (2021-2032)
9.1.2. North America Iodized Salt Revenue (USD Million) by Application (2021-2032)
9.1.3. North America Iodized Salt Revenue (USD Million) by Product (2021-2032)
By Type
Mineral Halite
Rock Salt
By Application
Food
Chemical
Industrial
Medical
Chapter 10. Europe Iodized Salt Analysis and Outlook
10.1. Europe Iodized Salt Revenue (USD Million), by Segments (USD Million) (2021-2032)
10.1.1. Europe Iodized Salt Revenue (USD Million) by Type (2021-2032)
10.1.2. Europe Iodized Salt Revenue (USD Million) by Application (2021-2032)
10.1.3. Europe Iodized Salt Revenue (USD Million) by Product (2021-2032)
By Type
Mineral Halite
Rock Salt
By Application
Food
Chemical
Industrial
Medical
Chapter 11. Asia Pacific Iodized Salt Analysis and Outlook
11.1. Asia Pacific Iodized Salt Revenue (USD Million), and Revenue (USD Million) by Segments (2021-2032)
11.1.1. Asia Pacific Iodized Salt Revenue (USD Million) by Type (2021-2032)
11.1.2. Asia Pacific Iodized Salt Revenue (USD Million) by Application (2021-2032)
11.1.3. Asia Pacific Iodized Salt Revenue (USD Million) by Product (2021-2032)
By Type
Mineral Halite
Rock Salt
By Application
Food
Chemical
Industrial
Medical
Chapter 12. South America Iodized Salt Analysis and Outlook
12.1. South America Iodized Salt Revenue (USD Million), by Segments (2021-2032)
12.1.1. South America Iodized Salt Revenue (USD Million) by Type (2021-2032)
12.1.2. South America Iodized Salt Revenue (USD Million) by Application (2021-2032)
12.1.3. South America Iodized Salt Revenue (USD Million) by Product (2021-2032)
By Type
Mineral Halite
Rock Salt
By Application
Food
Chemical
Industrial
Medical
Chapter 13. Middle East and Africa Iodized Salt Analysis and Outlook
13.1. Middle East and Africa Iodized Salt Revenue (USD Million), by Segments (2021-2032)
13.1.1. Middle East and Africa Iodized Salt Revenue (USD Million) by Type (2021-2032)
13.1.2. Middle East and Africa Iodized Salt Revenue (USD Million) by Application (2021-2032)
13.1.3. Middle East and Africa Iodized Salt Revenue (USD Million) by Product (2021-2032)
By Type
Mineral Halite
Rock Salt
By Application
Food
Chemical
Industrial
Medical
Chapter 14. Iodized Salt Company Profiles
14.1 Business Overview
14.2 Product Profiles
14.3 SWOT Profiles
14.5 Recent Developments
14.6 Financial Profile
List of Companies
AkzoNobel N.V.
British Salt Company
Cargill Inc
Compass Minerals International
Dampier Salt
Morton Salt
North American Salt Company
Tata Chemicals Ltd
15. Methodology and Data Sources
15.1 Customization Offerings
15.2 Subscription Services
15.3 Related Reports
15.4 Publisher Expertise
LIST OF TABLES
Table 1 Market Segmentation Analysis
Table 2 Global Iodized Salt Market Share of Leading Companies, 2023
Table 3 Product Offerings of Leading Companies
Table 4 Low Growth Scenario Forecasts
Table 5 Reference Case Growth Scenario
Table 6 High Growth Case Scenario
Table 7 Global Iodized Salt Revenue (USD Million) And CAGR (%) By Type (2021-2032)
Table 8 Global Iodized Salt Revenue (USD Million) And CAGR (%) By Application (2021-2032)
Table 9 Global Iodized Salt Revenue (USD Million) And CAGR (%) By Product (2021-2032)
Table 10 Global Iodized Salt Market Revenue (USD Million) By Regions (2021-2032)
Table 11 Global Iodized Salt Market Share (%) By Regions (2021-2032)
Table 12 North America Iodized Salt Revenue (USD Million) By Country (2021-2032)
Table 13 Europe Iodized Salt Revenue (USD Million) By Country (2021-2032)
Table 14 Asia Pacific Iodized Salt Revenue (USD Million) By Country (2021-2032)
Table 15 South America Iodized Salt Revenue (USD Million) By Country (2021-2032)
Table 16 Middle East and Africa Iodized Salt Revenue (USD Million) By Region (2021-2032)
Table 17 North America Iodized Salt Revenue (USD Million) By Type (2021-2032)
Table 18 North America Iodized Salt Revenue (USD Million) By Application (2021-2032)
Table 19 North America Iodized Salt Revenue (USD Million) By Product (2021-2032)
Table 20 Europe Iodized Salt Revenue (USD Million) By Type (2021-2032)
Table 21 Europe Iodized Salt Revenue (USD Million) By Application (2021-2032)
Table 22 Europe Iodized Salt Revenue (USD Million) By Product (2021-2032)
Table 23 Asia Pacific Iodized Salt Revenue (USD Million) By Type (2021-2032)
Table 24 Asia Pacific Iodized Salt Revenue (USD Million) By Application (2021-2032)
Table 25 Asia Pacific Iodized Salt Revenue (USD Million) By Product (2021-2032)
Table 26 South America Iodized Salt Revenue (USD Million) By Type (2021-2032)
Table 27 South America Iodized Salt Revenue (USD Million) By Application (2021-2032)
Table 28 South America Iodized Salt Revenue (USD Million) By Product (2021-2032)
Table 29 Middle East and Africa Iodized Salt Revenue (USD Million) By Type (2021-2032)
Table 30 Middle East and Africa Iodized Salt Revenue (USD Million) By Application (2021-2032)
Table 31 Middle East and Africa Iodized Salt Revenue (USD Million) By Product (2021-2032)
LIST OF FIGURES
Figure 1. Market Scope
Figure 2. Pricing Forecasts Per Unit, 2023- 2032
Figure 3. Porter’s Five Forces
Figure 4. Global Iodized Salt Market Revenue (USD Million) By Regions (2021-2032)
Figure 5. Global Iodized Salt Market Share (%) By Regions (2023)
Figure 6. North America Iodized Salt Revenue (USD Million) By Country (2021-2032)
Figure 7. United States Iodized Salt Revenue (USD Million) By Country (2021-2032)
Figure 8. Canada Iodized Salt Revenue (USD Million) By Country (2021-2032)
Figure 9. Mexico Iodized Salt Revenue (USD Million) By Country (2021-2032)
Figure 10. Europe Iodized Salt Revenue (USD Million) By Country (2021-2032)
Figure 11. Germany Iodized Salt Revenue (USD Million) By Country (2021-2032)
Figure 12. France Iodized Salt Revenue (USD Million) By Country (2021-2032)
Figure 13. United Kingdom Iodized Salt Revenue (USD Million) By Country (2021-2032)
Figure 14. Spain Iodized Salt Revenue (USD Million) By Country (2021-2032)
Figure 15. Italy Iodized Salt Revenue (USD Million) By Country (2021-2032)
Figure 16. Russia Iodized Salt Revenue (USD Million) By Country (2021-2032)
Figure 17. Rest of Europe Iodized Salt Revenue (USD Million) By Country (2021-2032)
Figure 11. Asia Pacific Iodized Salt Revenue (USD Million) By Country (2021-2032)
Figure 12. China Iodized Salt Revenue (USD Million) By Country (2021-2032)
Figure 13. Japan Iodized Salt Revenue (USD Million) By Country (2021-2032)
Figure 14. India Iodized Salt Revenue (USD Million) By Country (2021-2032)
Figure 15. South Korea Iodized Salt Revenue (USD Million) By Country (2021-2032)
Figure 16. Australia Iodized Salt Revenue (USD Million) By Country (2021-2032)
Figure 17. South East Asia Iodized Salt Revenue (USD Million) By Country (2021-2032)
Figure 18. South America Iodized Salt Revenue (USD Million) By Country (2021-2032)
Figure 19. Brazil Iodized Salt Revenue (USD Million) By Country (2021-2032)
Figure 20. Argentina Iodized Salt Revenue (USD Million) By Country (2021-2032)
Figure 21. Rest of Asia Pacific Iodized Salt Revenue (USD Million) By Country (2021-2032)
Figure 22. Middle East and Africa Iodized Salt Revenue (USD Million) By Region (2021-2032)
Figure 23. Saudi Arabia Iodized Salt Revenue (USD Million) By Region (2021-2032)
Figure 24. The UAE Iodized Salt Revenue (USD Million) By Region (2021-2032)
Figure 25. Rest of Middle East Iodized Salt Revenue (USD Million) By Region (2021-2032)
Figure 26. South Africa Iodized Salt Revenue (USD Million) By Region (2021-2032)
Figure 27. Africa Iodized Salt Revenue (USD Million) By Region (2021-2032)
Figure 28. North America Iodized Salt Revenue (USD Million) By Type (2021-2032)
Figure 29. North America Iodized Salt Revenue (USD Million) By Application (2021-2032)
Figure 30. North America Iodized Salt Revenue (USD Million) By Product (2021-2032)
Figure 31. Europe Iodized Salt Revenue (USD Million) By Type (2021-2032)
Figure 32. Europe Iodized Salt Revenue (USD Million) By Application (2021-2032)
Figure 33. Europe Iodized Salt Revenue (USD Million) By Product (2021-2032)
Figure 34. Asia Pacific Iodized Salt Revenue (USD Million) By Type (2021-2032)
Figure 35. Asia Pacific Iodized Salt Revenue (USD Million) By Application (2021-2032)
Figure 36. Asia Pacific Iodized Salt Revenue (USD Million) By Product (2021-2032)
Figure 37. South America Iodized Salt Revenue (USD Million) By Type (2021-2032)
Figure 38. South America Iodized Salt Revenue (USD Million) By Application (2021-2032)
Figure 39. South America Iodized Salt Revenue (USD Million) By Product (2021-2032)
Figure 40. Middle East and Africa Iodized Salt Revenue (USD Million) By Type (2021-2032)
Figure 41. Middle East and Africa Iodized Salt Revenue (USD Million) By Application (2021-2032)
Figure 42. Middle East and Africa Iodized Salt Revenue (USD Million) By Product (2021-2032)
By Type
Mineral Halite
Rock Salt
By Application
Food
Chemical
Industrial
Medical
Countries Analyzed
North America (US, Canada, Mexico)
Europe (Germany, UK, France, Spain, Italy, Russia, Rest of Europe)
Asia Pacific (China, India, Japan, South Korea, Australia, South East Asia, Rest of Asia)
South America (Brazil, Argentina, Rest of South America)
Middle East and Africa (Saudi Arabia, UAE, Rest of Middle East, South Africa, Egypt, Rest of Africa)
