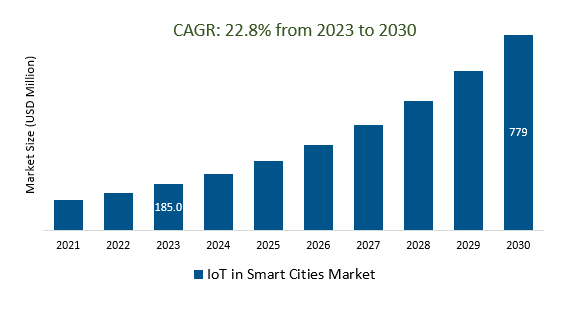
The Global IoT in Smart Cities Market Size is estimated to be US$ 185.0 Billion in 2023. It is poised to register 22.8% growth over the forecast period from 2023 to 2030 to reach US $ 779.0 billion in 2030.
The market growth is driven by the increasing global trend towards urbanization is driving the need for smart city solutions to manage growing populations, resources, and infrastructure efficiently. Leading companies focusing on Increased Urbanization, AI and Machine Learning Integration, IoT in Healthcare, IoT in Public Transport, Economic Growth, and others to boost market shares in the industry.
Market Overview
The IoT in the Smart Cities market involves the integration of sensors, devices, connectivity, data analytics, and applications to improve urban efficiency, sustainability, and quality of life. It's driven by urbanization, government initiatives, and the need for sustainability and cost savings. Challenges include security, infrastructure, interoperability, and regulatory compliance. Major players like IBM, Cisco, and Microsoft are active in the market, alongside startups and innovative firms. The market is poised for substantial growth as cities worldwide seek IoT solutions to address urban challenges and enhance urban living.
Market Dynamics
Market Trends- Companies are launching IoT in Healthcare to attract a consumer base
IoT in Healthcare within the Smart Cities market involves the integration of IoT technologies to enable remote patient monitoring, telemedicine, data analytics, and improved healthcare efficiency. It enhances healthcare accessibility and quality, supports chronic disease management, aids in public health surveillance, and ensures data security and privacy compliance. IoT in Healthcare is a critical component of smart city initiatives, contributing to better healthcare delivery, reduced hospital admissions, and enhanced public health outcomes.
Market Driver- IoT in Transportation demand for efficient Public Affairs and Advocacy Platform Market
IoT in Transportation, a vital component of the Smart Cities market, leverages IoT technologies to optimize urban mobility by improving traffic management, enabling connected vehicles, facilitating public transportation efficiency, and enhancing safety. It also supports eco-friendly transportation options, such as electric vehicles and bike-sharing, and contributes to data-driven decision-making for urban planning. Overall, IoT in Transportation addresses congestion boosts accessibility, and promotes sustainability in smart city transportation systems.
Market Opportunity-Introduction of IoT in Agriculture
IoT in Agriculture, integral to the Smart Cities market, utilizes IoT technology to optimize urban farming, including precision farming, smart irrigation, and vertical farming, enabling efficient resource management, crop monitoring, and livestock care. It fosters sustainability, food security, and community engagement in urban agriculture, contributing to localized food production and environmental stewardship within smart cities.
Market Share Analysis- Solutions IoT in Smart Cities Market will register the fastest growth
The Global IoT in the Smart Cities Market is analyzed across Solutions, Services, and others. Of these, solutions register the fastest growth. The IoT in the Smart Cities market offers a spectrum of solutions utilizing Internet of Things (IoT) technology to tackle urban challenges and enhance urban living. These solutions span smart transportation, energy management, environmental monitoring, public safety, healthcare, building automation, waste management, digital twins, public services, agriculture, street lighting, water management, edge computing, education, and economic development. Each solution leverages IoT to optimize resource usage, improve services, and create more sustainable, efficient, and interconnected urban environments. These innovations are fundamental in addressing the demands of urbanization and ensuring a better quality of life within smart cities.
Market Share Analysis- Smart Transportation held a significant market share in 2023
The Global IoT in Smart Cities Market is analyzed across a wide range of applications including Smart Transportation, Smart Buildings, Smart Utilities, and others. Of these, Smart Transportation held a significant market share in 2023. Smart Transportation is a crucial component of the IoT in the Smart Cities market, leveraging Internet of Things (IoT) technologies to optimize urban mobility. This includes real-time traffic management, public transportation enhancements, connected vehicles, smart parking solutions, and a focus on environmental sustainability. IoT-driven data analytics aid in decision-making, while safety, accessibility, and reduced traffic congestion are among the key benefits, making urban transportation more efficient, safe, and eco-friendly within smart cities.
IoT in Smart Cities Market Segmentation
By Offering
- Solutions (Remote Monitoring, Network Management, and Reporting and Analytics)
- Services
By Application
- Smart Transportation
- Smart Building
- Smart Utilities
- Smart Citizen Services
By Region
- North America (United States, Canada, Mexico)
- Europe (Germany, France, United Kingdom, Spain, Italy, Others)
- Asia Pacific (China, India, Japan, South Korea, Australia, Others)
- Latin America (Brazil, Argentina, Others)
- Middle East and Africa (Saudi Arabia, UAE, Kuwait, Other Middle East, South Africa, Nigeria, Other Africa)
IoT in Smart Cities Market Companies
- Cisco Systems Inc
- IBM Corporation
- Schneider Electric
- Intel Corporation
- Siemens AG
- Microsoft Corporation
- Robert Bosch GmbH
- Huawei Technologies Co. Ltd
- Verizon Communications
- Hitachi Ltd
- Arm Ltd
- PTC
- Sierra Wireless
- Honeywell International Inc
- SAP SE
- Enevo Inc
- Deutsche Telekom AG
- AGT Group GmbH
- Optibus Ltd.
- FlamencoTech Technology Solutions Pvt Ltd
- Signify Ltd
- Tech Mahindra Ltd
- Takadu Ltd
* List not exhaustive
IoT in Smart Cities Market Outlook 2023
1 Market Overview
1.1 Introduction to the IoT in Smart Cities Market
1.2 Scope of the Study
1.3 Research Objective
1.3.1 Key Market Scope and Segments
1.3.2 Players Covered
1.3.3 Years Considered
2 Executive Summary
2.1 2023 IoT in Smart Cities Industry- Market Statistics
3 Market Dynamics
3.1 Market Drivers
3.2 Market Challenges
3.3 Market Opportunities
3.4 Market Trends
4 Market Factor Analysis
4.1 Porter’s Five Forces
4.2 Market Entropy
4.2.1 Global IoT in Smart Cities Market Companies with Area Served
4.2.2 Products Offerings Global IoT in Smart Cities Market
5 COVID-19 Impact Analysis and Outlook Scenarios
5.1.1 Covid-19 Impact Analysis
5.1.2 Post-COVID-19 Scenario- Low Growth Case
5.1.3 Post-COVID-19 Scenario- Reference Growth Case
5.1.4 Post-COVID-19 Scenario- Low Growth Case
6 Global IoT in Smart Cities Market Trends
6.1 Global IoT in Smart Cities Revenue (USD Million) and CAGR (%) by Type (2018-2030)
6.2 Global IoT in Smart Cities Revenue (USD Million) and CAGR (%) by Applications (2018-2030)
6.3 Global IoT in Smart Cities Revenue (USD Million) and CAGR (%) by Regions (2018-2030)
7 Global IoT in Smart Cities Market Revenue (USD Million) by Type, and Applications (2018-2022)
7.1 Global IoT in Smart Cities Revenue (USD Million) by Type (2018-2022)
7.1.1 Global IoT in Smart Cities Revenue (USD Million), Market Share (%) by Type (2018-2022)
7.2 Global IoT in Smart Cities Revenue (USD Million) by Applications (2018-2022)
7.2.1 Global IoT in Smart Cities Revenue (USD Million), Market Share (%) by Applications (2018-2022)
8 Global IoT in Smart Cities Development Regional Status and Outlook
8.1 Global IoT in Smart Cities Revenue (USD Million) By Regions (2018-2022)
8.2 North America IoT in Smart Cities Revenue (USD Million) by Type, and Application (2018-2022)
8.2.1 North America IoT in Smart Cities Revenue (USD Million) by Country (2018-2022)
8.2.2 North America IoT in Smart Cities Revenue (USD Million) by Type (2018-2022)
8.2.3 North America IoT in Smart Cities Revenue (USD Million) by Applications (2018-2022)
8.3 Europe IoT in Smart Cities Revenue (USD Million), by Type, and Applications (USD Million) (2018-2022)
8.3.1 Europe IoT in Smart Cities Revenue (USD Million), by Country (2018-2022)
8.3.2 Europe IoT in Smart Cities Revenue (USD Million) by Type (2018-2022)
8.3.3 Europe IoT in Smart Cities Revenue (USD Million) by Applications (2018-2022)
8.4 Asia Pacific IoT in Smart Cities Revenue (USD Million), and Revenue (USD Million) by Type, and Applications (2018-2022)
8.4.1 Asia Pacific IoT in Smart Cities Revenue (USD Million) by Country (2018-2022)
8.4.2 Asia Pacific IoT in Smart Cities Revenue (USD Million) by Type (2018-2022)
8.4.3 Asia Pacific IoT in Smart Cities Revenue (USD Million) by Applications (2018-2022)
8.5 South America IoT in Smart Cities Revenue (USD Million), by Type, and Applications (2018-2022)
8.5.1 South America IoT in Smart Cities Revenue (USD Million), by Country (2018-2022)
8.5.2 South America IoT in Smart Cities Revenue (USD Million) by Type (2018-2022)
8.5.3 South America IoT in Smart Cities Revenue (USD Million) by Applications (2018-2022)
8.6 Middle East and Africa IoT in Smart Cities Revenue (USD Million), by Type, Technology, Application, Thickness (2018-2022)
8.6.1 Middle East and Africa IoT in Smart Cities Revenue (USD Million) by Country (2018-2022)
8.6.2 Middle East and Africa IoT in Smart Cities Revenue (USD Million) by Type (2018-2022)
8.6.3 Middle East and Africa IoT in Smart Cities Revenue (USD Million) by Applications (2018-2022)
9 Company Profiles
10 Global IoT in Smart Cities Market Revenue (USD Million), by Type, and Applications (2023-2030)
10.1 Global IoT in Smart Cities Revenue (USD Million) and Market Share (%) by Type (2023-2030)
10.1.1 Global IoT in Smart Cities Revenue (USD Million), and Market Share (%) by Type (2023-2030)
10.2 Global IoT in Smart Cities Revenue (USD Million) and Market Share (%) by Applications (2023-2030)
10.2.1 Global IoT in Smart Cities Revenue (USD Million), and Market Share (%) by Applications (2023-2030)
11 Global IoT in Smart Cities Development Regional Status and Outlook Forecast
11.1 Global IoT in Smart Cities Revenue (USD Million) By Regions (2023-2030)
11.2 North America IoT in Smart Cities Revenue (USD Million) by Type, and Applications (2023-2030)
11.2.1 North America IoT in Smart Cities Revenue (USD) Million by Country (2023-2030)
11.2.2 North America IoT in Smart Cities Revenue (USD Million), by Type (2023-2030)
11.2.3 North America IoT in Smart Cities Revenue (USD Million), Market Share (%) by Applications (2023-2030)
11.3 Europe IoT in Smart Cities Revenue (USD Million), by Type, and Applications (2023-2030)
11.3.1 Europe IoT in Smart Cities Revenue (USD Million), by Country (2023-2030)
11.3.2 Europe IoT in Smart Cities Revenue (USD Million), by Type (2023-2030)
11.3.3 Europe IoT in Smart Cities Revenue (USD Million), by Applications (2023-2030)
11.4 Asia Pacific IoT in Smart Cities Revenue (USD Million) by Type, and Applications (2023-2030)
11.4.1 Asia Pacific IoT in Smart Cities Revenue (USD Million), by Country (2023-2030)
11.4.2 Asia Pacific IoT in Smart Cities Revenue (USD Million), by Type (2023-2030)
11.4.3 Asia Pacific IoT in Smart Cities Revenue (USD Million), by Applications (2023-2030)
11.5 South America IoT in Smart Cities Revenue (USD Million), by Type, and Applications (2023-2030)
11.5.1 South America IoT in Smart Cities Revenue (USD Million), by Country (2023-2030)
11.5.2 South America IoT in Smart Cities Revenue (USD Million), by Type (2023-2030)
11.5.3 South America IoT in Smart Cities Revenue (USD Million), by Applications (2023-2030)
11.6 Middle East and Africa IoT in Smart Cities Revenue (USD Million), by Type, and Applications (2023-2030)
11.6.1 Middle East and Africa IoT in Smart Cities Revenue (USD Million), by Region (2023-2030)
11.6.2 Middle East and Africa IoT in Smart Cities Revenue (USD Million), by Type (2023-2030)
11.6.3 Middle East and Africa IoT in Smart Cities Revenue (USD Million), by Applications (2023-2030)
12 Methodology and Data Sources
12.1 Methodology/Research Approach
12.1.1 Research Programs/Design
12.1.2 Market Size Estimation
12.1.3 Market Breakdown and Data Triangulation
12.2 Data Sources
12.2.1 Secondary Sources
12.2.2 Primary Sources
12.3 Disclaimer
List of Tables
Table 1 Market Segmentation Analysis
Table 2 Global IoT in Smart Cities Market Companies with Areas Served
Table 3 Products Offerings Global IoT in Smart Cities Market
Table 4 Low Growth Scenario Forecasts
Table 5 Reference Case Growth Scenario
Table 6 High Growth Case Scenario
Table 7 Global IoT in Smart Cities Revenue (USD Million) And CAGR (%) By Type (2018-2030)
Table 8 Global IoT in Smart Cities Revenue (USD Million) And CAGR (%) By Applications (2018-2030)
Table 9 Global IoT in Smart Cities Revenue (USD Million) And CAGR (%) By Regions (2018-2030)
Table 10 Global IoT in Smart Cities Revenue (USD Million) By Type (2018-2022)
Table 11 Global IoT in Smart Cities Revenue Market Share (%) By Type (2018-2022)
Table 12 Global IoT in Smart Cities Revenue (USD Million) By Applications (2018-2022)
Table 13 Global IoT in Smart Cities Revenue Market Share (%) By Applications (2018-2022)
Table 14 Global IoT in Smart Cities Market Revenue (USD Million) By Regions (2018-2022)
Table 15 Global IoT in Smart Cities Market Share (%) By Regions (2018-2022)
Table 16 North America IoT in Smart Cities Revenue (USD Million) By Country (2018-2022)
Table 17 North America IoT in Smart Cities Revenue (USD Million) By Type (2018-2022)
Table 18 North America IoT in Smart Cities Revenue (USD Million) By Applications (2018-2022)
Table 19 Europe IoT in Smart Cities Revenue (USD Million) By Country (2018-2022)
Table 20 Europe IoT in Smart Cities Revenue (USD Million) By Type (2018-2022)
Table 21 Europe IoT in Smart Cities Revenue (USD Million) By Applications (2018-2022)
Table 22 Asia Pacific IoT in Smart Cities Revenue (USD Million) By Country (2018-2022)
Table 23 Asia Pacific IoT in Smart Cities Revenue (USD Million) By Type (2018-2022)
Table 24 Asia Pacific IoT in Smart Cities Revenue (USD Million) By Applications (2018-2022)
Table 25 South America IoT in Smart Cities Revenue (USD Million) By Country (2018-2022)
Table 26 South America IoT in Smart Cities Revenue (USD Million) By Type (2018-2022)
Table 27 South America IoT in Smart Cities Revenue (USD Million) By Applications (2018-2022)
Table 28 Middle East and Africa IoT in Smart Cities Revenue (USD Million) By Region (2018-2022)
Table 29 Middle East and Africa IoT in Smart Cities Revenue (USD Million) By Type (2018-2022)
Table 30 Middle East and Africa IoT in Smart Cities Revenue (USD Million) By Applications (2018-2022)
Table 31 Financial Analysis
Table 32 Global IoT in Smart Cities Revenue (USD Million) By Type (2023-2030)
Table 33 Global IoT in Smart Cities Revenue Market Share (%) By Type (2023-2030)
Table 34 Global IoT in Smart Cities Revenue (USD Million) By Applications (2023-2030)
Table 35 Global IoT in Smart Cities Revenue Market Share (%) By Applications (2023-2030)
Table 36 Global IoT in Smart Cities Market Revenue (USD Million), And Revenue (USD Million) By Regions (2023-2030)
Table 37 North America IoT in Smart Cities Revenue (USD)By Country (2023-2030)
Table 38 North America IoT in Smart Cities Revenue (USD Million) By Type (2023-2030)
Table 39 North America IoT in Smart Cities Revenue (USD Million) By Applications (2023-2030)
Table 40 Europe IoT in Smart Cities Revenue (USD Million) By Country (2023-2030)
Table 41 Europe IoT in Smart Cities Revenue (USD Million) By Type (2023-2030)
Table 42 Europe IoT in Smart Cities Revenue (USD Million) By Applications (2023-2030)
Table 43 Asia Pacific IoT in Smart Cities Revenue (USD Million) By Country (2023-2030)
Table 44 Asia Pacific IoT in Smart Cities Revenue (USD Million) By Type (2023-2030)
Table 45 Asia Pacific IoT in Smart Cities Revenue (USD Million) By Applications (2023-2030)
Table 46 South America IoT in Smart Cities Revenue (USD Million) By Country (2023-2030)
Table 47 South America IoT in Smart Cities Revenue (USD Million) By Type (2023-2030)
Table 48 South America IoT in Smart Cities Revenue (USD Million) By Applications (2023-2030)
Table 49 Middle East and Africa IoT in Smart Cities Revenue (USD Million) By Region (2023-2030)
Table 50 Middle East and Africa IoT in Smart Cities Revenue (USD Million) By Region (2023-2030)
Table 51 Middle East and Africa IoT in Smart Cities Revenue (USD Million) By Type (2023-2030)
Table 52 Middle East and Africa IoT in Smart Cities Revenue (USD Million) By Applications (2023-2030)
Table 53 Research Programs/Design for This Report
Table 54 Key Data Information from Secondary Sources
Table 55 Key Data Information from Primary Sources
List of Figures
Figure 1 Market Scope
Figure 2 Porter’s Five Forces
Figure 3 Global IoT in Smart Cities Revenue (USD Million) By Type (2018-2022)
Figure 4 Global IoT in Smart Cities Revenue Market Share (%) By Type (2022)
Figure 5 Global IoT in Smart Cities Revenue (USD Million) By Applications (2018-2022)
Figure 6 Global IoT in Smart Cities Revenue Market Share (%) By Applications (2022)
Figure 7 Global IoT in Smart Cities Market Revenue (USD Million) By Regions (2018-2022)
Figure 8 Global IoT in Smart Cities Market Share (%) By Regions (2022)
Figure 9 North America IoT in Smart Cities Revenue (USD Million) By Country (2018-2022)
Figure 10 North America IoT in Smart Cities Revenue (USD Million) By Type (2018-2022)
Figure 11 North America IoT in Smart Cities Revenue (USD Million) By Applications (2018-2022)
Figure 12 Europe IoT in Smart Cities Revenue (USD Million) By Country (2018-2022)
Figure 13 Europe IoT in Smart Cities Revenue (USD Million) By Type (2018-2022)
Figure 14 Europe IoT in Smart Cities Revenue (USD Million) By Applications (2018-2022)
Figure 15 Asia Pacific IoT in Smart Cities Revenue (USD Million) By Country (2018-2022)
Figure 16 Asia Pacific IoT in Smart Cities Revenue (USD Million) By Type (2018-2022)
Figure 17 Asia Pacific IoT in Smart Cities Revenue (USD Million) By Applications (2018-2022)
Figure 18 South America IoT in Smart Cities Revenue (USD Million) By Country (2018-2022)
Figure 19 South America IoT in Smart Cities Revenue (USD Million) By Type (2018-2022)
Figure 20 South America IoT in Smart Cities Revenue (USD Million) By Applications (2018-2022)
Figure 21 Middle East and Africa IoT in Smart Cities Revenue (USD Million) By Region (2018-2022)
Figure 22 Middle East and Africa IoT in Smart Cities Revenue (USD Million) By Type (2018-2022)
Figure 23 Middle East and Africa IoT in Smart Cities Revenue (USD Million) By Applications (2018-2022)
Figure 24 Global IoT in Smart Cities Revenue (USD Million) By Type (2023-2030)
Figure 25 Global IoT in Smart Cities Revenue Market Share (%) By Type (2030)
Figure 26 Global IoT in Smart Cities Revenue (USD Million) By Applications (2023-2030)
Figure 27 Global IoT in Smart Cities Revenue Market Share (%) By Applications (2030)
Figure 28 Global IoT in Smart Cities Market Revenue (USD Million) By Regions (2023-2030)
Figure 29 North America IoT in Smart Cities Revenue (USD Million) By Country (2023-2030)
Figure 30 North America IoT in Smart Cities Revenue (USD Million) By Type (2023-2030)
Figure 31 North America IoT in Smart Cities Revenue (USD Million) By Applications (2023-2030)
Figure 32 Europe IoT in Smart Cities Revenue (USD Million) By Country (2023-2030)
Figure 33 Europe IoT in Smart Cities Revenue (USD Million) By Type (2023-2030)
Figure 34 Europe IoT in Smart Cities Revenue (USD Million) By Applications (2023-2030)
Figure 35 Asia Pacific IoT in Smart Cities Revenue (USD Million) By Country (2023-2030)
Figure 36 Asia Pacific IoT in Smart Cities Revenue (USD Million) By Type (2023-2030)
Figure 37 Asia Pacific IoT in Smart Cities Revenue (USD Million) By Applications (2023-2030)
Figure 38 South America IoT in Smart Cities Revenue (USD Million) By Country (2023-2030)
Figure 39 South America IoT in Smart Cities Revenue (USD Million) By Type (2023-2030)
Figure 40 South America IoT in Smart Cities Revenue (USD Million) By Applications (2023-2030)
Figure 41 Middle East and Africa IoT in Smart Cities Revenue (USD Million) By Region (2023-2030)
Figure 42 Middle East and Africa IoT in Smart Cities Revenue (USD Million) By Region (2023-2030)
Figure 43 Middle East and Africa IoT in Smart Cities Revenue (USD Million) By Type (2023-2030)
Figure 44 Middle East and Africa IoT in Smart Cities Revenue (USD Million) By Applications (2023-2030)
Figure 45 Bottom-Up and Top-Down Approaches For This Report
Figure 46 Data Triangulation
