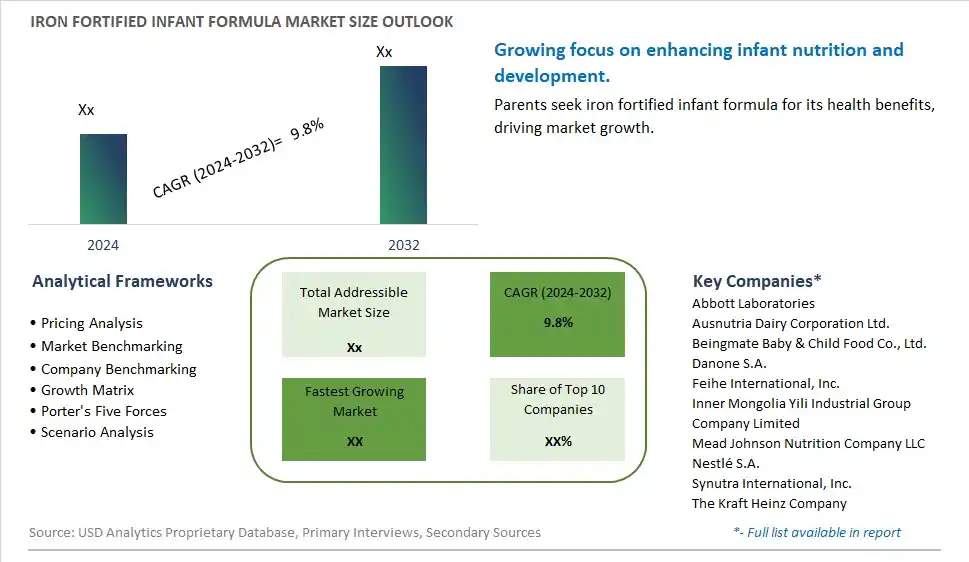
Global Iron Fortified Infant Formula Market Size is valued at $XX Million in 2024 and is forecast to register a growth rate (CAGR) of 9.8% to reach $XX Million by 2032.
The global Iron Fortified Infant Formula Market Comprehensive Study analyzes and forecasts the market size across 6 regions and 24 countries for diverse segments -By Type (Powder, Liquid), By Application (Supermarkets/Hypermarkets, Online Retail, Others)
An Introduction to Iron Fortified Infant Formula Market
In 2024, the iron fortified infant formula market is expanding rapidly, driven by the increasing awareness of the importance of iron in early childhood development. Iron fortified formulas are essential for preventing iron deficiency anemia and supporting cognitive and physical growth in infants. The market is benefiting from innovations in formula composition that enhance the bioavailability and absorption of iron. Regulatory support and recommendations from health organizations are further propelling demand for iron fortified infant formulas. The trend towards organic and non-GMO products is also gaining traction, catering to health-conscious parents.
Iron Fortified Infant Formula Competitive Landscape
The market report analyses the leading companies in the industry including Abbott Laboratories, Ausnutria Dairy Corporation Ltd., Beingmate Baby & Child Food Co., Ltd., Danone S.A., Feihe International, Inc., Inner Mongolia Yili Industrial Group Company Limited, Mead Johnson Nutrition Company LLC, Nestlé S.A., Synutra International, Inc., The Kraft Heinz Company, and Others.
Iron Fortified Infant Formula Market Dynamics
Iron Fortified Infant Formula Market Trend: Increasing Demand for Nutritionally Enhanced Infant Products
The most prominent trend in the Iron Fortified Infant Formula Market is the increasing demand for nutritionally enhanced infant products. Iron-fortified infant formula, which provides essential nutrients for infant growth and development, is becoming more popular as parents seek the best nutritional options for their babies. This trend is driven by growing awareness of the importance of early childhood nutrition and the role of iron in preventing anemia and supporting cognitive development.
Iron Fortified Infant Formula Market Driver: Rising Incidence of Iron Deficiency in Infants
A key driver in the Iron Fortified Infant Formula Market is the rising incidence of iron deficiency in infants. Iron deficiency is a common nutritional concern that can lead to developmental delays and other health issues. As parents become more aware of the risks associated with iron deficiency, the demand for iron-fortified infant formula increases. Healthcare recommendations and pediatric guidelines also support the use of iron-fortified formulas to ensure adequate iron intake in infants.
Iron Fortified Infant Formula Market Opportunity: Innovation in Formula Composition
One significant opportunity in the Iron Fortified Infant Formula Market lies in innovation in formula composition. Companies can develop new formulations that not only provide iron but also incorporate other essential nutrients and bioactive compounds that support overall infant health. By focusing on enhancing the nutritional profile and addressing specific health concerns, manufacturers can attract health-conscious parents and drive market growth.
Iron Fortified Infant Formula Market Share Analysis: Powder segment generated the highest revenue share in the industry
The powder segment dominates the Iron Fortified Infant Formula Market as the largest segment. Powdered infant formula fortified with iron is widely preferred by caregivers and parents globally due to its convenience, longer shelf life, and ease of preparation. This segment is characterized by its stable form, which allows for easy storage and transportation, making it a practical choice for both retail shelves and online distribution channels. Powdered formulas provide essential nutrients, including iron, crucial for infants' growth and development, particularly to prevent iron deficiency anemia. The growth of the powder segment is fueled by increasing birth rates globally, rising awareness of infant nutrition, and the convenience it offers in feeding infants at home or on the go. Additionally, advancements in formulation technology ensure that powdered iron-fortified infant formulas meet stringent nutritional standards and are suitable for infants with specific dietary needs or sensitivities. As healthcare providers and nutritionists continue to advocate for iron supplementation in infant diets, the powder segment of the Iron Fortified Infant Formula Market is expected to maintain its dominance, supported by ongoing innovations in nutritional science and infant care products.
Iron Fortified Infant Formula Market Share Analysis: Online Retail is the fastest growing segment over the forecast period to 2032
The online retail segment emerges as the fastest-growing segment within the Iron Fortified Infant Formula Market through 2032. This growth is driven by the increasing trend of consumers purchasing infant formula products online, facilitated by the convenience, accessibility, and wider product selection offered by e-commerce platforms. Online retail platforms provide caregivers and parents with the convenience of browsing and purchasing iron-fortified infant formulas from the comfort of their homes, with options for doorstep delivery. This segment's rapid expansion is further propelled by advancements in digital technology, secure payment gateways, and efficient logistics networks that ensure timely and reliable delivery of infant nutrition products. Further, the Past few yearshas accelerated the shift towards online shopping for essential goods, including infant formulas, as consumers prioritize safety and convenience. As online retail continues to evolve and expand globally, supported by increasing internet penetration and smartphone usage, the online segment of the Iron Fortified Infant Formula Market is poised for significant growth. Manufacturers and retailers are leveraging digital platforms to reach a broader audience and provide personalized shopping experiences, thereby driving further adoption of iron-fortified infant formulas through online channels.
Iron Fortified Infant Formula Market Segmentation
By Type
Powder
Liquid
By Application
Supermarkets/Hypermarkets
Online Retail
Others
Countries Analyzed
North America (US, Canada, Mexico)
Europe (Germany, UK, France, Spain, Italy, Russia, Rest of Europe)
Asia Pacific (China, India, Japan, South Korea, Australia, South East Asia, Rest of Asia)
South America (Brazil, Argentina, Rest of South America)
Middle East and Africa (Saudi Arabia, UAE, Rest of Middle East, South Africa, Egypt, Rest of Africa)
Iron Fortified Infant Formula Companies Profiled in the Study
Abbott Laboratories
Ausnutria Dairy Corporation Ltd.
Beingmate Baby & Child Food Co., Ltd.
Danone S.A.
Feihe International, Inc.
Inner Mongolia Yili Industrial Group Company Limited
Mead Johnson Nutrition Company LLC
Nestlé S.A.
Synutra International, Inc.
The Kraft Heinz Company
*- List Not Exhaustive
Chapter 1. TABLE OF CONTENTS
Chapter 2. Introduction to Iron Fortified Infant Formula Market
2.1. Market Overview
2.2. Key Statistics and Report Highlights
2.3. Scope of the Comprehensive Study
2.3.1. Market Definition
2.3.2 Countries and Regions Covered
2.3.3 Research Objective
2.3.4 Units, Currency, and Conversions
2.3.5 Industry Value Chain
2.4. Key Market Segments
2.5. Key Companies
2.6. Study Period
Chapter 3. Strategic Analysis Review
3.1. Iron Fortified Infant Formula Pricing Analysis and Forecast
3.2. Porter’s Five Forces
3.3. Market Ecosystem
3.4. SWOT Analysis
3.5. Regulatory Scenario
3.3. Effects of Inflation, Russia-Ukraine War, moderating economic growth, and other macroeconomic factors
Chapter 4. Competitive Landscape
4.1. Market Share Analysis
4.1.1. Global Iron Fortified Infant Formula Market Share by Company, 2023
4.1.2. Product Offerings of Leading Iron Fortified Infant Formula Companies
4.2. Market Entropy
4.2.1. New Product Launches in the Industry
4.2.2. Mergers, Acquisitions, Joint ventures, and Partnerships
4.3. Key Strategies and Best Practices
Chapter 5. Global Market Projections: Best, Reference, and Low Case Scenarios
5.1. Growth Analysis- Case Scenario Definitions
5.2. Low Growth Case Scenario Forecasts
5.3. Reference Growth Case Scenario Forecasts
5.4. High Growth Case Scenario Forecasts
Chapter 6. Market Dynamics
6.1. Iron Fortified Infant Formula Market Drivers
6.2. Iron Fortified Infant Formula Market Challenges
6.6. Iron Fortified Infant Formula Market Opportunities
6.4. Iron Fortified Infant Formula Market Trends
Chapter 7. Global Iron Fortified Infant Formula Market Outlook Trends
7.1. Global Iron Fortified Infant Formula Revenue (USD Million) and CAGR (%) by Type (2021-2032)
7.2. Global Iron Fortified Infant Formula Revenue (USD Million) and CAGR (%) by Application (2021-2032)
7.3. Global Iron Fortified Infant Formula Revenue (USD Million) and CAGR (%) by Product (2021-2032)
By Type
Powder
Liquid
By Application
Supermarkets/Hypermarkets
Online Retail
Others
Chapter 8. Global Iron Fortified Infant Formula Regional Analysis and Outlook
8.1. Global Iron Fortified Infant Formula Revenue (USD Million) By Regions (2021- 2032)
8.2. North America Iron Fortified Infant Formula Revenue (USD Million) by Country (2021-2032)
8.2.1. United States Iron Fortified Infant Formula Regional Analysis and Outlook
8.2.2. Canada Iron Fortified Infant Formula Regional Analysis and Outlook
8.2.3. Mexico Iron Fortified Infant Formula Regional Analysis and Outlook
8.3. Europe Iron Fortified Infant Formula Revenue (USD Million), by Country (2021-2032)
8.3.1. Germany Iron Fortified Infant Formula Regional Analysis and Outlook
8.3.2. France Iron Fortified Infant Formula Regional Analysis and Outlook
8.3.3. United Kingdom Iron Fortified Infant Formula Regional Analysis and Outlook
8.3.4. Spain Iron Fortified Infant Formula Regional Analysis and Outlook
8.3.5. Italy Iron Fortified Infant Formula Regional Analysis and Outlook
8.3.6. Russia Iron Fortified Infant Formula Regional Analysis and Outlook
8.3.7. Rest of Europe Iron Fortified Infant Formula Regional Analysis and Outlook
8.4. Asia Pacific Iron Fortified Infant Formula Revenue (USD Million) by Country (2021-2032)
8.4.1. China Iron Fortified Infant Formula Regional Analysis and Outlook
8.4.2. Japan Iron Fortified Infant Formula Regional Analysis and Outlook
8.4.3. India Iron Fortified Infant Formula Regional Analysis and Outlook
8.4.4. South Korea Iron Fortified Infant Formula Regional Analysis and Outlook
8.4.5. Australia Iron Fortified Infant Formula Regional Analysis and Outlook
8.4.6. South East Asia Iron Fortified Infant Formula Regional Analysis and Outlook
8.4.7. Rest of Asia Pacific Iron Fortified Infant Formula Regional Analysis and Outlook
8.5. South America Iron Fortified Infant Formula Revenue (USD Million), by Country (2021-2032)
8.5.1. Brazil Iron Fortified Infant Formula Regional Analysis and Outlook
8.5.2. Argentina Iron Fortified Infant Formula Regional Analysis and Outlook
8.5.3. Rest of South America Iron Fortified Infant Formula Regional Analysis and Outlook
8.6. Middle East and Africa Iron Fortified Infant Formula Revenue (USD Million) by Country (2021-2032)
8.6.1. Middle East Iron Fortified Infant Formula Regional Analysis and Outlook
8.6.2. Africa Iron Fortified Infant Formula Regional Analysis and Outlook
Chapter 9. North America Iron Fortified Infant Formula Analysis and Outlook
9.1. North America Iron Fortified Infant Formula Revenue (USD Million) by Segments (2021-2032)
9.1.1. North America Iron Fortified Infant Formula Revenue (USD Million) by Type (2021-2032)
9.1.2. North America Iron Fortified Infant Formula Revenue (USD Million) by Application (2021-2032)
9.1.3. North America Iron Fortified Infant Formula Revenue (USD Million) by Product (2021-2032)
By Type
Powder
Liquid
By Application
Supermarkets/Hypermarkets
Online Retail
Others
Chapter 10. Europe Iron Fortified Infant Formula Analysis and Outlook
10.1. Europe Iron Fortified Infant Formula Revenue (USD Million), by Segments (USD Million) (2021-2032)
10.1.1. Europe Iron Fortified Infant Formula Revenue (USD Million) by Type (2021-2032)
10.1.2. Europe Iron Fortified Infant Formula Revenue (USD Million) by Application (2021-2032)
10.1.3. Europe Iron Fortified Infant Formula Revenue (USD Million) by Product (2021-2032)
By Type
Powder
Liquid
By Application
Supermarkets/Hypermarkets
Online Retail
Others
Chapter 11. Asia Pacific Iron Fortified Infant Formula Analysis and Outlook
11.1. Asia Pacific Iron Fortified Infant Formula Revenue (USD Million), and Revenue (USD Million) by Segments (2021-2032)
11.1.1. Asia Pacific Iron Fortified Infant Formula Revenue (USD Million) by Type (2021-2032)
11.1.2. Asia Pacific Iron Fortified Infant Formula Revenue (USD Million) by Application (2021-2032)
11.1.3. Asia Pacific Iron Fortified Infant Formula Revenue (USD Million) by Product (2021-2032)
By Type
Powder
Liquid
By Application
Supermarkets/Hypermarkets
Online Retail
Others
Chapter 12. South America Iron Fortified Infant Formula Analysis and Outlook
12.1. South America Iron Fortified Infant Formula Revenue (USD Million), by Segments (2021-2032)
12.1.1. South America Iron Fortified Infant Formula Revenue (USD Million) by Type (2021-2032)
12.1.2. South America Iron Fortified Infant Formula Revenue (USD Million) by Application (2021-2032)
12.1.3. South America Iron Fortified Infant Formula Revenue (USD Million) by Product (2021-2032)
By Type
Powder
Liquid
By Application
Supermarkets/Hypermarkets
Online Retail
Others
Chapter 13. Middle East and Africa Iron Fortified Infant Formula Analysis and Outlook
13.1. Middle East and Africa Iron Fortified Infant Formula Revenue (USD Million), by Segments (2021-2032)
13.1.1. Middle East and Africa Iron Fortified Infant Formula Revenue (USD Million) by Type (2021-2032)
13.1.2. Middle East and Africa Iron Fortified Infant Formula Revenue (USD Million) by Application (2021-2032)
13.1.3. Middle East and Africa Iron Fortified Infant Formula Revenue (USD Million) by Product (2021-2032)
By Type
Powder
Liquid
By Application
Supermarkets/Hypermarkets
Online Retail
Others
Chapter 14. Iron Fortified Infant Formula Company Profiles
14.1 Business Overview
14.2 Product Profiles
14.3 SWOT Profiles
14.5 Recent Developments
14.6 Financial Profile
List of Companies
Abbott Laboratories
Ausnutria Dairy Corporation Ltd.
Beingmate Baby & Child Food Co., Ltd.
Danone S.A.
Feihe International, Inc.
Inner Mongolia Yili Industrial Group Company Limited
Mead Johnson Nutrition Company LLC
Nestlé S.A.
Synutra International, Inc.
The Kraft Heinz Company
15. Methodology and Data Sources
15.1 Customization Offerings
15.2 Subscription Services
15.3 Related Reports
15.4 Publisher Expertise
LIST OF TABLES
Table 1 Market Segmentation Analysis
Table 2 Global Iron Fortified Infant Formula Market Share of Leading Companies, 2023
Table 3 Product Offerings of Leading Companies
Table 4 Low Growth Scenario Forecasts
Table 5 Reference Case Growth Scenario
Table 6 High Growth Case Scenario
Table 7 Global Iron Fortified Infant Formula Revenue (USD Million) And CAGR (%) By Type (2021-2032)
Table 8 Global Iron Fortified Infant Formula Revenue (USD Million) And CAGR (%) By Application (2021-2032)
Table 9 Global Iron Fortified Infant Formula Revenue (USD Million) And CAGR (%) By Product (2021-2032)
Table 10 Global Iron Fortified Infant Formula Market Revenue (USD Million) By Regions (2021-2032)
Table 11 Global Iron Fortified Infant Formula Market Share (%) By Regions (2021-2032)
Table 12 North America Iron Fortified Infant Formula Revenue (USD Million) By Country (2021-2032)
Table 13 Europe Iron Fortified Infant Formula Revenue (USD Million) By Country (2021-2032)
Table 14 Asia Pacific Iron Fortified Infant Formula Revenue (USD Million) By Country (2021-2032)
Table 15 South America Iron Fortified Infant Formula Revenue (USD Million) By Country (2021-2032)
Table 16 Middle East and Africa Iron Fortified Infant Formula Revenue (USD Million) By Region (2021-2032)
Table 17 North America Iron Fortified Infant Formula Revenue (USD Million) By Type (2021-2032)
Table 18 North America Iron Fortified Infant Formula Revenue (USD Million) By Application (2021-2032)
Table 19 North America Iron Fortified Infant Formula Revenue (USD Million) By Product (2021-2032)
Table 20 Europe Iron Fortified Infant Formula Revenue (USD Million) By Type (2021-2032)
Table 21 Europe Iron Fortified Infant Formula Revenue (USD Million) By Application (2021-2032)
Table 22 Europe Iron Fortified Infant Formula Revenue (USD Million) By Product (2021-2032)
Table 23 Asia Pacific Iron Fortified Infant Formula Revenue (USD Million) By Type (2021-2032)
Table 24 Asia Pacific Iron Fortified Infant Formula Revenue (USD Million) By Application (2021-2032)
Table 25 Asia Pacific Iron Fortified Infant Formula Revenue (USD Million) By Product (2021-2032)
Table 26 South America Iron Fortified Infant Formula Revenue (USD Million) By Type (2021-2032)
Table 27 South America Iron Fortified Infant Formula Revenue (USD Million) By Application (2021-2032)
Table 28 South America Iron Fortified Infant Formula Revenue (USD Million) By Product (2021-2032)
Table 29 Middle East and Africa Iron Fortified Infant Formula Revenue (USD Million) By Type (2021-2032)
Table 30 Middle East and Africa Iron Fortified Infant Formula Revenue (USD Million) By Application (2021-2032)
Table 31 Middle East and Africa Iron Fortified Infant Formula Revenue (USD Million) By Product (2021-2032)
LIST OF FIGURES
Figure 1. Market Scope
Figure 2. Pricing Forecasts Per Unit, 2023- 2032
Figure 3. Porter’s Five Forces
Figure 4. Global Iron Fortified Infant Formula Market Revenue (USD Million) By Regions (2021-2032)
Figure 5. Global Iron Fortified Infant Formula Market Share (%) By Regions (2023)
Figure 6. North America Iron Fortified Infant Formula Revenue (USD Million) By Country (2021-2032)
Figure 7. United States Iron Fortified Infant Formula Revenue (USD Million) By Country (2021-2032)
Figure 8. Canada Iron Fortified Infant Formula Revenue (USD Million) By Country (2021-2032)
Figure 9. Mexico Iron Fortified Infant Formula Revenue (USD Million) By Country (2021-2032)
Figure 10. Europe Iron Fortified Infant Formula Revenue (USD Million) By Country (2021-2032)
Figure 11. Germany Iron Fortified Infant Formula Revenue (USD Million) By Country (2021-2032)
Figure 12. France Iron Fortified Infant Formula Revenue (USD Million) By Country (2021-2032)
Figure 13. United Kingdom Iron Fortified Infant Formula Revenue (USD Million) By Country (2021-2032)
Figure 14. Spain Iron Fortified Infant Formula Revenue (USD Million) By Country (2021-2032)
Figure 15. Italy Iron Fortified Infant Formula Revenue (USD Million) By Country (2021-2032)
Figure 16. Russia Iron Fortified Infant Formula Revenue (USD Million) By Country (2021-2032)
Figure 17. Rest of Europe Iron Fortified Infant Formula Revenue (USD Million) By Country (2021-2032)
Figure 11. Asia Pacific Iron Fortified Infant Formula Revenue (USD Million) By Country (2021-2032)
Figure 12. China Iron Fortified Infant Formula Revenue (USD Million) By Country (2021-2032)
Figure 13. Japan Iron Fortified Infant Formula Revenue (USD Million) By Country (2021-2032)
Figure 14. India Iron Fortified Infant Formula Revenue (USD Million) By Country (2021-2032)
Figure 15. South Korea Iron Fortified Infant Formula Revenue (USD Million) By Country (2021-2032)
Figure 16. Australia Iron Fortified Infant Formula Revenue (USD Million) By Country (2021-2032)
Figure 17. South East Asia Iron Fortified Infant Formula Revenue (USD Million) By Country (2021-2032)
Figure 18. South America Iron Fortified Infant Formula Revenue (USD Million) By Country (2021-2032)
Figure 19. Brazil Iron Fortified Infant Formula Revenue (USD Million) By Country (2021-2032)
Figure 20. Argentina Iron Fortified Infant Formula Revenue (USD Million) By Country (2021-2032)
Figure 21. Rest of Asia Pacific Iron Fortified Infant Formula Revenue (USD Million) By Country (2021-2032)
Figure 22. Middle East and Africa Iron Fortified Infant Formula Revenue (USD Million) By Region (2021-2032)
Figure 23. Saudi Arabia Iron Fortified Infant Formula Revenue (USD Million) By Region (2021-2032)
Figure 24. The UAE Iron Fortified Infant Formula Revenue (USD Million) By Region (2021-2032)
Figure 25. Rest of Middle East Iron Fortified Infant Formula Revenue (USD Million) By Region (2021-2032)
Figure 26. South Africa Iron Fortified Infant Formula Revenue (USD Million) By Region (2021-2032)
Figure 27. Africa Iron Fortified Infant Formula Revenue (USD Million) By Region (2021-2032)
Figure 28. North America Iron Fortified Infant Formula Revenue (USD Million) By Type (2021-2032)
Figure 29. North America Iron Fortified Infant Formula Revenue (USD Million) By Application (2021-2032)
Figure 30. North America Iron Fortified Infant Formula Revenue (USD Million) By Product (2021-2032)
Figure 31. Europe Iron Fortified Infant Formula Revenue (USD Million) By Type (2021-2032)
Figure 32. Europe Iron Fortified Infant Formula Revenue (USD Million) By Application (2021-2032)
Figure 33. Europe Iron Fortified Infant Formula Revenue (USD Million) By Product (2021-2032)
Figure 34. Asia Pacific Iron Fortified Infant Formula Revenue (USD Million) By Type (2021-2032)
Figure 35. Asia Pacific Iron Fortified Infant Formula Revenue (USD Million) By Application (2021-2032)
Figure 36. Asia Pacific Iron Fortified Infant Formula Revenue (USD Million) By Product (2021-2032)
Figure 37. South America Iron Fortified Infant Formula Revenue (USD Million) By Type (2021-2032)
Figure 38. South America Iron Fortified Infant Formula Revenue (USD Million) By Application (2021-2032)
Figure 39. South America Iron Fortified Infant Formula Revenue (USD Million) By Product (2021-2032)
Figure 40. Middle East and Africa Iron Fortified Infant Formula Revenue (USD Million) By Type (2021-2032)
Figure 41. Middle East and Africa Iron Fortified Infant Formula Revenue (USD Million) By Application (2021-2032)
Figure 42. Middle East and Africa Iron Fortified Infant Formula Revenue (USD Million) By Product (2021-2032)
By Type
Powder
Liquid
By Application
Supermarkets/Hypermarkets
Online Retail
Others
Countries Analyzed
North America (US, Canada, Mexico)
Europe (Germany, UK, France, Spain, Italy, Russia, Rest of Europe)
Asia Pacific (China, India, Japan, South Korea, Australia, South East Asia, Rest of Asia)
South America (Brazil, Argentina, Rest of South America)
Middle East and Africa (Saudi Arabia, UAE, Rest of Middle East, South Africa, Egypt, Rest of Africa)
