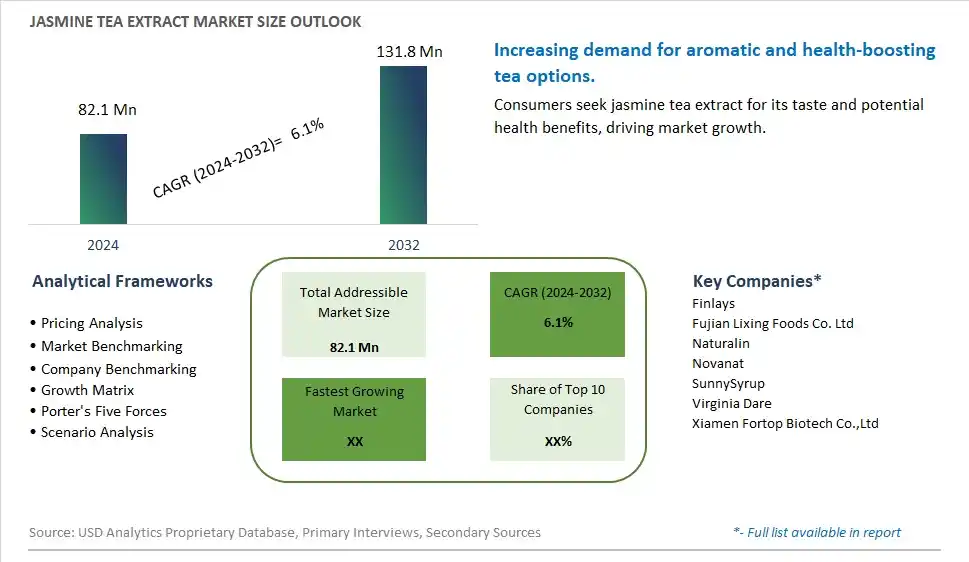
Global Jasmine Tea Extract Market Size is valued at $82.1 Million in 2024 and is forecast to register a growth rate (CAGR) of 6.1% to reach $131.8 Million by 2032.
The global Jasmine Tea Extract Market Comprehensive Study analyzes and forecasts the market size across 6 regions and 24 countries for diverse segments -By Type (Liquid, Tablet, Powder, Capsule, Others), By Application (Pharma & Healthcare, Cosmetic & Skin Care, Food & Feed Additives, Others)
An Introduction to Jasmine Tea Extract Market
In 2024, the jasmine tea extract market is expanding, driven by the rising demand for natural and aromatic ingredients in beverages, cosmetics, and health supplements. Jasmine tea extract, known for its soothing fragrance and antioxidant properties, is gaining popularity for its health benefits and versatile applications. The market is benefiting from innovations in extraction methods that preserve the bioactive compounds and enhance the quality of the extract. The trend towards wellness and the increasing use of botanical extracts in functional foods and beverages are driving market growth. Additionally, sustainable sourcing and eco-friendly packaging are becoming important factors in the market.
Jasmine Tea Extract Competitive Landscape
The market report analyses the leading companies in the industry including Finlays, Fujian Lixing Foods Co. Ltd, Naturalin, Novanat, SunnySyrup, Virginia Dare, Xiamen Fortop Biotech Co.,Ltd, and Others.
Jasmine Tea Extract Market Dynamics
Jasmine Tea Extract Market Trend: Increasing Demand for Natural and Herbal Ingredients
The most prominent trend in the Jasmine Tea Extract Market is the increasing demand for natural and herbal ingredients. Jasmine tea extract, known for its aromatic flavor and potential health benefits, is becoming increasingly popular among consumers seeking natural and health-enhancing products. This trend is driven by the growing preference for clean-label ingredients and the rising popularity of herbal teas.
Jasmine Tea Extract Market Driver: Rising Health Awareness and Interest in Functional Beverages
A key driver in the Jasmine Tea Extract Market is the rising health awareness and interest in functional beverages. Jasmine tea extract is valued for its antioxidant properties and potential benefits for relaxation and overall well-being. As consumers become more health-conscious, there is a growing demand for beverages that offer additional health benefits, supporting the growth of the jasmine tea extract market.
Jasmine Tea Extract Market Opportunity: Expansion into Diverse Product Applications
One significant opportunity in the Jasmine Tea Extract Market lies in the expansion into diverse product applications. Companies can explore incorporating jasmine tea extract into a variety of products, including ready-to-drink teas, dietary supplements, and skincare products. By leveraging the versatility and health benefits of jasmine tea extract, manufacturers can attract a broader consumer base and drive market growth.
Jasmine Tea Extract Market Share Analysis: Liquid segment generated the highest revenue share in the industry
The Liquid segment stands out as the largest within the Jasmine Tea Extract Market. Liquid jasmine tea extract is popular among consumers for its convenience and versatility in various applications. This segment includes ready-to-drink jasmine tea beverages and concentrated liquid extracts used in food, beverages, cosmetics, and pharmaceutical products. Liquid extracts are favored for their ease of incorporation into different formulations, allowing manufacturers to create a wide range of products that capitalize on jasmine tea's aroma, flavor, and health benefits. Jasmine tea is known for its antioxidant properties and soothing aroma, making liquid extracts desirable in the functional beverage and health supplement sectors. The growth of the liquid segment is driven by increasing consumer interest in natural and functional ingredients, as well as the rising popularity of jasmine tea for its calming effects and potential health benefits. Manufacturers are innovating with liquid jasmine tea extracts to meet diverse consumer preferences, driving the expansion of this segment in the Jasmine Tea Extract Market. As consumer demand for natural and health-promoting products continues to rise, the liquid segment is expected to maintain its leadership by offering convenient and versatile solutions across multiple industries.
Jasmine Tea Extract Market Share Analysis: Cosmetic & Skin Care is the fastest growing segment over the forecast period to 2032
The Cosmetic & Skin Care segment emerges as the fastest-growing segment within the Jasmine Tea Extract Market through 2032. This growth is driven by the increasing consumer preference for natural and plant-based ingredients in skincare and cosmetic products. Jasmine tea extract is valued for its antioxidant properties, which help protect the skin from environmental stressors and premature aging. It is also known for its soothing and moisturizing effects, making it suitable for sensitive skin types. As the demand for natural skincare solutions rises globally, manufacturers are incorporating jasmine tea extract into a variety of skincare formulations, including creams, serums, lotions, and facial masks. Further, jasmine tea extract's aromatic properties contribute to its popularity in perfumes and aromatherapy products, further expanding its application in the cosmetic industry. The growth of the Cosmetic & Skin Care segment is supported by ongoing research highlighting the beneficial effects of jasmine tea extract on skin health and appearance. As consumers increasingly prioritize wellness and sustainability in their beauty routines, the demand for jasmine tea extract in cosmetic and skincare applications is expected to continue growing, driving innovation and market expansion in this segment.
Jasmine Tea Extract Market Segmentation
By Type
Liquid
Tablet
Powder
Capsule
Others
By Application
Pharma & Healthcare
Cosmetic & Skin Care
Food & Feed Additives
Others
Countries Analyzed
North America (US, Canada, Mexico)
Europe (Germany, UK, France, Spain, Italy, Russia, Rest of Europe)
Asia Pacific (China, India, Japan, South Korea, Australia, South East Asia, Rest of Asia)
South America (Brazil, Argentina, Rest of South America)
Middle East and Africa (Saudi Arabia, UAE, Rest of Middle East, South Africa, Egypt, Rest of Africa)
Jasmine Tea Extract Companies Profiled in the Study
Finlays
Fujian Lixing Foods Co. Ltd
Naturalin
Novanat
SunnySyrup
Virginia Dare
Xiamen Fortop Biotech Co.,Ltd
*- List Not Exhaustive
Chapter 1. TABLE OF CONTENTS
Chapter 2. Introduction to Jasmine Tea Extract Market
2.1. Market Overview
2.2. Key Statistics and Report Highlights
2.3. Scope of the Comprehensive Study
2.3.1. Market Definition
2.3.2 Countries and Regions Covered
2.3.3 Research Objective
2.3.4 Units, Currency, and Conversions
2.3.5 Industry Value Chain
2.4. Key Market Segments
2.5. Key Companies
2.6. Study Period
Chapter 3. Strategic Analysis Review
3.1. Jasmine Tea Extract Pricing Analysis and Forecast
3.2. Porter’s Five Forces
3.3. Market Ecosystem
3.4. SWOT Analysis
3.5. Regulatory Scenario
3.3. Effects of Inflation, Russia-Ukraine War, moderating economic growth, and other macroeconomic factors
Chapter 4. Competitive Landscape
4.1. Market Share Analysis
4.1.1. Global Jasmine Tea Extract Market Share by Company, 2023
4.1.2. Product Offerings of Leading Jasmine Tea Extract Companies
4.2. Market Entropy
4.2.1. New Product Launches in the Industry
4.2.2. Mergers, Acquisitions, Joint ventures, and Partnerships
4.3. Key Strategies and Best Practices
Chapter 5. Global Market Projections: Best, Reference, and Low Case Scenarios
5.1. Growth Analysis- Case Scenario Definitions
5.2. Low Growth Case Scenario Forecasts
5.3. Reference Growth Case Scenario Forecasts
5.4. High Growth Case Scenario Forecasts
Chapter 6. Market Dynamics
6.1. Jasmine Tea Extract Market Drivers
6.2. Jasmine Tea Extract Market Challenges
6.6. Jasmine Tea Extract Market Opportunities
6.4. Jasmine Tea Extract Market Trends
Chapter 7. Global Jasmine Tea Extract Market Outlook Trends
7.1. Global Jasmine Tea Extract Revenue (USD Million) and CAGR (%) by Type (2021-2032)
7.2. Global Jasmine Tea Extract Revenue (USD Million) and CAGR (%) by Application (2021-2032)
7.3. Global Jasmine Tea Extract Revenue (USD Million) and CAGR (%) by Product (2021-2032)
By Type
Liquid
Tablet
Powder
Capsule
Others
By Application
Pharma & Healthcare
Cosmetic & Skin Care
Food & Feed Additives
Others
Chapter 8. Global Jasmine Tea Extract Regional Analysis and Outlook
8.1. Global Jasmine Tea Extract Revenue (USD Million) By Regions (2021- 2032)
8.2. North America Jasmine Tea Extract Revenue (USD Million) by Country (2021-2032)
8.2.1. United States Jasmine Tea Extract Regional Analysis and Outlook
8.2.2. Canada Jasmine Tea Extract Regional Analysis and Outlook
8.2.3. Mexico Jasmine Tea Extract Regional Analysis and Outlook
8.3. Europe Jasmine Tea Extract Revenue (USD Million), by Country (2021-2032)
8.3.1. Germany Jasmine Tea Extract Regional Analysis and Outlook
8.3.2. France Jasmine Tea Extract Regional Analysis and Outlook
8.3.3. United Kingdom Jasmine Tea Extract Regional Analysis and Outlook
8.3.4. Spain Jasmine Tea Extract Regional Analysis and Outlook
8.3.5. Italy Jasmine Tea Extract Regional Analysis and Outlook
8.3.6. Russia Jasmine Tea Extract Regional Analysis and Outlook
8.3.7. Rest of Europe Jasmine Tea Extract Regional Analysis and Outlook
8.4. Asia Pacific Jasmine Tea Extract Revenue (USD Million) by Country (2021-2032)
8.4.1. China Jasmine Tea Extract Regional Analysis and Outlook
8.4.2. Japan Jasmine Tea Extract Regional Analysis and Outlook
8.4.3. India Jasmine Tea Extract Regional Analysis and Outlook
8.4.4. South Korea Jasmine Tea Extract Regional Analysis and Outlook
8.4.5. Australia Jasmine Tea Extract Regional Analysis and Outlook
8.4.6. South East Asia Jasmine Tea Extract Regional Analysis and Outlook
8.4.7. Rest of Asia Pacific Jasmine Tea Extract Regional Analysis and Outlook
8.5. South America Jasmine Tea Extract Revenue (USD Million), by Country (2021-2032)
8.5.1. Brazil Jasmine Tea Extract Regional Analysis and Outlook
8.5.2. Argentina Jasmine Tea Extract Regional Analysis and Outlook
8.5.3. Rest of South America Jasmine Tea Extract Regional Analysis and Outlook
8.6. Middle East and Africa Jasmine Tea Extract Revenue (USD Million) by Country (2021-2032)
8.6.1. Middle East Jasmine Tea Extract Regional Analysis and Outlook
8.6.2. Africa Jasmine Tea Extract Regional Analysis and Outlook
Chapter 9. North America Jasmine Tea Extract Analysis and Outlook
9.1. North America Jasmine Tea Extract Revenue (USD Million) by Segments (2021-2032)
9.1.1. North America Jasmine Tea Extract Revenue (USD Million) by Type (2021-2032)
9.1.2. North America Jasmine Tea Extract Revenue (USD Million) by Application (2021-2032)
9.1.3. North America Jasmine Tea Extract Revenue (USD Million) by Product (2021-2032)
By Type
Liquid
Tablet
Powder
Capsule
Others
By Application
Pharma & Healthcare
Cosmetic & Skin Care
Food & Feed Additives
Others
Chapter 10. Europe Jasmine Tea Extract Analysis and Outlook
10.1. Europe Jasmine Tea Extract Revenue (USD Million), by Segments (USD Million) (2021-2032)
10.1.1. Europe Jasmine Tea Extract Revenue (USD Million) by Type (2021-2032)
10.1.2. Europe Jasmine Tea Extract Revenue (USD Million) by Application (2021-2032)
10.1.3. Europe Jasmine Tea Extract Revenue (USD Million) by Product (2021-2032)
By Type
Liquid
Tablet
Powder
Capsule
Others
By Application
Pharma & Healthcare
Cosmetic & Skin Care
Food & Feed Additives
Others
Chapter 11. Asia Pacific Jasmine Tea Extract Analysis and Outlook
11.1. Asia Pacific Jasmine Tea Extract Revenue (USD Million), and Revenue (USD Million) by Segments (2021-2032)
11.1.1. Asia Pacific Jasmine Tea Extract Revenue (USD Million) by Type (2021-2032)
11.1.2. Asia Pacific Jasmine Tea Extract Revenue (USD Million) by Application (2021-2032)
11.1.3. Asia Pacific Jasmine Tea Extract Revenue (USD Million) by Product (2021-2032)
By Type
Liquid
Tablet
Powder
Capsule
Others
By Application
Pharma & Healthcare
Cosmetic & Skin Care
Food & Feed Additives
Others
Chapter 12. South America Jasmine Tea Extract Analysis and Outlook
12.1. South America Jasmine Tea Extract Revenue (USD Million), by Segments (2021-2032)
12.1.1. South America Jasmine Tea Extract Revenue (USD Million) by Type (2021-2032)
12.1.2. South America Jasmine Tea Extract Revenue (USD Million) by Application (2021-2032)
12.1.3. South America Jasmine Tea Extract Revenue (USD Million) by Product (2021-2032)
By Type
Liquid
Tablet
Powder
Capsule
Others
By Application
Pharma & Healthcare
Cosmetic & Skin Care
Food & Feed Additives
Others
Chapter 13. Middle East and Africa Jasmine Tea Extract Analysis and Outlook
13.1. Middle East and Africa Jasmine Tea Extract Revenue (USD Million), by Segments (2021-2032)
13.1.1. Middle East and Africa Jasmine Tea Extract Revenue (USD Million) by Type (2021-2032)
13.1.2. Middle East and Africa Jasmine Tea Extract Revenue (USD Million) by Application (2021-2032)
13.1.3. Middle East and Africa Jasmine Tea Extract Revenue (USD Million) by Product (2021-2032)
By Type
Liquid
Tablet
Powder
Capsule
Others
By Application
Pharma & Healthcare
Cosmetic & Skin Care
Food & Feed Additives
Others
Chapter 14. Jasmine Tea Extract Company Profiles
14.1 Business Overview
14.2 Product Profiles
14.3 SWOT Profiles
14.5 Recent Developments
14.6 Financial Profile
List of Companies
Finlays
Fujian Lixing Foods Co. Ltd
Naturalin
Novanat
SunnySyrup
Virginia Dare
Xiamen Fortop Biotech Co.,Ltd
15. Methodology and Data Sources
15.1 Customization Offerings
15.2 Subscription Services
15.3 Related Reports
15.4 Publisher Expertise
LIST OF TABLES
Table 1 Market Segmentation Analysis
Table 2 Global Jasmine Tea Extract Market Share of Leading Companies, 2023
Table 3 Product Offerings of Leading Companies
Table 4 Low Growth Scenario Forecasts
Table 5 Reference Case Growth Scenario
Table 6 High Growth Case Scenario
Table 7 Global Jasmine Tea Extract Revenue (USD Million) And CAGR (%) By Type (2021-2032)
Table 8 Global Jasmine Tea Extract Revenue (USD Million) And CAGR (%) By Application (2021-2032)
Table 9 Global Jasmine Tea Extract Revenue (USD Million) And CAGR (%) By Product (2021-2032)
Table 10 Global Jasmine Tea Extract Market Revenue (USD Million) By Regions (2021-2032)
Table 11 Global Jasmine Tea Extract Market Share (%) By Regions (2021-2032)
Table 12 North America Jasmine Tea Extract Revenue (USD Million) By Country (2021-2032)
Table 13 Europe Jasmine Tea Extract Revenue (USD Million) By Country (2021-2032)
Table 14 Asia Pacific Jasmine Tea Extract Revenue (USD Million) By Country (2021-2032)
Table 15 South America Jasmine Tea Extract Revenue (USD Million) By Country (2021-2032)
Table 16 Middle East and Africa Jasmine Tea Extract Revenue (USD Million) By Region (2021-2032)
Table 17 North America Jasmine Tea Extract Revenue (USD Million) By Type (2021-2032)
Table 18 North America Jasmine Tea Extract Revenue (USD Million) By Application (2021-2032)
Table 19 North America Jasmine Tea Extract Revenue (USD Million) By Product (2021-2032)
Table 20 Europe Jasmine Tea Extract Revenue (USD Million) By Type (2021-2032)
Table 21 Europe Jasmine Tea Extract Revenue (USD Million) By Application (2021-2032)
Table 22 Europe Jasmine Tea Extract Revenue (USD Million) By Product (2021-2032)
Table 23 Asia Pacific Jasmine Tea Extract Revenue (USD Million) By Type (2021-2032)
Table 24 Asia Pacific Jasmine Tea Extract Revenue (USD Million) By Application (2021-2032)
Table 25 Asia Pacific Jasmine Tea Extract Revenue (USD Million) By Product (2021-2032)
Table 26 South America Jasmine Tea Extract Revenue (USD Million) By Type (2021-2032)
Table 27 South America Jasmine Tea Extract Revenue (USD Million) By Application (2021-2032)
Table 28 South America Jasmine Tea Extract Revenue (USD Million) By Product (2021-2032)
Table 29 Middle East and Africa Jasmine Tea Extract Revenue (USD Million) By Type (2021-2032)
Table 30 Middle East and Africa Jasmine Tea Extract Revenue (USD Million) By Application (2021-2032)
Table 31 Middle East and Africa Jasmine Tea Extract Revenue (USD Million) By Product (2021-2032)
LIST OF FIGURES
Figure 1. Market Scope
Figure 2. Pricing Forecasts Per Unit, 2023- 2032
Figure 3. Porter’s Five Forces
Figure 4. Global Jasmine Tea Extract Market Revenue (USD Million) By Regions (2021-2032)
Figure 5. Global Jasmine Tea Extract Market Share (%) By Regions (2023)
Figure 6. North America Jasmine Tea Extract Revenue (USD Million) By Country (2021-2032)
Figure 7. United States Jasmine Tea Extract Revenue (USD Million) By Country (2021-2032)
Figure 8. Canada Jasmine Tea Extract Revenue (USD Million) By Country (2021-2032)
Figure 9. Mexico Jasmine Tea Extract Revenue (USD Million) By Country (2021-2032)
Figure 10. Europe Jasmine Tea Extract Revenue (USD Million) By Country (2021-2032)
Figure 11. Germany Jasmine Tea Extract Revenue (USD Million) By Country (2021-2032)
Figure 12. France Jasmine Tea Extract Revenue (USD Million) By Country (2021-2032)
Figure 13. United Kingdom Jasmine Tea Extract Revenue (USD Million) By Country (2021-2032)
Figure 14. Spain Jasmine Tea Extract Revenue (USD Million) By Country (2021-2032)
Figure 15. Italy Jasmine Tea Extract Revenue (USD Million) By Country (2021-2032)
Figure 16. Russia Jasmine Tea Extract Revenue (USD Million) By Country (2021-2032)
Figure 17. Rest of Europe Jasmine Tea Extract Revenue (USD Million) By Country (2021-2032)
Figure 11. Asia Pacific Jasmine Tea Extract Revenue (USD Million) By Country (2021-2032)
Figure 12. China Jasmine Tea Extract Revenue (USD Million) By Country (2021-2032)
Figure 13. Japan Jasmine Tea Extract Revenue (USD Million) By Country (2021-2032)
Figure 14. India Jasmine Tea Extract Revenue (USD Million) By Country (2021-2032)
Figure 15. South Korea Jasmine Tea Extract Revenue (USD Million) By Country (2021-2032)
Figure 16. Australia Jasmine Tea Extract Revenue (USD Million) By Country (2021-2032)
Figure 17. South East Asia Jasmine Tea Extract Revenue (USD Million) By Country (2021-2032)
Figure 18. South America Jasmine Tea Extract Revenue (USD Million) By Country (2021-2032)
Figure 19. Brazil Jasmine Tea Extract Revenue (USD Million) By Country (2021-2032)
Figure 20. Argentina Jasmine Tea Extract Revenue (USD Million) By Country (2021-2032)
Figure 21. Rest of Asia Pacific Jasmine Tea Extract Revenue (USD Million) By Country (2021-2032)
Figure 22. Middle East and Africa Jasmine Tea Extract Revenue (USD Million) By Region (2021-2032)
Figure 23. Saudi Arabia Jasmine Tea Extract Revenue (USD Million) By Region (2021-2032)
Figure 24. The UAE Jasmine Tea Extract Revenue (USD Million) By Region (2021-2032)
Figure 25. Rest of Middle East Jasmine Tea Extract Revenue (USD Million) By Region (2021-2032)
Figure 26. South Africa Jasmine Tea Extract Revenue (USD Million) By Region (2021-2032)
Figure 27. Africa Jasmine Tea Extract Revenue (USD Million) By Region (2021-2032)
Figure 28. North America Jasmine Tea Extract Revenue (USD Million) By Type (2021-2032)
Figure 29. North America Jasmine Tea Extract Revenue (USD Million) By Application (2021-2032)
Figure 30. North America Jasmine Tea Extract Revenue (USD Million) By Product (2021-2032)
Figure 31. Europe Jasmine Tea Extract Revenue (USD Million) By Type (2021-2032)
Figure 32. Europe Jasmine Tea Extract Revenue (USD Million) By Application (2021-2032)
Figure 33. Europe Jasmine Tea Extract Revenue (USD Million) By Product (2021-2032)
Figure 34. Asia Pacific Jasmine Tea Extract Revenue (USD Million) By Type (2021-2032)
Figure 35. Asia Pacific Jasmine Tea Extract Revenue (USD Million) By Application (2021-2032)
Figure 36. Asia Pacific Jasmine Tea Extract Revenue (USD Million) By Product (2021-2032)
Figure 37. South America Jasmine Tea Extract Revenue (USD Million) By Type (2021-2032)
Figure 38. South America Jasmine Tea Extract Revenue (USD Million) By Application (2021-2032)
Figure 39. South America Jasmine Tea Extract Revenue (USD Million) By Product (2021-2032)
Figure 40. Middle East and Africa Jasmine Tea Extract Revenue (USD Million) By Type (2021-2032)
Figure 41. Middle East and Africa Jasmine Tea Extract Revenue (USD Million) By Application (2021-2032)
Figure 42. Middle East and Africa Jasmine Tea Extract Revenue (USD Million) By Product (2021-2032)
By Type
Liquid
Tablet
Powder
Capsule
Others
By Application
Pharma & Healthcare
Cosmetic & Skin Care
Food & Feed Additives
Others
Countries Analyzed
North America (US, Canada, Mexico)
Europe (Germany, UK, France, Spain, Italy, Russia, Rest of Europe)
Asia Pacific (China, India, Japan, South Korea, Australia, South East Asia, Rest of Asia)
South America (Brazil, Argentina, Rest of South America)
Middle East and Africa (Saudi Arabia, UAE, Rest of Middle East, South Africa, Egypt, Rest of Africa)
