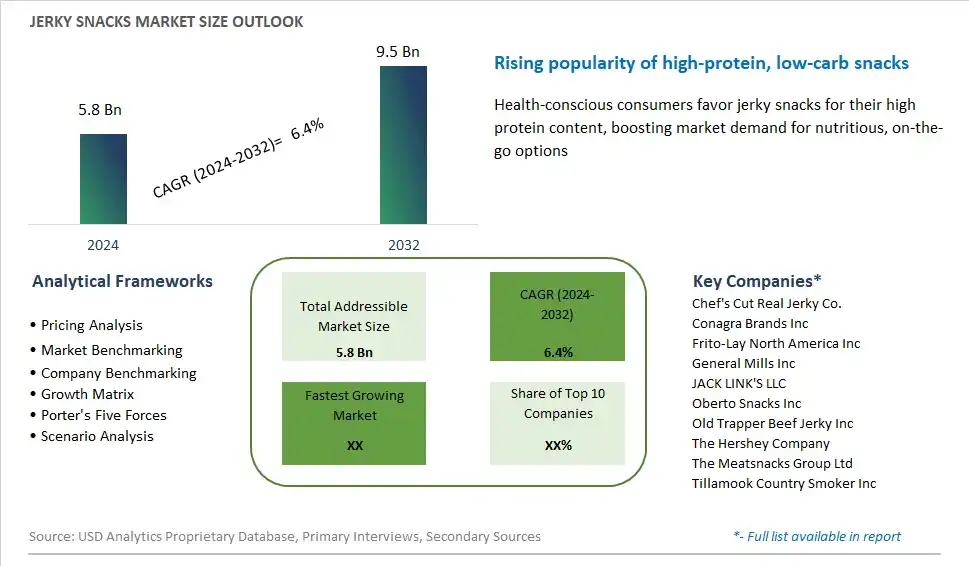
Global Jerky Snacks Market Size is valued at $5.8 Billion in 2024 and is forecast to register a growth rate (CAGR) of 6.4% to reach $9.5 Billion by 2032.
The global Jerky Snacks Market Comprehensive Study analyzes and forecasts the market size across 6 regions and 24 countries for diverse segments -By Product (Beef, Pork, Poultry, Others), By Distribution Channel (Offline, Online)
An Introduction to Jerky Snacks Market
The jerky snacks market in 2024 continues to grow at a robust pace, driven by increasing consumer demand for high-protein, low-fat snack options. Jerky, traditionally made from beef, has diversified to include a wide range of proteins such as turkey, chicken, pork, and plant-based alternatives, catering to various dietary preferences and restrictions. Health-conscious consumers appreciate jerky for its convenience and nutritional benefits, including high protein content, low carbohydrates, and the absence of artificial preservatives. The market is also influenced by the trend towards clean labeling, with many brands emphasizing natural ingredients, grass-fed meats, and sustainable sourcing practices. Innovative flavors and gourmet options are expanding the appeal of jerky snacks, making them popular not only as a quick snack but also as a gourmet treat. With the growing interest in fitness and healthy lifestyles, the jerky snacks market is poised for continued expansion and diversification.
Jerky Snacks Competitive Landscape
The market report analyses the leading companies in the industry including Chef's Cut Real Jerky Co., Conagra Brands Inc, Frito-Lay North America Inc, General Mills Inc, JACK LINK'S LLC, Oberto Snacks Inc, Old Trapper Beef Jerky Inc, The Hershey Company, The Meatsnacks Group Ltd, Tillamook Country Smoker Inc, and Others.
Jerky Snacks Market Dynamics
Jerky Snacks Market Trend: Increasing Demand for High-Protein and Portable Snack Options
One prominent trend in the jerky snacks market is the increasing demand for high-protein and portable snack options. As consumers become more health-conscious and prioritize convenience in their busy lifestyles, there is a growing preference for snacks that offer nutritional benefits while being easy to consume on the go. Jerky snacks, known for their high protein content and long shelf life, align perfectly with these preferences, making them a popular choice among fitness enthusiasts, busy professionals, and outdoor adventurers alike. This trend reflects a broader shift towards healthier snacking habits and the need for convenient, protein-rich options to fuel daily activities.
Market Driver: Rising Popularity of Keto and Paleo Diets
A key driver of the jerky snacks market is the rising popularity of keto and paleo diets. Both diets emphasize low-carb, high-protein food choices, making jerky snacks an ideal fit for individuals following these lifestyles. Jerky snacks are naturally low in carbohydrates, sugar, and additives, making them a preferred snack option for those seeking to maintain ketosis or adhere to a paleo-friendly eating pattern. As more consumers adopt these dietary approaches for weight management, improved energy levels, and overall health, the demand for jerky snacks is expected to continue growing. The alignment of jerky snacks with popular diet trends presents a significant opportunity for manufacturers to capitalize on the expanding market segment of health-conscious consumers.
Market Opportunity: Innovation in Flavors and Ingredients
An opportunity in the jerky snacks market lies in innovation in flavors and ingredients. While traditional beef jerky remains a staple, there is a growing demand for variety and novelty in flavor profiles, as well as options for different dietary preferences and restrictions. Manufacturers can seize this opportunity by introducing new protein sources such as turkey, chicken, or plant-based alternatives like soy or seitan, appealing to a broader consumer base. Additionally, experimenting with innovative flavor combinations, seasoning blends, and ethnic-inspired recipes can attract adventurous consumers looking for unique snacking experiences. By continuously innovating and diversifying their product offerings, companies can stay ahead of consumer trends and carve out a competitive edge in the jerky snacks market.
Jerky Snacks Market Share Analysis: Beef Segment held the dominant market share in 2024
Within the Jerky Snacks market, the Beef segment is the largest category, commanding a significant share due to its widespread popularity, robust flavor profile, and strong consumer demand for traditional beef jerky products. Beef jerky is a well-established snack option known for its savory taste, chewy texture, and high protein content, making it a preferred choice for consumers seeking convenient and satisfying snacks on the go. Further, beef jerky's long shelf life, portability, and convenience contribute to its widespread availability in supermarkets, convenience stores, and online retail channels. Additionally, beef jerky's association with protein-rich, low-carb diets and its versatility in flavor profiles and seasoning options further enhance its appeal to health-conscious consumers and those following specific dietary lifestyles. With its broad consumer acceptance, extensive distribution channels, and timeless appeal, the Beef segment continues to lead the Jerky Snacks market, presenting significant opportunities for manufacturers to innovate and expand their product offerings to meet evolving consumer preferences.
Jerky Snacks Market Share Analysis: Online Distribution Channel Segment market is poised to register the fastest growth rae over the forecast period to 2032
Among the segments in the Jerky Snacks market, the Online Distribution Channel segment is the fastest-growing category, driven by the increasing consumer preference for e-commerce platforms and the convenience of online shopping. Online retailers offer a wide selection of jerky snacks from various brands, flavors, and price points, providing consumers with the flexibility to browse, compare, and purchase products from the comfort of their homes. Further, the COVID-19 pandemic has accelerated the shift towards online shopping, as consumers prioritize safety and avoid crowded stores. The accessibility, convenience, and seamless shopping experience offered by online retailers appeal to busy consumers seeking hassle-free snack options. Additionally, online platforms provide an opportunity for emerging jerky brands to reach a broader audience and establish a digital presence without the need for extensive physical retail infrastructure. With the rapid growth of e-commerce and the increasing demand for convenient snack solutions, the Online Distribution Channel segment experiences exponential growth in the Jerky Snacks market, presenting significant opportunities for manufacturers to capitalize on this trend and expand their online offerings to meet the evolving needs of consumers.
Jerky Snacks Market Segmentation
By Product
Beef
Pork
Poultry
Others
By Distribution Channel
Offline
Online
Countries Analyzed
North America (US, Canada, Mexico)
Europe (Germany, UK, France, Spain, Italy, Russia, Rest of Europe)
Asia Pacific (China, India, Japan, South Korea, Australia, South East Asia, Rest of Asia)
South America (Brazil, Argentina, Rest of South America)
Middle East and Africa (Saudi Arabia, UAE, Rest of Middle East, South Africa, Egypt, Rest of Africa)
Jerky Snacks Companies Profiled in the Study
Chef's Cut Real Jerky Co.
Conagra Brands Inc
Frito-Lay North America Inc
General Mills Inc
JACK LINK'S LLC
Oberto Snacks Inc
Old Trapper Beef Jerky Inc
The Hershey Company
The Meatsnacks Group Ltd
Tillamook Country Smoker Inc
*- List Not Exhaustive
Chapter 1. TABLE OF CONTENTS
Chapter 2. Introduction to Jerky Snacks Market
2.1. Market Overview
2.2. Key Statistics and Report Highlights
2.3. Scope of the Comprehensive Study
2.3.1. Market Definition
2.3.2 Countries and Regions Covered
2.3.3 Research Objective
2.3.4 Units, Currency, and Conversions
2.3.5 Industry Value Chain
2.4. Key Market Segments
2.5. Key Companies
2.6. Study Period
Chapter 3. Strategic Analysis Review
3.1. Jerky Snacks Pricing Analysis and Forecast
3.2. Porter’s Five Forces
3.3. Market Ecosystem
3.4. SWOT Analysis
3.5. Regulatory Scenario
3.3. Effects of Inflation, Russia-Ukraine War, moderating economic growth, and other macroeconomic factors
Chapter 4. Competitive Landscape
4.1. Market Share Analysis
4.1.1. Global Jerky Snacks Market Share by Company, 2023
4.1.2. Product Offerings of Leading Jerky Snacks Companies
4.2. Market Entropy
4.2.1. New Product Launches in the Industry
4.2.2. Mergers, Acquisitions, Joint ventures, and Partnerships
4.3. Key Strategies and Best Practices
Chapter 5. Global Market Projections: Best, Reference, and Low Case Scenarios
5.1. Growth Analysis- Case Scenario Definitions
5.2. Low Growth Case Scenario Forecasts
5.3. Reference Growth Case Scenario Forecasts
5.4. High Growth Case Scenario Forecasts
Chapter 6. Market Dynamics
6.1. Jerky Snacks Market Drivers
6.2. Jerky Snacks Market Challenges
6.6. Jerky Snacks Market Opportunities
6.4. Jerky Snacks Market Trends
Chapter 7. Global Jerky Snacks Market Outlook Trends
7.1. Global Jerky Snacks Revenue (USD Million) and CAGR (%) by Type (2021-2032)
7.2. Global Jerky Snacks Revenue (USD Million) and CAGR (%) by Application (2021-2032)
7.3. Global Jerky Snacks Revenue (USD Million) and CAGR (%) by Product (2021-2032)
By Product
Beef
Pork
Poultry
Others
By Distribution Channel
Offline
Online
Chapter 8. Global Jerky Snacks Regional Analysis and Outlook
8.1. Global Jerky Snacks Revenue (USD Million) By Regions (2021- 2032)
8.2. North America Jerky Snacks Revenue (USD Million) by Country (2021-2032)
8.2.1. United States Jerky Snacks Regional Analysis and Outlook
8.2.2. Canada Jerky Snacks Regional Analysis and Outlook
8.2.3. Mexico Jerky Snacks Regional Analysis and Outlook
8.3. Europe Jerky Snacks Revenue (USD Million), by Country (2021-2032)
8.3.1. Germany Jerky Snacks Regional Analysis and Outlook
8.3.2. France Jerky Snacks Regional Analysis and Outlook
8.3.3. United Kingdom Jerky Snacks Regional Analysis and Outlook
8.3.4. Spain Jerky Snacks Regional Analysis and Outlook
8.3.5. Italy Jerky Snacks Regional Analysis and Outlook
8.3.6. Russia Jerky Snacks Regional Analysis and Outlook
8.3.7. Rest of Europe Jerky Snacks Regional Analysis and Outlook
8.4. Asia Pacific Jerky Snacks Revenue (USD Million) by Country (2021-2032)
8.4.1. China Jerky Snacks Regional Analysis and Outlook
8.4.2. Japan Jerky Snacks Regional Analysis and Outlook
8.4.3. India Jerky Snacks Regional Analysis and Outlook
8.4.4. South Korea Jerky Snacks Regional Analysis and Outlook
8.4.5. Australia Jerky Snacks Regional Analysis and Outlook
8.4.6. South East Asia Jerky Snacks Regional Analysis and Outlook
8.4.7. Rest of Asia Pacific Jerky Snacks Regional Analysis and Outlook
8.5. South America Jerky Snacks Revenue (USD Million), by Country (2021-2032)
8.5.1. Brazil Jerky Snacks Regional Analysis and Outlook
8.5.2. Argentina Jerky Snacks Regional Analysis and Outlook
8.5.3. Rest of South America Jerky Snacks Regional Analysis and Outlook
8.6. Middle East and Africa Jerky Snacks Revenue (USD Million) by Country (2021-2032)
8.6.1. Middle East Jerky Snacks Regional Analysis and Outlook
8.6.2. Africa Jerky Snacks Regional Analysis and Outlook
Chapter 9. North America Jerky Snacks Analysis and Outlook
9.1. North America Jerky Snacks Revenue (USD Million) by Segments (2021-2032)
9.1.1. North America Jerky Snacks Revenue (USD Million) by Type (2021-2032)
9.1.2. North America Jerky Snacks Revenue (USD Million) by Application (2021-2032)
9.1.3. North America Jerky Snacks Revenue (USD Million) by Product (2021-2032)
By Product
Beef
Pork
Poultry
Others
By Distribution Channel
Offline
Online
Chapter 10. Europe Jerky Snacks Analysis and Outlook
10.1. Europe Jerky Snacks Revenue (USD Million), by Segments (USD Million) (2021-2032)
10.1.1. Europe Jerky Snacks Revenue (USD Million) by Type (2021-2032)
10.1.2. Europe Jerky Snacks Revenue (USD Million) by Application (2021-2032)
10.1.3. Europe Jerky Snacks Revenue (USD Million) by Product (2021-2032)
By Product
Beef
Pork
Poultry
Others
By Distribution Channel
Offline
Online
Chapter 11. Asia Pacific Jerky Snacks Analysis and Outlook
11.1. Asia Pacific Jerky Snacks Revenue (USD Million), and Revenue (USD Million) by Segments (2021-2032)
11.1.1. Asia Pacific Jerky Snacks Revenue (USD Million) by Type (2021-2032)
11.1.2. Asia Pacific Jerky Snacks Revenue (USD Million) by Application (2021-2032)
11.1.3. Asia Pacific Jerky Snacks Revenue (USD Million) by Product (2021-2032)
By Product
Beef
Pork
Poultry
Others
By Distribution Channel
Offline
Online
Chapter 12. South America Jerky Snacks Analysis and Outlook
12.1. South America Jerky Snacks Revenue (USD Million), by Segments (2021-2032)
12.1.1. South America Jerky Snacks Revenue (USD Million) by Type (2021-2032)
12.1.2. South America Jerky Snacks Revenue (USD Million) by Application (2021-2032)
12.1.3. South America Jerky Snacks Revenue (USD Million) by Product (2021-2032)
By Product
Beef
Pork
Poultry
Others
By Distribution Channel
Offline
Online
Chapter 13. Middle East and Africa Jerky Snacks Analysis and Outlook
13.1. Middle East and Africa Jerky Snacks Revenue (USD Million), by Segments (2021-2032)
13.1.1. Middle East and Africa Jerky Snacks Revenue (USD Million) by Type (2021-2032)
13.1.2. Middle East and Africa Jerky Snacks Revenue (USD Million) by Application (2021-2032)
13.1.3. Middle East and Africa Jerky Snacks Revenue (USD Million) by Product (2021-2032)
By Product
Beef
Pork
Poultry
Others
By Distribution Channel
Offline
Online
Chapter 14. Jerky Snacks Company Profiles
14.1 Business Overview
14.2 Product Profiles
14.3 SWOT Profiles
14.5 Recent Developments
14.6 Financial Profile
List of Companies
Chef's Cut Real Jerky Co.
Conagra Brands Inc
Frito-Lay North America Inc
General Mills Inc
JACK LINK'S LLC
Oberto Snacks Inc
Old Trapper Beef Jerky Inc
The Hershey Company
The Meatsnacks Group Ltd
Tillamook Country Smoker Inc
15. Methodology and Data Sources
15.1 Customization Offerings
15.2 Subscription Services
15.3 Related Reports
15.4 Publisher Expertise
LIST OF TABLES
Table 1 Market Segmentation Analysis
Table 2 Global Jerky Snacks Market Share of Leading Companies, 2023
Table 3 Product Offerings of Leading Companies
Table 4 Low Growth Scenario Forecasts
Table 5 Reference Case Growth Scenario
Table 6 High Growth Case Scenario
Table 7 Global Jerky Snacks Revenue (USD Million) And CAGR (%) By Type (2021-2032)
Table 8 Global Jerky Snacks Revenue (USD Million) And CAGR (%) By Application (2021-2032)
Table 9 Global Jerky Snacks Revenue (USD Million) And CAGR (%) By Product (2021-2032)
Table 10 Global Jerky Snacks Market Revenue (USD Million) By Regions (2021-2032)
Table 11 Global Jerky Snacks Market Share (%) By Regions (2021-2032)
Table 12 North America Jerky Snacks Revenue (USD Million) By Country (2021-2032)
Table 13 Europe Jerky Snacks Revenue (USD Million) By Country (2021-2032)
Table 14 Asia Pacific Jerky Snacks Revenue (USD Million) By Country (2021-2032)
Table 15 South America Jerky Snacks Revenue (USD Million) By Country (2021-2032)
Table 16 Middle East and Africa Jerky Snacks Revenue (USD Million) By Region (2021-2032)
Table 17 North America Jerky Snacks Revenue (USD Million) By Type (2021-2032)
Table 18 North America Jerky Snacks Revenue (USD Million) By Application (2021-2032)
Table 19 North America Jerky Snacks Revenue (USD Million) By Product (2021-2032)
Table 20 Europe Jerky Snacks Revenue (USD Million) By Type (2021-2032)
Table 21 Europe Jerky Snacks Revenue (USD Million) By Application (2021-2032)
Table 22 Europe Jerky Snacks Revenue (USD Million) By Product (2021-2032)
Table 23 Asia Pacific Jerky Snacks Revenue (USD Million) By Type (2021-2032)
Table 24 Asia Pacific Jerky Snacks Revenue (USD Million) By Application (2021-2032)
Table 25 Asia Pacific Jerky Snacks Revenue (USD Million) By Product (2021-2032)
Table 26 South America Jerky Snacks Revenue (USD Million) By Type (2021-2032)
Table 27 South America Jerky Snacks Revenue (USD Million) By Application (2021-2032)
Table 28 South America Jerky Snacks Revenue (USD Million) By Product (2021-2032)
Table 29 Middle East and Africa Jerky Snacks Revenue (USD Million) By Type (2021-2032)
Table 30 Middle East and Africa Jerky Snacks Revenue (USD Million) By Application (2021-2032)
Table 31 Middle East and Africa Jerky Snacks Revenue (USD Million) By Product (2021-2032)
LIST OF FIGURES
Figure 1. Market Scope
Figure 2. Pricing Forecasts Per Unit, 2023- 2032
Figure 3. Porter’s Five Forces
Figure 4. Global Jerky Snacks Market Revenue (USD Million) By Regions (2021-2032)
Figure 5. Global Jerky Snacks Market Share (%) By Regions (2023)
Figure 6. North America Jerky Snacks Revenue (USD Million) By Country (2021-2032)
Figure 7. United States Jerky Snacks Revenue (USD Million) By Country (2021-2032)
Figure 8. Canada Jerky Snacks Revenue (USD Million) By Country (2021-2032)
Figure 9. Mexico Jerky Snacks Revenue (USD Million) By Country (2021-2032)
Figure 10. Europe Jerky Snacks Revenue (USD Million) By Country (2021-2032)
Figure 11. Germany Jerky Snacks Revenue (USD Million) By Country (2021-2032)
Figure 12. France Jerky Snacks Revenue (USD Million) By Country (2021-2032)
Figure 13. United Kingdom Jerky Snacks Revenue (USD Million) By Country (2021-2032)
Figure 14. Spain Jerky Snacks Revenue (USD Million) By Country (2021-2032)
Figure 15. Italy Jerky Snacks Revenue (USD Million) By Country (2021-2032)
Figure 16. Russia Jerky Snacks Revenue (USD Million) By Country (2021-2032)
Figure 17. Rest of Europe Jerky Snacks Revenue (USD Million) By Country (2021-2032)
Figure 11. Asia Pacific Jerky Snacks Revenue (USD Million) By Country (2021-2032)
Figure 12. China Jerky Snacks Revenue (USD Million) By Country (2021-2032)
Figure 13. Japan Jerky Snacks Revenue (USD Million) By Country (2021-2032)
Figure 14. India Jerky Snacks Revenue (USD Million) By Country (2021-2032)
Figure 15. South Korea Jerky Snacks Revenue (USD Million) By Country (2021-2032)
Figure 16. Australia Jerky Snacks Revenue (USD Million) By Country (2021-2032)
Figure 17. South East Asia Jerky Snacks Revenue (USD Million) By Country (2021-2032)
Figure 18. South America Jerky Snacks Revenue (USD Million) By Country (2021-2032)
Figure 19. Brazil Jerky Snacks Revenue (USD Million) By Country (2021-2032)
Figure 20. Argentina Jerky Snacks Revenue (USD Million) By Country (2021-2032)
Figure 21. Rest of Asia Pacific Jerky Snacks Revenue (USD Million) By Country (2021-2032)
Figure 22. Middle East and Africa Jerky Snacks Revenue (USD Million) By Region (2021-2032)
Figure 23. Saudi Arabia Jerky Snacks Revenue (USD Million) By Region (2021-2032)
Figure 24. The UAE Jerky Snacks Revenue (USD Million) By Region (2021-2032)
Figure 25. Rest of Middle East Jerky Snacks Revenue (USD Million) By Region (2021-2032)
Figure 26. South Africa Jerky Snacks Revenue (USD Million) By Region (2021-2032)
Figure 27. Africa Jerky Snacks Revenue (USD Million) By Region (2021-2032)
Figure 28. North America Jerky Snacks Revenue (USD Million) By Type (2021-2032)
Figure 29. North America Jerky Snacks Revenue (USD Million) By Application (2021-2032)
Figure 30. North America Jerky Snacks Revenue (USD Million) By Product (2021-2032)
Figure 31. Europe Jerky Snacks Revenue (USD Million) By Type (2021-2032)
Figure 32. Europe Jerky Snacks Revenue (USD Million) By Application (2021-2032)
Figure 33. Europe Jerky Snacks Revenue (USD Million) By Product (2021-2032)
Figure 34. Asia Pacific Jerky Snacks Revenue (USD Million) By Type (2021-2032)
Figure 35. Asia Pacific Jerky Snacks Revenue (USD Million) By Application (2021-2032)
Figure 36. Asia Pacific Jerky Snacks Revenue (USD Million) By Product (2021-2032)
Figure 37. South America Jerky Snacks Revenue (USD Million) By Type (2021-2032)
Figure 38. South America Jerky Snacks Revenue (USD Million) By Application (2021-2032)
Figure 39. South America Jerky Snacks Revenue (USD Million) By Product (2021-2032)
Figure 40. Middle East and Africa Jerky Snacks Revenue (USD Million) By Type (2021-2032)
Figure 41. Middle East and Africa Jerky Snacks Revenue (USD Million) By Application (2021-2032)
Figure 42. Middle East and Africa Jerky Snacks Revenue (USD Million) By Product (2021-2032)
By Product
Beef
Pork
Poultry
Others
By Distribution Channel
Offline
Online
Countries Analyzed
North America (US, Canada, Mexico)
Europe (Germany, UK, France, Spain, Italy, Russia, Rest of Europe)
Asia Pacific (China, India, Japan, South Korea, Australia, South East Asia, Rest of Asia)
South America (Brazil, Argentina, Rest of South America)
Middle East and Africa (Saudi Arabia, UAE, Rest of Middle East, South Africa, Egypt, Rest of Africa)
