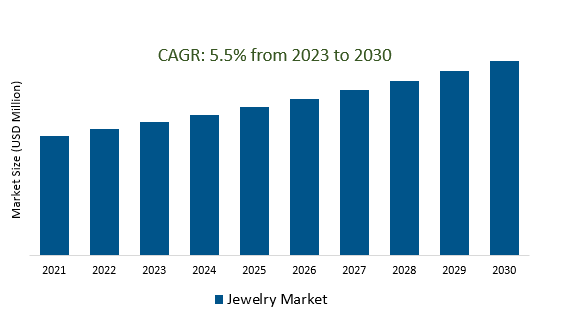
The Jewelry Market Size is estimated to register 5.5% growth over the forecast period from 2023 to 2030.
Jewelry Market Overview
Economic prosperity and increasing disposable income levels, particularly in emerging economies, are positively influencing the demand for luxury goods, including jewelry. Changing consumer preferences and evolving fashion trends significantly impact the Jewelry Market. Customization options, such as engraving, birthstones, initials, or personalized designs, offering customers the opportunity to create bespoke jewelry that reflects their individuality and sentiments are fueling the demand. Jewelry retailers are embracing e-commerce platforms, enhancing their online presence, and utilizing technology to offer immersive shopping experiences to customers. Celebratory events such as weddings, anniversaries, festivals, and special occasions drive the demand for jewelry as gifts, contributing significantly to market growth.
Jewelry Market Dynamics
Market Trends- Embracing Personalization and Customization is Shaping the Jewelry Market.
Customizable designs, allowing customers to create bespoke jewelry with personalized elements such as initials, birthstones, engraved messages, or symbols that hold sentimental value are key factors driving the demand. Additionally, the rise of e-commerce platforms and direct-to-consumer models are enabling brands to offer personalized services online, reaching a broader audience of consumers seeking unique jewelry experiences. Successful businesses in the jewelry sector are not only providing customization options but also crafting narratives around these personalized designs, fostering a deeper connection with their customer base, and are driving the market growth.
Market Driver- Sustainable and Ethical Sourcing in jewelry market are driving the demand.
Changing consumer expectations are significantly influencing the jewelry sector. The heightened awareness of environmental concerns is leading to a demand for transparency in supply chains and a preference for jewelry sourced from ethical and sustainable origins. Certification bodies and industry organizations, such as the Responsible Jewelry Council (RJC) and Fairtrade Gold, establishing stringent guidelines for responsible sourcing, emphasizing fair labor practices and ethical treatment throughout the supply chain are fueling the demand. Additionally, brand reputation and consumer trust are playing a pivotal role in driving the adoption of responsible sourcing.
Market Opportunity- Introduction of Cultural significance and gifting traditions in Jewelry Market.
Consumers, seeking jewelry designs that reflect their cultural heritage or pay homage to specific traditions adorned with symbolic motifs, cultural patterns, or designs associated with specific rituals and beliefs tend to be driving the market growth. Jewelry brands are strategically leveraging these cultural and gifting traditions by offering collections tailored to specific cultural aesthetics or crafting marketing campaigns centered around sentimental gifting occasions. Occasions such as weddings, anniversaries, birthdays, and religious ceremonies often prompt the exchange of jewelry as a token of affection and celebration, thereby increasing the market growth.
Market Share Analysis- Diamonds will register the fastest growth.
The Global Jewelry Market is analyzed across, and others. Diamonds are poised to register the fastest growth. Diamonds hold a prominent and enduring position in the jewelry market, prized for their rarity, beauty, and symbolism. Their unparalleled brilliance and durability make them a sought-after choice for various types of jewelry, including engagement rings, necklaces, earrings, and bracelets. Diamonds are associated with enduring love, commitment, and luxury for generations, particularly in the context of engagement rings. Diamonds with high-quality characteristics, such as excellent cut, clarity, and color grades, command higher prices due to their rarity and aesthetic appeal. Additionally, consumer preferences for ethically sourced and responsibly mined diamonds are driving the adoption of measures that ensure transparency and ethical practices throughout the diamond supply chain.
Market Share Analysis- Online distribution channel held a significant market share in 2023.
The Global Jewelry Market is analyzed across various distribution channels Online & Offline. Of these, online held a significant market share in 2023. Online shopping offers consumers the convenience of shopping from anywhere at any time. They can browse a wider selection of jewelry, compare prices, and read reviews without having to leave their home. They offer lower prices than traditional brick-and-mortar stores, as they have lower overhead costs. This is because online retailers do not need to pay rent, utilities, and salaries for store employees. The interactive features such as 360-degree product views, high-resolution images, and virtual try-on tools, enabling customers to examine intricate details and visualize how the jewelry looks when worn. Reputable online jewelry retailers prioritize security measures to safeguard customers' personal and financial information. They also offer flexible return policies and warranties to assure customers of the quality and authenticity of their purchases, mitigating concerns associated with buying jewelry online.
Jewelry Market Segmentation
By Raw Material
- Gold
- Platinum
- Diamond
- Precious Pearls
- Gemstones
- Others
By Type
- Necklaces
- Ring
- Earrings
- Bracelets
- Others
By Application
By Distribution channel
By Region
- North America (United States, Canada, Mexico)
- Europe (Germany, France, United Kingdom, Spain, Italy, Others)
- Asia Pacific (China, India, Japan, South Korea, Australia, Others)
- Latin America (Brazil, Argentina, Others)
- Middle East and Africa (Saudi Arabia, UAE, Kuwait, Other Middle East, South Africa, Nigeria, Other Africa)
Jewelry Market Companies
- Louis Vuitton SE
- Tiffany & Co
- Pandora
- Chow Tai Fook
- Richemont
- GRAFF
- H. Stern
- Malabar Gold & Diamonds
- Swarovski AG
- Signet Jewelers Ltd
*List not exhaustive
Jewelry Market Outlook 2023
1 Market Overview
1.1 Introduction to the Jewelry Market
1.2 Scope of the Study
1.3 Research Objective
1.3.1 Key Market Scope and Segments
1.3.2 Players Covered
1.3.3 Years Considered
2 Executive Summary
2.1 2023 Jewelry Industry- Market Statistics
3 Market Dynamics
3.1 Market Drivers
3.2 Market Challenges
3.3 Market Opportunities
3.4 Market Trends
4 Market Factor Analysis
4.1 Porter’s Five Forces
4.2 Market Entropy
4.2.1 Global Jewelry Market Companies with Area Served
4.2.2 Products Offerings Global Jewelry Market
5 COVID-19 Impact Analysis and Outlook Scenarios
5.1.1 Covid-19 Impact Analysis
5.1.2 post-COVID-19 Scenario- Low Growth Case
5.1.3 post-COVID-19 Scenario- Reference Growth Case
5.1.4 post-COVID-19 Scenario- Low Growth Case
6 Global Jewelry Market Trends
6.1 Global Jewelry Revenue (USD Million) and CAGR (%) by Type (2018-2030)
6.2 Global Jewelry Revenue (USD Million) and CAGR (%) by Applications (2018-2030)
6.3 Global Jewelry Revenue (USD Million) and CAGR (%) by regions (2018-2030)
7 Global Jewelry Market Revenue (USD Million) by Type, and Applications (2018-2022)
7.1 Global Jewelry Revenue (USD Million) by Type (2018-2022)
7.1.1 Global Jewelry Revenue (USD Million), Market Share (%) by Type (2018-2022)
7.2 Global Jewelry Revenue (USD Million) by Applications (2018-2022)
7.2.1 Global Jewelry Revenue (USD Million), Market Share (%) by Applications (2018-2022)
8 Global Jewelry Development Regional Status and Outlook
8.1 Global Jewelry Revenue (USD Million) By Regions (2018-2022)
8.2 North America Jewelry Revenue (USD Million) by Type, and Application (2018-2022)
8.2.1 North America Jewelry Revenue (USD Million) by Country (2018-2022)
8.2.2 North America Jewelry Revenue (USD Million) by Type (2018-2022)
8.2.3 North America Jewelry Revenue (USD Million) by Applications (2018-2022)
8.3 Europe Jewelry Revenue (USD Million), by Type, and Applications (USD Million) (2018-2022)
8.3.1 Europe Jewelry Revenue (USD Million), by Country (2018-2022)
8.3.2 Europe Jewelry Revenue (USD Million) by Type (2018-2022)
8.3.3 Europe Jewelry Revenue (USD Million) by Applications (2018-2022)
8.4 Asia Pacific Jewelry Revenue (USD Million), and Revenue (USD Million) by Type, and Applications (2018-2022)
8.4.1 Asia Pacific Jewelry Revenue (USD Million) by Country (2018-2022)
8.4.2 Asia Pacific Jewelry Revenue (USD Million) by Type (2018-2022)
8.4.3 Asia Pacific Jewelry Revenue (USD Million) by Applications (2018-2022)
8.5 South America Jewelry Revenue (USD Million), by Type, and Applications (2018-2022)
8.5.1 South America Jewelry Revenue (USD Million), by Country (2018-2022)
8.5.2 South America Jewelry Revenue (USD Million) by Type (2018-2022)
8.5.3 South America Jewelry Revenue (USD Million) by Applications (2018-2022)
8.6 Middle East and Africa Jewelry Revenue (USD Million), by Type, Technology, Application, Thickness (2018-2022)
8.6.1 Middle East and Africa Jewelry Revenue (USD Million) by Country (2018-2022)
8.6.2 Middle East and Africa Jewelry Revenue (USD Million) by Type (2018-2022)
8.6.3 Middle East and Africa Jewelry Revenue (USD Million) by Applications (2018-2022)
9 Company Profiles
10 Global Jewelry Market Revenue (USD Million), by Type, and Applications (2023-2030)
10.1 Global Jewelry Revenue (USD Million) and Market Share (%) by Type (2023-2030)
10.1.1 Global Jewelry Revenue (USD Million), and Market Share (%) by Type (2023-2030)
10.2 Global Jewelry Revenue (USD Million) and Market Share (%) by Applications (2023-2030)
10.2.1 Global Jewelry Revenue (USD Million), and Market Share (%) by Applications (2023-2030)
11 Global Jewelry Development Regional Status and Outlook Forecast
11.1 Global Jewelry Revenue (USD Million) By Regions (2023-2030)
11.2 North America Jewelry Revenue (USD Million) by Type, and Applications (2023-2030)
11.2.1 North America Jewelry Revenue (USD) Million by Country (2023-2030)
11.2.2 North America Jewelry Revenue (USD Million), by Type (2023-2030)
11.2.3 North America Jewelry Revenue (USD Million), Market Share (%) by Applications (2023-2030)
11.3 Europe Jewelry Revenue (USD Million), by Type, and Applications (2023-2030)
11.3.1 Europe Jewelry Revenue (USD Million), by Country (2023-2030)
11.3.2 Europe Jewelry Revenue (USD Million), by Type (2023-2030)
11.3.3 Europe Jewelry Revenue (USD Million), by Applications (2023-2030)
11.4 Asia Pacific Jewelry Revenue (USD Million) by Type, and Applications (2023-2030)
11.4.1 Asia Pacific Jewelry Revenue (USD Million), by Country (2023-2030)
11.4.2 Asia Pacific Jewelry Revenue (USD Million), by Type (2023-2030)
11.4.3 Asia Pacific Jewelry Revenue (USD Million), by Applications (2023-2030)
11.5 South America Jewelry Revenue (USD Million), by Type, and Applications (2023-2030)
11.5.1 South America Jewelry Revenue (USD Million), by Country (2023-2030)
11.5.2 South America Jewelry Revenue (USD Million), by Type (2023-2030)
11.5.3 South America Jewelry Revenue (USD Million), by Applications (2023-2030)
11.6 Middle East and Africa Jewelry Revenue (USD Million), by Type, and Applications (2023-2030)
11.6.1 Middle East and Africa Jewelry Revenue (USD Million), by region (2023-2030)
11.6.2 Middle East and Africa Jewelry Revenue (USD Million), by Type (2023-2030)
11.6.3 Middle East and Africa Jewelry Revenue (USD Million), by Applications (2023-2030)
12 Methodology and Data Sources
12.1 Methodology/Research Approach
12.1.1 Research Programs/Design
12.1.2 Market Size Estimation
12.1.3 Market Breakdown and Data Triangulation
12.2 Data Sources
12.2.1 Secondary Sources
12.2.2 Primary Sources
12.3 Disclaimer
List of Tables
Table 1 Market Segmentation Analysis
Table 2 Global Jewelry Market Companies with Areas Served
Table 3 Products Offerings Global Jewelry Market
Table 4 Low Growth Scenario Forecasts
Table 5 Reference Case Growth Scenario
Table 6 High Growth Case Scenario
Table 7 Global Jewelry Revenue (USD Million) And CAGR (%) By Type (2018-2030)
Table 8 Global Jewelry Revenue (USD Million) And CAGR (%) By Applications (2018-2030)
Table 9 Global Jewelry Revenue (USD Million) And CAGR (%) By Regions (2018-2030)
Table 10 Global Jewelry Revenue (USD Million) By Type (2018-2022)
Table 11 Global Jewelry Revenue Market Share (%) By Type (2018-2022)
Table 12 Global Jewelry Revenue (USD Million) By Applications (2018-2022)
Table 13 Global Jewelry Revenue Market Share (%) By Applications (2018-2022)
Table 14 Global Jewelry Market Revenue (USD Million) By Regions (2018-2022)
Table 15 Global Jewelry Market Share (%) By Regions (2018-2022)
Table 16 North America Jewelry Revenue (USD Million) By Country (2018-2022)
Table 17 North America Jewelry Revenue (USD Million) By Type (2018-2022)
Table 18 North America Jewelry Revenue (USD Million) By Applications (2018-2022)
Table 19 Europe Jewelry Revenue (USD Million) By Country (2018-2022)
Table 20 Europe Jewelry Revenue (USD Million) By Type (2018-2022)
Table 21 Europe Jewelry Revenue (USD Million) By Applications (2018-2022)
Table 22 Asia Pacific Jewelry Revenue (USD Million) By Country (2018-2022)
Table 23 Asia Pacific Jewelry Revenue (USD Million) By Type (2018-2022)
Table 24 Asia Pacific Jewelry Revenue (USD Million) By Applications (2018-2022)
Table 25 South America Jewelry Revenue (USD Million) By Country (2018-2022)
Table 26 South America Jewelry Revenue (USD Million) By Type (2018-2022)
Table 27 South America Jewelry Revenue (USD Million) By Applications (2018-2022)
Table 28 Middle East and Africa Jewelry Revenue (USD Million) By Region (2018-2022)
Table 29 Middle East and Africa Jewelry Revenue (USD Million) By Type (2018-2022)
Table 30 Middle East and Africa Jewelry Revenue (USD Million) By Applications (2018-2022)
Table 31 Financial Analysis
Table 32 Global Jewelry Revenue (USD Million) By Type (2023-2030)
Table 33 Global Jewelry Revenue Market Share (%) By Type (2023-2030)
Table 34 Global Jewelry Revenue (USD Million) By Applications (2023-2030)
Table 35 Global Jewelry Revenue Market Share (%) By Applications (2023-2030)
Table 36 Global Jewelry Market Revenue (USD Million), And Revenue (USD Million) By Regions (2023-2030)
Table 37 North America Jewelry Revenue (USD)By Country (2023-2030)
Table 38 North America Jewelry Revenue (USD Million) By Type (2023-2030)
Table 39 North America Jewelry Revenue (USD Million) By Applications (2023-2030)
Table 40 Europe Jewelry Revenue (USD Million) By Country (2023-2030)
Table 41 Europe Jewelry Revenue (USD Million) By Type (2023-2030)
Table 42 Europe Jewelry Revenue (USD Million) By Applications (2023-2030)
Table 43 Asia Pacific Jewelry Revenue (USD Million) By Country (2023-2030)
Table 44 Asia Pacific Jewelry Revenue (USD Million) By Type (2023-2030)
Table 45 Asia Pacific Jewelry Revenue (USD Million) By Applications (2023-2030)
Table 46 South America Jewelry Revenue (USD Million) By Country (2023-2030)
Table 47 South America Jewelry Revenue (USD Million) By Type (2023-2030)
Table 48 South America Jewelry Revenue (USD Million) By Applications (2023-2030)
Table 49 Middle East and Africa Jewelry Revenue (USD Million) By Region (2023-2030)
Table 50 Middle East and Africa Jewelry Revenue (USD Million) By Region (2023-2030)
Table 51 Middle East and Africa Jewelry Revenue (USD Million) By Type (2023-2030)
Table 52 Middle East and Africa Jewelry Revenue (USD Million) By Applications (2023-2030)
Table 53 Research Programs/Design for This Report
Table 54 Key Data Information from Secondary Sources
Table 55 Key Data Information from Primary Sources
List of Figures
Figure 1 Market Scope
Figure 2 Porter’s Five Forces
Figure 3 Global Jewelry Revenue (USD Million) By Type (2018-2022)
Figure 4 Global Jewelry Revenue Market Share (%) By Type (2022)
Figure 5 Global Jewelry Revenue (USD Million) By Applications (2018-2022)
Figure 6 Global Jewelry Revenue Market Share (%) By Applications (2022)
Figure 7 Global Jewelry Market Revenue (USD Million) By Regions (2018-2022)
Figure 8 Global Jewelry Market Share (%) By Regions (2022)
Figure 9 North America Jewelry Revenue (USD Million) By Country (2018-2022)
Figure 10 North America Jewelry Revenue (USD Million) By Type (2018-2022)
Figure 11 North America Jewelry Revenue (USD Million) By Applications (2018-2022)
Figure 12 Europe Jewelry Revenue (USD Million) By Country (2018-2022)
Figure 13 Europe Jewelry Revenue (USD Million) By Type (2018-2022)
Figure 14 Europe Jewelry Revenue (USD Million) By Applications (2018-2022)
Figure 15 Asia Pacific Jewelry Revenue (USD Million) By Country (2018-2022)
Figure 16 Asia Pacific Jewelry Revenue (USD Million) By Type (2018-2022)
Figure 17 Asia Pacific Jewelry Revenue (USD Million) By Applications (2018-2022)
Figure 18 South America Jewelry Revenue (USD Million) By Country (2018-2022)
Figure 19 South America Jewelry Revenue (USD Million) By Type (2018-2022)
Figure 20 South America Jewelry Revenue (USD Million) By Applications (2018-2022)
Figure 21 Middle East and Africa Jewelry Revenue (USD Million) By Region (2018-2022)
Figure 22 Middle East and Africa Jewelry Revenue (USD Million) By Type (2018-2022)
Figure 23 Middle East and Africa Jewelry Revenue (USD Million) By Applications (2018-2022)
Figure 24 Global Jewelry Revenue (USD Million) By Type (2023-2030)
Figure 25 Global Jewelry Revenue Market Share (%) By Type (2030)
Figure 26 Global Jewelry Revenue (USD Million) By Applications (2023-2030)
Figure 27 Global Jewelry Revenue Market Share (%) By Applications (2030)
Figure 28 Global Jewelry Market Revenue (USD Million) By Regions (2023-2030)
Figure 29 North America Jewelry Revenue (USD Million) By Country (2023-2030)
Figure 30 North America Jewelry Revenue (USD Million) By Type (2023-2030)
Figure 31 North America Jewelry Revenue (USD Million) By Applications (2023-2030)
Figure 32 Europe Jewelry Revenue (USD Million) By Country (2023-2030)
Figure 33 Europe Jewelry Revenue (USD Million) By Type (2023-2030)
Figure 34 Europe Jewelry Revenue (USD Million) By Applications (2023-2030)
Figure 35 Asia Pacific Jewelry Revenue (USD Million) By Country (2023-2030)
Figure 36 Asia Pacific Jewelry Revenue (USD Million) By Type (2023-2030)
Figure 37 Asia Pacific Jewelry Revenue (USD Million) By Applications (2023-2030)
Figure 38 South America Jewelry Revenue (USD Million) By Country (2023-2030)
Figure 39 South America Jewelry Revenue (USD Million) By Type (2023-2030)
Figure 40 South America Jewelry Revenue (USD Million) By Applications (2023-2030)
Figure 41 Middle East and Africa Jewelry Revenue (USD Million) By Region (2023-2030)
Figure 42 Middle East and Africa Jewelry Revenue (USD Million) By Region (2023-2030)
Figure 43 Middle East and Africa Jewelry Revenue (USD Million) By Type (2023-2030)
Figure 44 Middle East and Africa Jewelry Revenue (USD Million) By Applications (2023-2030)
Figure 45 Bottom-Up and Top-Down Approaches for This Report
Figure 46 Data Triangulation
