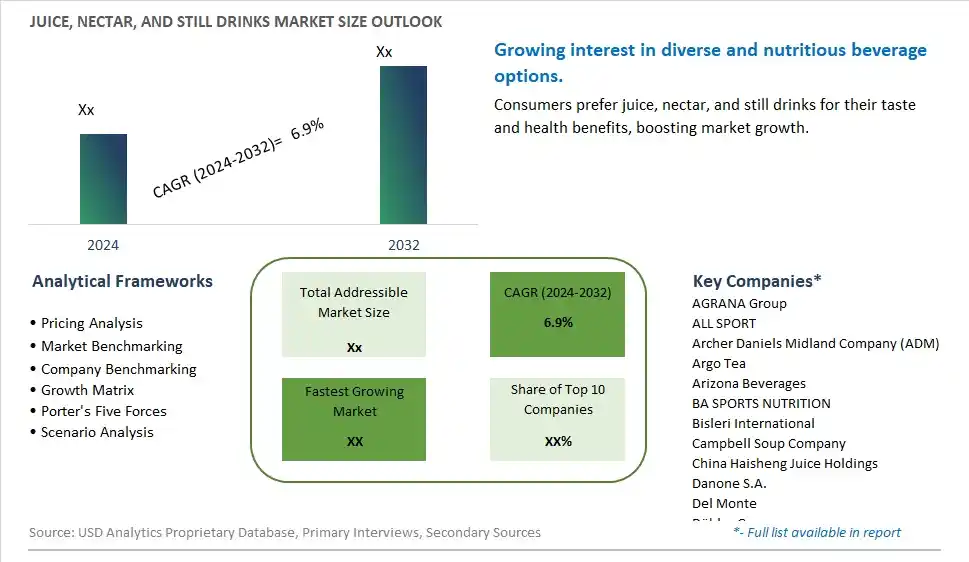
Global Juice, Nectar, and Still Drinks Market Size is valued at $XX Million in 2024 and is forecast to register a growth rate (CAGR) of 6.9% to reach $XX Million by 2032.
The global Juice, Nectar, and Still Drinks Market Comprehensive Study analyzes and forecasts the market size across 6 regions and 24 countries for diverse segments -By Type (Juice Drinks, Nectar, Still Drinks), By Application (Supermarkets/Hypermarkets, Independent Retailer, Convenience Stores, Others)
An Introduction to Juice, Nectar, and Still Drinks Market
The Juice, Nectar, and Still Drinks Market involves the production and sale of beverages made from fruits and vegetables, including 100% juices, juice blends, nectars, and non-carbonated still drinks. The market is driven by increasing consumer demand for healthy and natural beverages, rising awareness about the benefits of fruit and vegetable consumption, and growing popularity of functional and fortified drinks. Additionally, advancements in beverage processing technologies and the expansion of product offerings support market growth.
Juice, Nectar and Still Drinks Competitive Landscape
The market report analyses the leading companies in the industry including AGRANA Group, ALL SPORT, Archer Daniels Midland Company (ADM), Argo Tea, Arizona Beverages, BA SPORTS NUTRITION, Bisleri International, Campbell Soup Company, China Haisheng Juice Holdings, Danone S.A., Del Monte, Döhler Group, Dr Pepper Snapple Group, F&N Foods, Genesis Today, Kanegrade, Kerry Group Plc, Lucozade Ribena, Nestlé SA, Nongfu Spring, PepsiCo Inc, POM Wonderful, SkyPeople Fruit Juice, SunOpta Inc, Tetra Pak, The Coca-Cola Company, and Others.
Juice, Nectar and Still Drinks Market Dynamics
Juice, Nectar, and Still Drinks Market Trend: Increasing Demand for Healthier Beverage Options
The most prominent trend in the Juice, Nectar, and Still Drinks Market is the increasing demand for healthier beverage options. Consumers are becoming more health-conscious and are seeking beverages that offer natural ingredients, reduced sugar content, and added nutritional benefits. This trend is driven by a growing awareness of the health impacts of sugary drinks and a preference for beverages that contribute to overall well-being.
Juice, Nectar, and Still Drinks Market Driver: Innovation in Product Formulation and Packaging
A key driver in the Juice, Nectar, and Still Drinks Market is innovation in product formulation and packaging. Manufacturers are developing new products that cater to health trends, such as cold-pressed juices, fortified beverages, and functional drinks with added vitamins and minerals. Innovative packaging solutions, such as single-serve and eco-friendly options, also play a crucial role in attracting health-conscious consumers and supporting market growth.
Juice, Nectar, and Still Drinks Market Opportunity: Expansion into Premium and Functional Beverage Segments
One significant opportunity in the Juice, Nectar, and Still Drinks Market lies in the expansion into premium and functional beverage segments. There is potential for developing high-quality, premium products that offer unique flavors, organic ingredients, and functional benefits. Companies that focus on creating innovative and health-oriented beverages can attract a discerning consumer base and drive market growth through differentiation and added value.
Juice, Nectar, and Still Drinks Market Share Analysis- Largest Segment by Type
The Juice Drinks segment is the largest in the Juice, Nectar, and Still Drinks Market by type. This dominance is driven by the high consumer demand for convenient and refreshing beverages that offer a balance of flavor and nutrition. Juice drinks, which often contain a blend of fruit juice and water with added vitamins and minerals, are popular among health-conscious consumers and those seeking a quick and tasty hydration option. The continuous innovation in juice drink formulations, including the introduction of new flavors and functional ingredients, enhances their appeal. Additionally, the growing trend of health and wellness supports the significant market share of the juice drinks segment, as consumers seek beverages that provide both refreshment and health benefits. The extensive availability of juice drinks in supermarkets, convenience stores, and online platforms further boosts their accessibility to a broad consumer base. The strong consumer preference for versatile and nutritious beverages reinforces the dominant position of the juice drinks segment in the market.
Juice, Nectar, and Still Drinks Market Share Analysis- Fastest Growing Segment by Application
The Online Stores segment is poised to grow the fastest in the Juice, Nectar, and Still Drinks Market by application over the next five years. This rapid growth is driven by the increasing consumer shift towards online shopping and the convenience it offers. E-commerce platforms provide a wide variety of juice, nectar, and still drink products, including niche and specialty items that may not be readily available in physical stores. The convenience of browsing and purchasing from home, coupled with the option of home delivery, appeals to a broad range of consumers. The COVID-19 pandemic has further accelerated the adoption of online shopping, and this trend continues as consumers appreciate the safety and convenience of having products delivered to their doorstep. Additionally, online retailers often offer competitive pricing, detailed product information, and customer reviews, which further drive consumer confidence and sales. The growth of digital marketing and targeted online advertisements also boosts the visibility and sales of juice, nectar, and still drinks through e-commerce channels.
Juice, Nectar and Still Drinks Market Segmentation
By Type
Juice Drinks
Nectar
Still Drinks
By Application
Supermarkets/Hypermarkets
Independent Retailer
Convenience Stores
Others
Countries Analyzed
North America (US, Canada, Mexico)
Europe (Germany, UK, France, Spain, Italy, Russia, Rest of Europe)
Asia Pacific (China, India, Japan, South Korea, Australia, South East Asia, Rest of Asia)
South America (Brazil, Argentina, Rest of South America)
Middle East and Africa (Saudi Arabia, UAE, Rest of Middle East, South Africa, Egypt, Rest of Africa)
Juice, Nectar and Still Drinks Companies Profiled in the Study
AGRANA Group
ALL SPORT
Archer Daniels Midland Company (ADM)
Argo Tea
Arizona Beverages
BA SPORTS NUTRITION
Bisleri International
Campbell Soup Company
China Haisheng Juice Holdings
Danone S.A.
Del Monte
Döhler Group
Dr Pepper Snapple Group
F&N Foods
Genesis Today
Kanegrade
Kerry Group Plc
Lucozade Ribena
Nestlé SA
Nongfu Spring
PepsiCo Inc
POM Wonderful
SkyPeople Fruit Juice
SunOpta Inc
Tetra Pak
The Coca-Cola Company
*- List Not Exhaustive
Chapter 1. TABLE OF CONTENTS
Chapter 2. Introduction to Juice, Nectar and Still Drinks Market
2.1. Market Overview
2.2. Key Statistics and Report Highlights
2.3. Scope of the Comprehensive Study
2.3.1. Market Definition
2.3.2 Countries and Regions Covered
2.3.3 Research Objective
2.3.4 Units, Currency, and Conversions
2.3.5 Industry Value Chain
2.4. Key Market Segments
2.5. Key Companies
2.6. Study Period
Chapter 3. Strategic Analysis Review
3.1. Juice, Nectar and Still Drinks Pricing Analysis and Forecast
3.2. Porter’s Five Forces
3.3. Market Ecosystem
3.4. SWOT Analysis
3.5. Regulatory Scenario
3.3. Effects of Inflation, Russia-Ukraine War, moderating economic growth, and other macroeconomic factors
Chapter 4. Competitive Landscape
4.1. Market Share Analysis
4.1.1. Global Juice, Nectar and Still Drinks Market Share by Company, 2023
4.1.2. Product Offerings of Leading Juice, Nectar and Still Drinks Companies
4.2. Market Entropy
4.2.1. New Product Launches in the Industry
4.2.2. Mergers, Acquisitions, Joint ventures, and Partnerships
4.3. Key Strategies and Best Practices
Chapter 5. Global Market Projections: Best, Reference, and Low Case Scenarios
5.1. Growth Analysis- Case Scenario Definitions
5.2. Low Growth Case Scenario Forecasts
5.3. Reference Growth Case Scenario Forecasts
5.4. High Growth Case Scenario Forecasts
Chapter 6. Market Dynamics
6.1. Juice, Nectar and Still Drinks Market Drivers
6.2. Juice, Nectar and Still Drinks Market Challenges
6.6. Juice, Nectar and Still Drinks Market Opportunities
6.4. Juice, Nectar and Still Drinks Market Trends
Chapter 7. Global Juice, Nectar and Still Drinks Market Outlook Trends
7.1. Global Juice, Nectar and Still Drinks Revenue (USD Million) and CAGR (%) by Type (2021-2032)
7.2. Global Juice, Nectar and Still Drinks Revenue (USD Million) and CAGR (%) by Application (2021-2032)
7.3. Global Juice, Nectar and Still Drinks Revenue (USD Million) and CAGR (%) by Product (2021-2032)
By Type
Juice Drinks
Nectar
Still Drinks
By Application
Supermarkets/Hypermarkets
Independent Retailer
Convenience Stores
Others
Chapter 8. Global Juice, Nectar and Still Drinks Regional Analysis and Outlook
8.1. Global Juice, Nectar and Still Drinks Revenue (USD Million) By Regions (2021- 2032)
8.2. North America Juice, Nectar and Still Drinks Revenue (USD Million) by Country (2021-2032)
8.2.1. United States Juice, Nectar and Still Drinks Regional Analysis and Outlook
8.2.2. Canada Juice, Nectar and Still Drinks Regional Analysis and Outlook
8.2.3. Mexico Juice, Nectar and Still Drinks Regional Analysis and Outlook
8.3. Europe Juice, Nectar and Still Drinks Revenue (USD Million), by Country (2021-2032)
8.3.1. Germany Juice, Nectar and Still Drinks Regional Analysis and Outlook
8.3.2. France Juice, Nectar and Still Drinks Regional Analysis and Outlook
8.3.3. United Kingdom Juice, Nectar and Still Drinks Regional Analysis and Outlook
8.3.4. Spain Juice, Nectar and Still Drinks Regional Analysis and Outlook
8.3.5. Italy Juice, Nectar and Still Drinks Regional Analysis and Outlook
8.3.6. Russia Juice, Nectar and Still Drinks Regional Analysis and Outlook
8.3.7. Rest of Europe Juice, Nectar and Still Drinks Regional Analysis and Outlook
8.4. Asia Pacific Juice, Nectar and Still Drinks Revenue (USD Million) by Country (2021-2032)
8.4.1. China Juice, Nectar and Still Drinks Regional Analysis and Outlook
8.4.2. Japan Juice, Nectar and Still Drinks Regional Analysis and Outlook
8.4.3. India Juice, Nectar and Still Drinks Regional Analysis and Outlook
8.4.4. South Korea Juice, Nectar and Still Drinks Regional Analysis and Outlook
8.4.5. Australia Juice, Nectar and Still Drinks Regional Analysis and Outlook
8.4.6. South East Asia Juice, Nectar and Still Drinks Regional Analysis and Outlook
8.4.7. Rest of Asia Pacific Juice, Nectar and Still Drinks Regional Analysis and Outlook
8.5. South America Juice, Nectar and Still Drinks Revenue (USD Million), by Country (2021-2032)
8.5.1. Brazil Juice, Nectar and Still Drinks Regional Analysis and Outlook
8.5.2. Argentina Juice, Nectar and Still Drinks Regional Analysis and Outlook
8.5.3. Rest of South America Juice, Nectar and Still Drinks Regional Analysis and Outlook
8.6. Middle East and Africa Juice, Nectar and Still Drinks Revenue (USD Million) by Country (2021-2032)
8.6.1. Middle East Juice, Nectar and Still Drinks Regional Analysis and Outlook
8.6.2. Africa Juice, Nectar and Still Drinks Regional Analysis and Outlook
Chapter 9. North America Juice, Nectar and Still Drinks Analysis and Outlook
9.1. North America Juice, Nectar and Still Drinks Revenue (USD Million) by Segments (2021-2032)
9.1.1. North America Juice, Nectar and Still Drinks Revenue (USD Million) by Type (2021-2032)
9.1.2. North America Juice, Nectar and Still Drinks Revenue (USD Million) by Application (2021-2032)
9.1.3. North America Juice, Nectar and Still Drinks Revenue (USD Million) by Product (2021-2032)
By Type
Juice Drinks
Nectar
Still Drinks
By Application
Supermarkets/Hypermarkets
Independent Retailer
Convenience Stores
Others
Chapter 10. Europe Juice, Nectar and Still Drinks Analysis and Outlook
10.1. Europe Juice, Nectar and Still Drinks Revenue (USD Million), by Segments (USD Million) (2021-2032)
10.1.1. Europe Juice, Nectar and Still Drinks Revenue (USD Million) by Type (2021-2032)
10.1.2. Europe Juice, Nectar and Still Drinks Revenue (USD Million) by Application (2021-2032)
10.1.3. Europe Juice, Nectar and Still Drinks Revenue (USD Million) by Product (2021-2032)
By Type
Juice Drinks
Nectar
Still Drinks
By Application
Supermarkets/Hypermarkets
Independent Retailer
Convenience Stores
Others
Chapter 11. Asia Pacific Juice, Nectar and Still Drinks Analysis and Outlook
11.1. Asia Pacific Juice, Nectar and Still Drinks Revenue (USD Million), and Revenue (USD Million) by Segments (2021-2032)
11.1.1. Asia Pacific Juice, Nectar and Still Drinks Revenue (USD Million) by Type (2021-2032)
11.1.2. Asia Pacific Juice, Nectar and Still Drinks Revenue (USD Million) by Application (2021-2032)
11.1.3. Asia Pacific Juice, Nectar and Still Drinks Revenue (USD Million) by Product (2021-2032)
By Type
Juice Drinks
Nectar
Still Drinks
By Application
Supermarkets/Hypermarkets
Independent Retailer
Convenience Stores
Others
Chapter 12. South America Juice, Nectar and Still Drinks Analysis and Outlook
12.1. South America Juice, Nectar and Still Drinks Revenue (USD Million), by Segments (2021-2032)
12.1.1. South America Juice, Nectar and Still Drinks Revenue (USD Million) by Type (2021-2032)
12.1.2. South America Juice, Nectar and Still Drinks Revenue (USD Million) by Application (2021-2032)
12.1.3. South America Juice, Nectar and Still Drinks Revenue (USD Million) by Product (2021-2032)
By Type
Juice Drinks
Nectar
Still Drinks
By Application
Supermarkets/Hypermarkets
Independent Retailer
Convenience Stores
Others
Chapter 13. Middle East and Africa Juice, Nectar and Still Drinks Analysis and Outlook
13.1. Middle East and Africa Juice, Nectar and Still Drinks Revenue (USD Million), by Segments (2021-2032)
13.1.1. Middle East and Africa Juice, Nectar and Still Drinks Revenue (USD Million) by Type (2021-2032)
13.1.2. Middle East and Africa Juice, Nectar and Still Drinks Revenue (USD Million) by Application (2021-2032)
13.1.3. Middle East and Africa Juice, Nectar and Still Drinks Revenue (USD Million) by Product (2021-2032)
By Type
Juice Drinks
Nectar
Still Drinks
By Application
Supermarkets/Hypermarkets
Independent Retailer
Convenience Stores
Others
Chapter 14. Juice, Nectar and Still Drinks Company Profiles
14.1 Business Overview
14.2 Product Profiles
14.3 SWOT Profiles
14.5 Recent Developments
14.6 Financial Profile
List of Companies
AGRANA Group
ALL SPORT
Archer Daniels Midland Company (ADM)
Argo Tea
Arizona Beverages
BA SPORTS NUTRITION
Bisleri International
Campbell Soup Company
China Haisheng Juice Holdings
Danone S.A.
Del Monte
Döhler Group
Dr Pepper Snapple Group
F&N Foods
Genesis Today
Kanegrade
Kerry Group Plc
Lucozade Ribena
Nestlé SA
Nongfu Spring
PepsiCo Inc
POM Wonderful
SkyPeople Fruit Juice
SunOpta Inc
Tetra Pak
The Coca-Cola Company
15. Methodology and Data Sources
15.1 Customization Offerings
15.2 Subscription Services
15.3 Related Reports
15.4 Publisher Expertise
LIST OF TABLES
Table 1 Market Segmentation Analysis
Table 2 Global Juice, Nectar and Still Drinks Market Share of Leading Companies, 2023
Table 3 Product Offerings of Leading Companies
Table 4 Low Growth Scenario Forecasts
Table 5 Reference Case Growth Scenario
Table 6 High Growth Case Scenario
Table 7 Global Juice, Nectar and Still Drinks Revenue (USD Million) And CAGR (%) By Type (2021-2032)
Table 8 Global Juice, Nectar and Still Drinks Revenue (USD Million) And CAGR (%) By Application (2021-2032)
Table 9 Global Juice, Nectar and Still Drinks Revenue (USD Million) And CAGR (%) By Product (2021-2032)
Table 10 Global Juice, Nectar and Still Drinks Market Revenue (USD Million) By Regions (2021-2032)
Table 11 Global Juice, Nectar and Still Drinks Market Share (%) By Regions (2021-2032)
Table 12 North America Juice, Nectar and Still Drinks Revenue (USD Million) By Country (2021-2032)
Table 13 Europe Juice, Nectar and Still Drinks Revenue (USD Million) By Country (2021-2032)
Table 14 Asia Pacific Juice, Nectar and Still Drinks Revenue (USD Million) By Country (2021-2032)
Table 15 South America Juice, Nectar and Still Drinks Revenue (USD Million) By Country (2021-2032)
Table 16 Middle East and Africa Juice, Nectar and Still Drinks Revenue (USD Million) By Region (2021-2032)
Table 17 North America Juice, Nectar and Still Drinks Revenue (USD Million) By Type (2021-2032)
Table 18 North America Juice, Nectar and Still Drinks Revenue (USD Million) By Application (2021-2032)
Table 19 North America Juice, Nectar and Still Drinks Revenue (USD Million) By Product (2021-2032)
Table 20 Europe Juice, Nectar and Still Drinks Revenue (USD Million) By Type (2021-2032)
Table 21 Europe Juice, Nectar and Still Drinks Revenue (USD Million) By Application (2021-2032)
Table 22 Europe Juice, Nectar and Still Drinks Revenue (USD Million) By Product (2021-2032)
Table 23 Asia Pacific Juice, Nectar and Still Drinks Revenue (USD Million) By Type (2021-2032)
Table 24 Asia Pacific Juice, Nectar and Still Drinks Revenue (USD Million) By Application (2021-2032)
Table 25 Asia Pacific Juice, Nectar and Still Drinks Revenue (USD Million) By Product (2021-2032)
Table 26 South America Juice, Nectar and Still Drinks Revenue (USD Million) By Type (2021-2032)
Table 27 South America Juice, Nectar and Still Drinks Revenue (USD Million) By Application (2021-2032)
Table 28 South America Juice, Nectar and Still Drinks Revenue (USD Million) By Product (2021-2032)
Table 29 Middle East and Africa Juice, Nectar and Still Drinks Revenue (USD Million) By Type (2021-2032)
Table 30 Middle East and Africa Juice, Nectar and Still Drinks Revenue (USD Million) By Application (2021-2032)
Table 31 Middle East and Africa Juice, Nectar and Still Drinks Revenue (USD Million) By Product (2021-2032)
LIST OF FIGURES
Figure 1. Market Scope
Figure 2. Pricing Forecasts Per Unit, 2023- 2032
Figure 3. Porter’s Five Forces
Figure 4. Global Juice, Nectar and Still Drinks Market Revenue (USD Million) By Regions (2021-2032)
Figure 5. Global Juice, Nectar and Still Drinks Market Share (%) By Regions (2023)
Figure 6. North America Juice, Nectar and Still Drinks Revenue (USD Million) By Country (2021-2032)
Figure 7. United States Juice, Nectar and Still Drinks Revenue (USD Million) By Country (2021-2032)
Figure 8. Canada Juice, Nectar and Still Drinks Revenue (USD Million) By Country (2021-2032)
Figure 9. Mexico Juice, Nectar and Still Drinks Revenue (USD Million) By Country (2021-2032)
Figure 10. Europe Juice, Nectar and Still Drinks Revenue (USD Million) By Country (2021-2032)
Figure 11. Germany Juice, Nectar and Still Drinks Revenue (USD Million) By Country (2021-2032)
Figure 12. France Juice, Nectar and Still Drinks Revenue (USD Million) By Country (2021-2032)
Figure 13. United Kingdom Juice, Nectar and Still Drinks Revenue (USD Million) By Country (2021-2032)
Figure 14. Spain Juice, Nectar and Still Drinks Revenue (USD Million) By Country (2021-2032)
Figure 15. Italy Juice, Nectar and Still Drinks Revenue (USD Million) By Country (2021-2032)
Figure 16. Russia Juice, Nectar and Still Drinks Revenue (USD Million) By Country (2021-2032)
Figure 17. Rest of Europe Juice, Nectar and Still Drinks Revenue (USD Million) By Country (2021-2032)
Figure 11. Asia Pacific Juice, Nectar and Still Drinks Revenue (USD Million) By Country (2021-2032)
Figure 12. China Juice, Nectar and Still Drinks Revenue (USD Million) By Country (2021-2032)
Figure 13. Japan Juice, Nectar and Still Drinks Revenue (USD Million) By Country (2021-2032)
Figure 14. India Juice, Nectar and Still Drinks Revenue (USD Million) By Country (2021-2032)
Figure 15. South Korea Juice, Nectar and Still Drinks Revenue (USD Million) By Country (2021-2032)
Figure 16. Australia Juice, Nectar and Still Drinks Revenue (USD Million) By Country (2021-2032)
Figure 17. South East Asia Juice, Nectar and Still Drinks Revenue (USD Million) By Country (2021-2032)
Figure 18. South America Juice, Nectar and Still Drinks Revenue (USD Million) By Country (2021-2032)
Figure 19. Brazil Juice, Nectar and Still Drinks Revenue (USD Million) By Country (2021-2032)
Figure 20. Argentina Juice, Nectar and Still Drinks Revenue (USD Million) By Country (2021-2032)
Figure 21. Rest of Asia Pacific Juice, Nectar and Still Drinks Revenue (USD Million) By Country (2021-2032)
Figure 22. Middle East and Africa Juice, Nectar and Still Drinks Revenue (USD Million) By Region (2021-2032)
Figure 23. Saudi Arabia Juice, Nectar and Still Drinks Revenue (USD Million) By Region (2021-2032)
Figure 24. The UAE Juice, Nectar and Still Drinks Revenue (USD Million) By Region (2021-2032)
Figure 25. Rest of Middle East Juice, Nectar and Still Drinks Revenue (USD Million) By Region (2021-2032)
Figure 26. South Africa Juice, Nectar and Still Drinks Revenue (USD Million) By Region (2021-2032)
Figure 27. Africa Juice, Nectar and Still Drinks Revenue (USD Million) By Region (2021-2032)
Figure 28. North America Juice, Nectar and Still Drinks Revenue (USD Million) By Type (2021-2032)
Figure 29. North America Juice, Nectar and Still Drinks Revenue (USD Million) By Application (2021-2032)
Figure 30. North America Juice, Nectar and Still Drinks Revenue (USD Million) By Product (2021-2032)
Figure 31. Europe Juice, Nectar and Still Drinks Revenue (USD Million) By Type (2021-2032)
Figure 32. Europe Juice, Nectar and Still Drinks Revenue (USD Million) By Application (2021-2032)
Figure 33. Europe Juice, Nectar and Still Drinks Revenue (USD Million) By Product (2021-2032)
Figure 34. Asia Pacific Juice, Nectar and Still Drinks Revenue (USD Million) By Type (2021-2032)
Figure 35. Asia Pacific Juice, Nectar and Still Drinks Revenue (USD Million) By Application (2021-2032)
Figure 36. Asia Pacific Juice, Nectar and Still Drinks Revenue (USD Million) By Product (2021-2032)
Figure 37. South America Juice, Nectar and Still Drinks Revenue (USD Million) By Type (2021-2032)
Figure 38. South America Juice, Nectar and Still Drinks Revenue (USD Million) By Application (2021-2032)
Figure 39. South America Juice, Nectar and Still Drinks Revenue (USD Million) By Product (2021-2032)
Figure 40. Middle East and Africa Juice, Nectar and Still Drinks Revenue (USD Million) By Type (2021-2032)
Figure 41. Middle East and Africa Juice, Nectar and Still Drinks Revenue (USD Million) By Application (2021-2032)
Figure 42. Middle East and Africa Juice, Nectar and Still Drinks Revenue (USD Million) By Product (2021-2032)
By Type
Juice Drinks
Nectar
Still Drinks
By Application
Supermarkets/Hypermarkets
Independent Retailer
Convenience Stores
Others
Countries Analyzed
North America (US, Canada, Mexico)
Europe (Germany, UK, France, Spain, Italy, Russia, Rest of Europe)
Asia Pacific (China, India, Japan, South Korea, Australia, South East Asia, Rest of Asia)
South America (Brazil, Argentina, Rest of South America)
Middle East and Africa (Saudi Arabia, UAE, Rest of Middle East, South Africa, Egypt, Rest of Africa)
