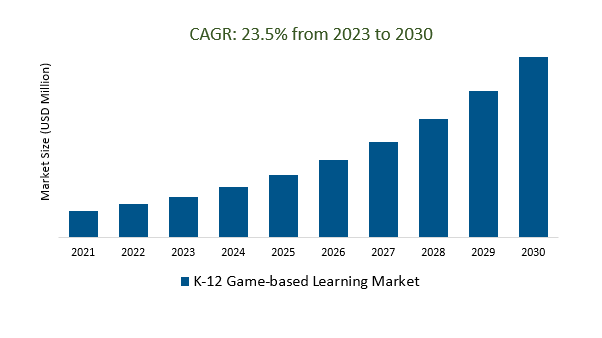
The Global K-12 Game-based Learning Market Size is estimated to register 23.5% growth over the forecast period from 2023 to 2030.
The market growth is driven by an increasing integration of technology into K-12 education is a significant driver for game-based learning. Schools are increasingly investing in digital tools and platforms, including educational games, to enhance the learning experience. Leading Companies focusing on Technological Advancements, Increased Content Diversity, Mobile and Cloud-Based Solutions, Gamification in Assessment, Integration with Learning Management Systems, and others to boost market shares in the industry.
Market Overview
The K-12 Game-based Learning Market focuses on the use of educational games and gamified experiences in kindergarten through 12th-grade education, offering engaging, personalized learning solutions that enhance student engagement and problem-solving skills. Key stakeholders include educational institutions, EdTech companies, teachers, and students, with educational games and gamified learning platforms being primary offerings. Despite challenges related to integration and teacher training, the market is growing, driven by technological advancements, mobile and cloud-based solutions, and a recognition of its potential to improve learning outcomes and develop essential skills in students, making it a promising sector within the educational technology landscape.
Market Dynamics
Market Trends- Gamifying education in K-12 schools creates engaging and effective learning experiences.
Gamifying education in K-12 schools incorporates game elements to create engaging and effective learning experiences. It motivates students with rewards, interactive challenges, and immediate feedback, enhancing their problem-solving and critical thinking skills, fostering competition, and offering personalized learning opportunities. This approach is increasingly recognized as a powerful tool for improving student engagement and learning outcomes.
Market Driver- EdTech startups are innovating to meet the growing demand for K-12 game-based learning solutions
EdTech startups are actively innovating to cater to the rising demand for K-12 game-based learning solutions within the educational landscape. As the adoption of technology in schools continues to increase, these startups are pioneering creative approaches to develop interactive and curriculum-aligned educational games that engage and educate students effectively. Their innovative solutions leverage advancements in technology, including augmented reality, virtual reality, and artificial intelligence, to provide a diverse range of game-based learning experiences.
Market Opportunity- Equipping K-12 teachers with the knowledge and skills to implement game-based learning effectively.
Equipping K-12 teachers with the knowledge and skills to effectively implement game-based learning is essential for maximizing its benefits, encompassing understanding the educational advantages, resource selection, curriculum alignment, classroom management, and data-driven instruction refinement. This preparation is pivotal in enhancing student engagement and learning outcomes.
Market Share Analysis- Simulation Games K-12 Game-based Learning Market will register the fastest growth
The Global K-12 Game-based Learning Market is analyzed across Flashcard Games, Simulation Games, Quiz Games, Puzzles, and others. Simulation Games is poised to register the fastest growth. Simulation games form a significant part of the K-12 Game-based Learning Market, offering immersive, hands-on learning experiences across various subjects. These games create virtual environments that simulate real-world scenarios, encouraging students to apply theoretical knowledge to practical situations, fostering critical thinking and skill development in K-12 education.
Market Share Analysis- Pre-Primary held a significant market share in 2023
The Global K-12 Game-based Learning Market is analyzed across various applications including Pre-Primary, Primary, High School, and others. Of these, Pre-Primary held a significant market share in 2023. The Pre-Primary K-12 Game-based Learning Market caters to students from early childhood education to 12th grade, offering age-appropriate educational games and interactive tools that focus on foundational skills, early literacy, numeracy, and socio-emotional development. This sector provides engaging learning solutions for younger students, setting a strong educational foundation as technology integration in education continues to grow.
K-12 Game-based Learning Market Segmentation
By Type
- Flashcard Games
- Simulation Games
- Quiz Games
- Puzzles
- Others
By Application
- Pre-Primary
- Primary
- High School
By Platform
By End User
- Consumer
- Government
- Enterprises
By Region
- North America (United States, Canada, Mexico)
- Europe (Germany, France, United Kingdom, Spain, Italy, Others)
- Asia Pacific (China, India, Japan, South Korea, Australia, Others)
- Latin America (Brazil, Argentina, Others)
- Middle East and Africa (Saudi Arabia, UAE, Kuwait, Other Middle East, South Africa, Nigeria, Other Africa)
K-12 Game-based Learning Market Companies
- BrainPOP (United States)
- Quizlet (United States)
- Classcraft (Canada)
- Kahoot (Norway)
- Nearpod (United States)
- Legends of Learning (United States)
- Classcraft (Canada)
- Minecraft Education (United States)
- Breakout EDU (United States)
- Prodigy (Canada)
*List not exhaustive
K-12 Game-based Learning Market Outlook 2023
1 Market Overview
1.1 Introduction to the K-12 Game-based Learning Market
1.2 Scope of the Study
1.3 Research Objective
1.3.1 Key Market Scope and Segments
1.3.2 Players Covered
1.3.3 Years Considered
2 Executive Summary
2.1 2023 K-12 Game-based Learning Industry- Market Statistics
3 Market Dynamics
3.1 Market Drivers
3.2 Market Challenges
3.3 Market Opportunities
3.4 Market Trends
4 Market Factor Analysis
4.1 Porter’s Five Forces
4.2 Market Entropy
4.2.1 Global K-12 Game-based Learning Market Companies with Area Served
4.2.2 Products Offerings Global K-12 Game-based Learning Market
5 COVID-19 Impact Analysis and Outlook Scenarios
5.1.1 Covid-19 Impact Analysis
5.1.2 Post-COVID-19 Scenario- Low Growth Case
5.1.3 Post-COVID-19 Scenario- Reference Growth Case
5.1.4 Post-COVID-19 Scenario- Low Growth Case
6 Global K-12 Game-based Learning Market Trends
6.1 Global K-12 Game-based Learning Revenue (USD Million) and CAGR (%) by Type (2018-2030)
6.2 Global K-12 Game-based Learning Revenue (USD Million) and CAGR (%) by Applications (2018-2030)
6.3 Global K-12 Game-based Learning Revenue (USD Million) and CAGR (%) by Regions (2018-2030)
7 Global K-12 Game-based Learning Market Revenue (USD Million) by Type, and Applications (2018-2022)
7.1 Global K-12 Game-based Learning Revenue (USD Million) by Type (2018-2022)
7.1.1 Global K-12 Game-based Learning Revenue (USD Million), Market Share (%) by Type (2018-2022)
7.2 Global K-12 Game-based Learning Revenue (USD Million) by Applications (2018-2022)
7.2.1 Global K-12 Game-based Learning Revenue (USD Million), Market Share (%) by Applications (2018-2022)
8 Global K-12 Game-based Learning Development Regional Status and Outlook
8.1 Global K-12 Game-based Learning Revenue (USD Million) By Regions (2018-2022)
8.2 North America K-12 Game-based Learning Revenue (USD Million) by Type, and Application (2018-2022)
8.2.1 North America K-12 Game-based Learning Revenue (USD Million) by Country (2018-2022)
8.2.2 North America K-12 Game-based Learning Revenue (USD Million) by Type (2018-2022)
8.2.3 North America K-12 Game-based Learning Revenue (USD Million) by Applications (2018-2022)
8.3 Europe K-12 Game-based Learning Revenue (USD Million), by Type, and Applications (USD Million) (2018-2022)
8.3.1 Europe K-12 Game-based Learning Revenue (USD Million), by Country (2018-2022)
8.3.2 Europe K-12 Game-based Learning Revenue (USD Million) by Type (2018-2022)
8.3.3 Europe K-12 Game-based Learning Revenue (USD Million) by Applications (2018-2022)
8.4 Asia Pacific K-12 Game-based Learning Revenue (USD Million), and Revenue (USD Million) by Type, and Applications (2018-2022)
8.4.1 Asia Pacific K-12 Game-based Learning Revenue (USD Million) by Country (2018-2022)
8.4.2 Asia Pacific K-12 Game-based Learning Revenue (USD Million) by Type (2018-2022)
8.4.3 Asia Pacific K-12 Game-based Learning Revenue (USD Million) by Applications (2018-2022)
8.5 South America K-12 Game-based Learning Revenue (USD Million), by Type, and Applications (2018-2022)
8.5.1 South America K-12 Game-based Learning Revenue (USD Million), by Country (2018-2022)
8.5.2 South America K-12 Game-based Learning Revenue (USD Million) by Type (2018-2022)
8.5.3 South America K-12 Game-based Learning Revenue (USD Million) by Applications (2018-2022)
8.6 Middle East and Africa K-12 Game-based Learning Revenue (USD Million), by Type, Technology, Application, Thickness (2018-2022)
8.6.1 Middle East and Africa K-12 Game-based Learning Revenue (USD Million) by Country (2018-2022)
8.6.2 Middle East and Africa K-12 Game-based Learning Revenue (USD Million) by Type (2018-2022)
8.6.3 Middle East and Africa K-12 Game-based Learning Revenue (USD Million) by Applications (2018-2022)
9 Company Profiles
10 Global K-12 Game-based Learning Market Revenue (USD Million), by Type, and Applications (2023-2030)
10.1 Global K-12 Game-based Learning Revenue (USD Million) and Market Share (%) by Type (2023-2030)
10.1.1 Global K-12 Game-based Learning Revenue (USD Million), and Market Share (%) by Type (2023-2030)
10.2 Global K-12 Game-based Learning Revenue (USD Million) and Market Share (%) by Applications (2023-2030)
10.2.1 Global K-12 Game-based Learning Revenue (USD Million), and Market Share (%) by Applications (2023-2030)
11 Global K-12 Game-based Learning Development Regional Status and Outlook Forecast
11.1 Global K-12 Game-based Learning Revenue (USD Million) By Regions (2023-2030)
11.2 North America K-12 Game-based Learning Revenue (USD Million) by Type, and Applications (2023-2030)
11.2.1 North America K-12 Game-based Learning Revenue (USD) Million by Country (2023-2030)
11.2.2 North America K-12 Game-based Learning Revenue (USD Million), by Type (2023-2030)
11.2.3 North America K-12 Game-based Learning Revenue (USD Million), Market Share (%) by Applications (2023-2030)
11.3 Europe K-12 Game-based Learning Revenue (USD Million), by Type, and Applications (2023-2030)
11.3.1 Europe K-12 Game-based Learning Revenue (USD Million), by Country (2023-2030)
11.3.2 Europe K-12 Game-based Learning Revenue (USD Million), by Type (2023-2030)
11.3.3 Europe K-12 Game-based Learning Revenue (USD Million), by Applications (2023-2030)
11.4 Asia Pacific K-12 Game-based Learning Revenue (USD Million) by Type, and Applications (2023-2030)
11.4.1 Asia Pacific K-12 Game-based Learning Revenue (USD Million), by Country (2023-2030)
11.4.2 Asia Pacific K-12 Game-based Learning Revenue (USD Million), by Type (2023-2030)
11.4.3 Asia Pacific K-12 Game-based Learning Revenue (USD Million), by Applications (2023-2030)
11.5 South America K-12 Game-based Learning Revenue (USD Million), by Type, and Applications (2023-2030)
11.5.1 South America K-12 Game-based Learning Revenue (USD Million), by Country (2023-2030)
11.5.2 South America K-12 Game-based Learning Revenue (USD Million), by Type (2023-2030)
11.5.3 South America K-12 Game-based Learning Revenue (USD Million), by Applications (2023-2030)
11.6 Middle East and Africa K-12 Game-based Learning Revenue (USD Million), by Type, and Applications (2023-2030)
11.6.1 Middle East and Africa K-12 Game-based Learning Revenue (USD Million), by Region (2023-2030)
11.6.2 Middle East and Africa K-12 Game-based Learning Revenue (USD Million), by Type (2023-2030)
11.6.3 Middle East and Africa K-12 Game-based Learning Revenue (USD Million), by Applications (2023-2030)
12 Methodology and Data Sources
12.1 Methodology/Research Approach
12.1.1 Research Programs/Design
12.1.2 Market Size Estimation
12.1.3 Market Breakdown and Data Triangulation
12.2 Data Sources
12.2.1 Secondary Sources
12.2.2 Primary Sources
12.3 Disclaimer
List of Tables
Table 1 Market Segmentation Analysis
Table 2 Global K-12 Game-based Learning Market Companies with Areas Served
Table 3 Products Offerings Global K-12 Game-based Learning Market
Table 4 Low Growth Scenario Forecasts
Table 5 Reference Case Growth Scenario
Table 6 High Growth Case Scenario
Table 7 Global K-12 Game-based Learning Revenue (USD Million) And CAGR (%) By Type (2018-2030)
Table 8 Global K-12 Game-based Learning Revenue (USD Million) And CAGR (%) By Applications (2018-2030)
Table 9 Global K-12 Game-based Learning Revenue (USD Million) And CAGR (%) By Regions (2018-2030)
Table 10 Global K-12 Game-based Learning Revenue (USD Million) By Type (2018-2022)
Table 11 Global K-12 Game-based Learning Revenue Market Share (%) By Type (2018-2022)
Table 12 Global K-12 Game-based Learning Revenue (USD Million) By Applications (2018-2022)
Table 13 Global K-12 Game-based Learning Revenue Market Share (%) By Applications (2018-2022)
Table 14 Global K-12 Game-based Learning Market Revenue (USD Million) By Regions (2018-2022)
Table 15 Global K-12 Game-based Learning Market Share (%) By Regions (2018-2022)
Table 16 North America K-12 Game-based Learning Revenue (USD Million) By Country (2018-2022)
Table 17 North America K-12 Game-based Learning Revenue (USD Million) By Type (2018-2022)
Table 18 North America K-12 Game-based Learning Revenue (USD Million) By Applications (2018-2022)
Table 19 Europe K-12 Game-based Learning Revenue (USD Million) By Country (2018-2022)
Table 20 Europe K-12 Game-based Learning Revenue (USD Million) By Type (2018-2022)
Table 21 Europe K-12 Game-based Learning Revenue (USD Million) By Applications (2018-2022)
Table 22 Asia Pacific K-12 Game-based Learning Revenue (USD Million) By Country (2018-2022)
Table 23 Asia Pacific K-12 Game-based Learning Revenue (USD Million) By Type (2018-2022)
Table 24 Asia Pacific K-12 Game-based Learning Revenue (USD Million) By Applications (2018-2022)
Table 25 South America K-12 Game-based Learning Revenue (USD Million) By Country (2018-2022)
Table 26 South America K-12 Game-based Learning Revenue (USD Million) By Type (2018-2022)
Table 27 South America K-12 Game-based Learning Revenue (USD Million) By Applications (2018-2022)
Table 28 Middle East and Africa K-12 Game-based Learning Revenue (USD Million) By Region (2018-2022)
Table 29 Middle East and Africa K-12 Game-based Learning Revenue (USD Million) By Type (2018-2022)
Table 30 Middle East and Africa K-12 Game-based Learning Revenue (USD Million) By Applications (2018-2022)
Table 31 Financial Analysis
Table 32 Global K-12 Game-based Learning Revenue (USD Million) By Type (2023-2030)
Table 33 Global K-12 Game-based Learning Revenue Market Share (%) By Type (2023-2030)
Table 34 Global K-12 Game-based Learning Revenue (USD Million) By Applications (2023-2030)
Table 35 Global K-12 Game-based Learning Revenue Market Share (%) By Applications (2023-2030)
Table 36 Global K-12 Game-based Learning Market Revenue (USD Million), And Revenue (USD Million) By Regions (2023-2030)
Table 37 North America K-12 Game-based Learning Revenue (USD)By Country (2023-2030)
Table 38 North America K-12 Game-based Learning Revenue (USD Million) By Type (2023-2030)
Table 39 North America K-12 Game-based Learning Revenue (USD Million) By Applications (2023-2030)
Table 40 Europe K-12 Game-based Learning Revenue (USD Million) By Country (2023-2030)
Table 41 Europe K-12 Game-based Learning Revenue (USD Million) By Type (2023-2030)
Table 42 Europe K-12 Game-based Learning Revenue (USD Million) By Applications (2023-2030)
Table 43 Asia Pacific K-12 Game-based Learning Revenue (USD Million) By Country (2023-2030)
Table 44 Asia Pacific K-12 Game-based Learning Revenue (USD Million) By Type (2023-2030)
Table 45 Asia Pacific K-12 Game-based Learning Revenue (USD Million) By Applications (2023-2030)
Table 46 South America K-12 Game-based Learning Revenue (USD Million) By Country (2023-2030)
Table 47 South America K-12 Game-based Learning Revenue (USD Million) By Type (2023-2030)
Table 48 South America K-12 Game-based Learning Revenue (USD Million) By Applications (2023-2030)
Table 49 Middle East and Africa K-12 Game-based Learning Revenue (USD Million) By Region (2023-2030)
Table 50 Middle East and Africa K-12 Game-based Learning Revenue (USD Million) By Region (2023-2030)
Table 51 Middle East and Africa K-12 Game-based Learning Revenue (USD Million) By Type (2023-2030)
Table 52 Middle East and Africa K-12 Game-based Learning Revenue (USD Million) By Applications (2023-2030)
Table 53 Research Programs/Design for This Report
Table 54 Key Data Information from Secondary Sources
Table 55 Key Data Information from Primary Sources
List of Figures
Figure 1 Market Scope
Figure 2 Porter’s Five Forces
Figure 3 Global K-12 Game-based Learning Revenue (USD Million) By Type (2018-2022)
Figure 4 Global K-12 Game-based Learning Revenue Market Share (%) By Type (2022)
Figure 5 Global K-12 Game-based Learning Revenue (USD Million) By Applications (2018-2022)
Figure 6 Global K-12 Game-based Learning Revenue Market Share (%) By Applications (2022)
Figure 7 Global K-12 Game-based Learning Market Revenue (USD Million) By Regions (2018-2022)
Figure 8 Global K-12 Game-based Learning Market Share (%) By Regions (2022)
Figure 9 North America K-12 Game-based Learning Revenue (USD Million) By Country (2018-2022)
Figure 10 North America K-12 Game-based Learning Revenue (USD Million) By Type (2018-2022)
Figure 11 North America K-12 Game-based Learning Revenue (USD Million) By Applications (2018-2022)
Figure 12 Europe K-12 Game-based Learning Revenue (USD Million) By Country (2018-2022)
Figure 13 Europe K-12 Game-based Learning Revenue (USD Million) By Type (2018-2022)
Figure 14 Europe K-12 Game-based Learning Revenue (USD Million) By Applications (2018-2022)
Figure 15 Asia Pacific K-12 Game-based Learning Revenue (USD Million) By Country (2018-2022)
Figure 16 Asia Pacific K-12 Game-based Learning Revenue (USD Million) By Type (2018-2022)
Figure 17 Asia Pacific K-12 Game-based Learning Revenue (USD Million) By Applications (2018-2022)
Figure 18 South America K-12 Game-based Learning Revenue (USD Million) By Country (2018-2022)
Figure 19 South America K-12 Game-based Learning Revenue (USD Million) By Type (2018-2022)
Figure 20 South America K-12 Game-based Learning Revenue (USD Million) By Applications (2018-2022)
Figure 21 Middle East and Africa K-12 Game-based Learning Revenue (USD Million) By Region (2018-2022)
Figure 22 Middle East and Africa K-12 Game-based Learning Revenue (USD Million) By Type (2018-2022)
Figure 23 Middle East and Africa K-12 Game-based Learning Revenue (USD Million) By Applications (2018-2022)
Figure 24 Global K-12 Game-based Learning Revenue (USD Million) By Type (2023-2030)
Figure 25 Global K-12 Game-based Learning Revenue Market Share (%) By Type (2030)
Figure 26 Global K-12 Game-based Learning Revenue (USD Million) By Applications (2023-2030)
Figure 27 Global K-12 Game-based Learning Revenue Market Share (%) By Applications (2030)
Figure 28 Global K-12 Game-based Learning Market Revenue (USD Million) By Regions (2023-2030)
Figure 29 North America K-12 Game-based Learning Revenue (USD Million) By Country (2023-2030)
Figure 30 North America K-12 Game-based Learning Revenue (USD Million) By Type (2023-2030)
Figure 31 North America K-12 Game-based Learning Revenue (USD Million) By Applications (2023-2030)
Figure 32 Europe K-12 Game-based Learning Revenue (USD Million) By Country (2023-2030)
Figure 33 Europe K-12 Game-based Learning Revenue (USD Million) By Type (2023-2030)
Figure 34 Europe K-12 Game-based Learning Revenue (USD Million) By Applications (2023-2030)
Figure 35 Asia Pacific K-12 Game-based Learning Revenue (USD Million) By Country (2023-2030)
Figure 36 Asia Pacific K-12 Game-based Learning Revenue (USD Million) By Type (2023-2030)
Figure 37 Asia Pacific K-12 Game-based Learning Revenue (USD Million) By Applications (2023-2030)
Figure 38 South America K-12 Game-based Learning Revenue (USD Million) By Country (2023-2030)
Figure 39 South America K-12 Game-based Learning Revenue (USD Million) By Type (2023-2030)
Figure 40 South America K-12 Game-based Learning Revenue (USD Million) By Applications (2023-2030)
Figure 41 Middle East and Africa K-12 Game-based Learning Revenue (USD Million) By Region (2023-2030)
Figure 42 Middle East and Africa K-12 Game-based Learning Revenue (USD Million) By Region (2023-2030)
Figure 43 Middle East and Africa K-12 Game-based Learning Revenue (USD Million) By Type (2023-2030)
Figure 44 Middle East and Africa K-12 Game-based Learning Revenue (USD Million) By Applications (2023-2030)
Figure 45 Bottom-Up and Top-Down Approaches For This Report
Figure 46 Data Triangulation
