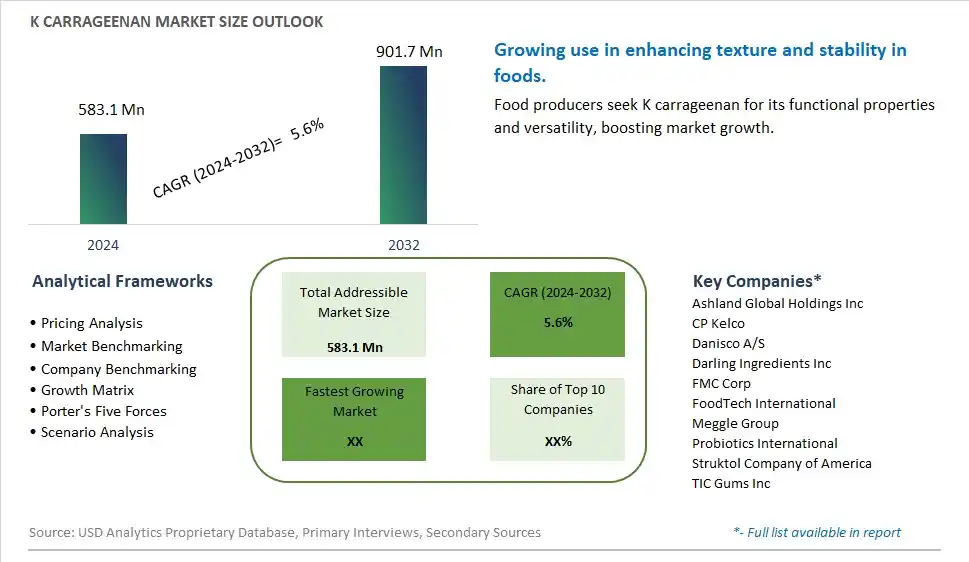
Global K Carrageenan Market Size is valued at $583.1 Million in 2024 and is forecast to register a growth rate (CAGR) of 5.6% to reach $901.7 Million by 2032.
The global K Carrageenan Market Comprehensive Study analyzes and forecasts the market size across 6 regions and 24 countries for diverse segments -By Product (Food Grade, Pharmaceutical Grade, Others), By Application (Food Industry, Cosmetics, Pharmaceutical, Biochemistry, Others), By Function (Thickener, Gelling Agent, Stabilizer, Others)
An Introduction to K Carrageenan Market
In 2024, the K carrageenan market is growing steadily, driven by its extensive use as a gelling, thickening, and stabilizing agent in the food and beverage industry. K carrageenan, derived from red seaweed, is valued for its ability to improve the texture and shelf life of various products, including dairy, meat, and plant-based alternatives. The market is witnessing innovations in sustainable sourcing and processing techniques that enhance the quality and functionality of K carrageenan. The trend towards clean label and natural ingredients is influencing market dynamics, with increasing demand for carrageenan in organic and non-GMO products.
K Carrageenan Competitive Landscape
The market report analyses the leading companies in the industry including Ashland Global Holdings Inc, CP Kelco, Danisco A/S, Darling Ingredients Inc, FMC Corp, FoodTech International, Meggle Group, Probiotics International, Struktol Company of America, TIC Gums Inc, and Others.
K Carrageenan Market Dynamics
K Carrageenan Market Trend: Rising Demand for Natural Food Additives
The most prominent trend in the K Carrageenan Market is the rising demand for natural food additives. Consumers are increasingly seeking out clean-label products with natural ingredients, leading to a higher demand for carrageenan, a natural polysaccharide derived from red seaweed, used as a gelling, thickening, and stabilizing agent in various food products.
K Carrageenan Market Driver: Growth of the Processed Food Industry
A key driver in the K Carrageenan Market is the growth of the processed food industry. As the demand for convenience foods such as ready-to-eat meals, dairy products, and meat products increases, so does the need for carrageenan as an essential ingredient that enhances texture, stability, and shelf life of these products.
K Carrageenan Market Opportunity: Innovation in Non-Food Applications
One significant opportunity in the K Carrageenan Market lies in innovation in non-food applications. Beyond its use in food, carrageenan is finding applications in pharmaceuticals, cosmetics, and personal care products. Companies can explore and develop carrageenan-based formulations for drug delivery systems, skincare products, and other industrial uses, expanding their market reach and driving growth.
K Carrageenan Market Share Analysis: Food Grade segment generated the highest revenue share in the industry
The Food Grade segment stands out as the largest within the K Carrageenan Market. Carrageenan, a natural polysaccharide derived from red seaweeds, finds extensive application in the food industry due to its unique gelling, thickening, and stabilizing properties. Food-grade carrageenan is widely used as an additive in various food products, including dairy, processed meats, confectionery, and sauces. Its ability to improve texture, viscosity, and shelf stability makes it indispensable in food formulations where maintaining product quality and consistency are critical. The demand for food-grade carrageenan is driven by the growing food processing industry and consumer preference for natural and plant-derived ingredients. As food manufacturers seek cleaner labels and functional ingredients, carrageenan continues to play a pivotal role in meeting these demands. Further, advancements in extraction methods and quality control processes ensure that food-grade carrageenan meets stringent regulatory standards for safety and efficacy. The Food Grade segment's dominance in the K Carrageenan Market is expected to persist, supported by ongoing innovations and expanding applications in the global food sector.
K Carrageenan Market Share Analysis: Cosmetics is the fastest growing segment over the forecast period to 2032
The Cosmetics segment emerges as the fastest-growing category within the K Carrageenan Market up to 2032. Carrageenan, known for its versatile properties in the food industry, is also gaining significant traction in cosmetics and personal care products. In cosmetics, carrageenan acts as a natural gelling agent, thickener, and stabilizer in various formulations such as lotions, creams, masks, and hair care products. Its ability to provide smooth texture, enhance viscosity, and improve the sensory attributes of skincare and haircare products makes it a preferred ingredient among cosmetic manufacturers. The rising consumer preference for natural and sustainable ingredients in personal care products, coupled with increasing awareness about the benefits of seaweed-derived compounds, drives the demand for carrageenan in the cosmetics industry. Furthermore, carrageenan's compatibility with other natural ingredients and its gentle properties on the skin contribute to its popularity in formulations targeting sensitive skin types. As cosmetic companies continue to innovate and develop new formulations, carrageenan is expected to witness robust growth in the cosmetics segment, reflecting its pivotal role in shaping the future of natural and eco-friendly beauty products globally.
K Carrageenan Market Share Analysis: Thickener segment generated the highest revenue share in the industry
The Thickener segment stands out as the largest within the K Carrageenan Market. Carrageenan, a natural polysaccharide derived from seaweeds, is widely recognized for its exceptional thickening properties in various industries, including food, pharmaceuticals, and personal care. As a thickener, carrageenan enhances the viscosity and texture of liquid formulations, making it ideal for use in products such as dairy alternatives, sauces, desserts, and pharmaceutical suspensions. Its ability to create smooth textures without altering the taste or odor of the final product has made it indispensable in food applications where consistency and mouthfeel are crucial. Further, carrageenan's stability under a wide range of pH and temperature conditions further enhances its utility as a thickening agent in diverse industrial processes. The growing demand for processed foods, convenience products, and pharmaceutical formulations drives the expansion of the Thickener segment in the carrageenan market. Continued innovations in carrageenan production methods and formulations are expected to further bolster its role as a key thickening agent in various industries globally.
K Carrageenan Market Segmentation
By Product
Food Grade
Pharmaceutical Grade
Others
By Application
Food Industry
Cosmetics
Pharmaceutical
Biochemistry
Others
By Function
Thickener
Gelling Agent
Stabilizer
Others
Countries Analyzed
North America (US, Canada, Mexico)
Europe (Germany, UK, France, Spain, Italy, Russia, Rest of Europe)
Asia Pacific (China, India, Japan, South Korea, Australia, South East Asia, Rest of Asia)
South America (Brazil, Argentina, Rest of South America)
Middle East and Africa (Saudi Arabia, UAE, Rest of Middle East, South Africa, Egypt, Rest of Africa)
K Carrageenan Companies Profiled in the Study
Ashland Global Holdings Inc
CP Kelco
Danisco A/S
Darling Ingredients Inc
FMC Corp
FoodTech International
Meggle Group
Probiotics International
Struktol Company of America
TIC Gums Inc
*- List Not Exhaustive
Chapter 1. TABLE OF CONTENTS
Chapter 2. Introduction to K Carrageenan Market
2.1. Market Overview
2.2. Key Statistics and Report Highlights
2.3. Scope of the Comprehensive Study
2.3.1. Market Definition
2.3.2 Countries and Regions Covered
2.3.3 Research Objective
2.3.4 Units, Currency, and Conversions
2.3.5 Industry Value Chain
2.4. Key Market Segments
2.5. Key Companies
2.6. Study Period
Chapter 3. Strategic Analysis Review
3.1. K Carrageenan Pricing Analysis and Forecast
3.2. Porter’s Five Forces
3.3. Market Ecosystem
3.4. SWOT Analysis
3.5. Regulatory Scenario
3.3. Effects of Inflation, Russia-Ukraine War, moderating economic growth, and other macroeconomic factors
Chapter 4. Competitive Landscape
4.1. Market Share Analysis
4.1.1. Global K Carrageenan Market Share by Company, 2023
4.1.2. Product Offerings of Leading K Carrageenan Companies
4.2. Market Entropy
4.2.1. New Product Launches in the Industry
4.2.2. Mergers, Acquisitions, Joint ventures, and Partnerships
4.3. Key Strategies and Best Practices
Chapter 5. Global Market Projections: Best, Reference, and Low Case Scenarios
5.1. Growth Analysis- Case Scenario Definitions
5.2. Low Growth Case Scenario Forecasts
5.3. Reference Growth Case Scenario Forecasts
5.4. High Growth Case Scenario Forecasts
Chapter 6. Market Dynamics
6.1. K Carrageenan Market Drivers
6.2. K Carrageenan Market Challenges
6.6. K Carrageenan Market Opportunities
6.4. K Carrageenan Market Trends
Chapter 7. Global K Carrageenan Market Outlook Trends
7.1. Global K Carrageenan Revenue (USD Million) and CAGR (%) by Type (2021-2032)
7.2. Global K Carrageenan Revenue (USD Million) and CAGR (%) by Application (2021-2032)
7.3. Global K Carrageenan Revenue (USD Million) and CAGR (%) by Product (2021-2032)
By Product
Food Grade
Pharmaceutical Grade
Others
By Application
Food Industry
Cosmetics
Pharmaceutical
Biochemistry
Others
By Function
Thickener
Gelling Agent
Stabilizer
Others
Chapter 8. Global K Carrageenan Regional Analysis and Outlook
8.1. Global K Carrageenan Revenue (USD Million) By Regions (2021- 2032)
8.2. North America K Carrageenan Revenue (USD Million) by Country (2021-2032)
8.2.1. United States K Carrageenan Regional Analysis and Outlook
8.2.2. Canada K Carrageenan Regional Analysis and Outlook
8.2.3. Mexico K Carrageenan Regional Analysis and Outlook
8.3. Europe K Carrageenan Revenue (USD Million), by Country (2021-2032)
8.3.1. Germany K Carrageenan Regional Analysis and Outlook
8.3.2. France K Carrageenan Regional Analysis and Outlook
8.3.3. United Kingdom K Carrageenan Regional Analysis and Outlook
8.3.4. Spain K Carrageenan Regional Analysis and Outlook
8.3.5. Italy K Carrageenan Regional Analysis and Outlook
8.3.6. Russia K Carrageenan Regional Analysis and Outlook
8.3.7. Rest of Europe K Carrageenan Regional Analysis and Outlook
8.4. Asia Pacific K Carrageenan Revenue (USD Million) by Country (2021-2032)
8.4.1. China K Carrageenan Regional Analysis and Outlook
8.4.2. Japan K Carrageenan Regional Analysis and Outlook
8.4.3. India K Carrageenan Regional Analysis and Outlook
8.4.4. South Korea K Carrageenan Regional Analysis and Outlook
8.4.5. Australia K Carrageenan Regional Analysis and Outlook
8.4.6. South East Asia K Carrageenan Regional Analysis and Outlook
8.4.7. Rest of Asia Pacific K Carrageenan Regional Analysis and Outlook
8.5. South America K Carrageenan Revenue (USD Million), by Country (2021-2032)
8.5.1. Brazil K Carrageenan Regional Analysis and Outlook
8.5.2. Argentina K Carrageenan Regional Analysis and Outlook
8.5.3. Rest of South America K Carrageenan Regional Analysis and Outlook
8.6. Middle East and Africa K Carrageenan Revenue (USD Million) by Country (2021-2032)
8.6.1. Middle East K Carrageenan Regional Analysis and Outlook
8.6.2. Africa K Carrageenan Regional Analysis and Outlook
Chapter 9. North America K Carrageenan Analysis and Outlook
9.1. North America K Carrageenan Revenue (USD Million) by Segments (2021-2032)
9.1.1. North America K Carrageenan Revenue (USD Million) by Type (2021-2032)
9.1.2. North America K Carrageenan Revenue (USD Million) by Application (2021-2032)
9.1.3. North America K Carrageenan Revenue (USD Million) by Product (2021-2032)
By Product
Food Grade
Pharmaceutical Grade
Others
By Application
Food Industry
Cosmetics
Pharmaceutical
Biochemistry
Others
By Function
Thickener
Gelling Agent
Stabilizer
Others
Chapter 10. Europe K Carrageenan Analysis and Outlook
10.1. Europe K Carrageenan Revenue (USD Million), by Segments (USD Million) (2021-2032)
10.1.1. Europe K Carrageenan Revenue (USD Million) by Type (2021-2032)
10.1.2. Europe K Carrageenan Revenue (USD Million) by Application (2021-2032)
10.1.3. Europe K Carrageenan Revenue (USD Million) by Product (2021-2032)
By Product
Food Grade
Pharmaceutical Grade
Others
By Application
Food Industry
Cosmetics
Pharmaceutical
Biochemistry
Others
By Function
Thickener
Gelling Agent
Stabilizer
Others
Chapter 11. Asia Pacific K Carrageenan Analysis and Outlook
11.1. Asia Pacific K Carrageenan Revenue (USD Million), and Revenue (USD Million) by Segments (2021-2032)
11.1.1. Asia Pacific K Carrageenan Revenue (USD Million) by Type (2021-2032)
11.1.2. Asia Pacific K Carrageenan Revenue (USD Million) by Application (2021-2032)
11.1.3. Asia Pacific K Carrageenan Revenue (USD Million) by Product (2021-2032)
By Product
Food Grade
Pharmaceutical Grade
Others
By Application
Food Industry
Cosmetics
Pharmaceutical
Biochemistry
Others
By Function
Thickener
Gelling Agent
Stabilizer
Others
Chapter 12. South America K Carrageenan Analysis and Outlook
12.1. South America K Carrageenan Revenue (USD Million), by Segments (2021-2032)
12.1.1. South America K Carrageenan Revenue (USD Million) by Type (2021-2032)
12.1.2. South America K Carrageenan Revenue (USD Million) by Application (2021-2032)
12.1.3. South America K Carrageenan Revenue (USD Million) by Product (2021-2032)
By Product
Food Grade
Pharmaceutical Grade
Others
By Application
Food Industry
Cosmetics
Pharmaceutical
Biochemistry
Others
By Function
Thickener
Gelling Agent
Stabilizer
Others
Chapter 13. Middle East and Africa K Carrageenan Analysis and Outlook
13.1. Middle East and Africa K Carrageenan Revenue (USD Million), by Segments (2021-2032)
13.1.1. Middle East and Africa K Carrageenan Revenue (USD Million) by Type (2021-2032)
13.1.2. Middle East and Africa K Carrageenan Revenue (USD Million) by Application (2021-2032)
13.1.3. Middle East and Africa K Carrageenan Revenue (USD Million) by Product (2021-2032)
By Product
Food Grade
Pharmaceutical Grade
Others
By Application
Food Industry
Cosmetics
Pharmaceutical
Biochemistry
Others
By Function
Thickener
Gelling Agent
Stabilizer
Others
Chapter 14. K Carrageenan Company Profiles
14.1 Business Overview
14.2 Product Profiles
14.3 SWOT Profiles
14.5 Recent Developments
14.6 Financial Profile
List of Companies
Ashland Global Holdings Inc
CP Kelco
Danisco A/S
Darling Ingredients Inc
FMC Corp
FoodTech International
Meggle Group
Probiotics International
Struktol Company of America
TIC Gums Inc
15. Methodology and Data Sources
15.1 Customization Offerings
15.2 Subscription Services
15.3 Related Reports
15.4 Publisher Expertise
LIST OF TABLES
Table 1 Market Segmentation Analysis
Table 2 Global K Carrageenan Market Share of Leading Companies, 2023
Table 3 Product Offerings of Leading Companies
Table 4 Low Growth Scenario Forecasts
Table 5 Reference Case Growth Scenario
Table 6 High Growth Case Scenario
Table 7 Global K Carrageenan Revenue (USD Million) And CAGR (%) By Type (2021-2032)
Table 8 Global K Carrageenan Revenue (USD Million) And CAGR (%) By Application (2021-2032)
Table 9 Global K Carrageenan Revenue (USD Million) And CAGR (%) By Product (2021-2032)
Table 10 Global K Carrageenan Market Revenue (USD Million) By Regions (2021-2032)
Table 11 Global K Carrageenan Market Share (%) By Regions (2021-2032)
Table 12 North America K Carrageenan Revenue (USD Million) By Country (2021-2032)
Table 13 Europe K Carrageenan Revenue (USD Million) By Country (2021-2032)
Table 14 Asia Pacific K Carrageenan Revenue (USD Million) By Country (2021-2032)
Table 15 South America K Carrageenan Revenue (USD Million) By Country (2021-2032)
Table 16 Middle East and Africa K Carrageenan Revenue (USD Million) By Region (2021-2032)
Table 17 North America K Carrageenan Revenue (USD Million) By Type (2021-2032)
Table 18 North America K Carrageenan Revenue (USD Million) By Application (2021-2032)
Table 19 North America K Carrageenan Revenue (USD Million) By Product (2021-2032)
Table 20 Europe K Carrageenan Revenue (USD Million) By Type (2021-2032)
Table 21 Europe K Carrageenan Revenue (USD Million) By Application (2021-2032)
Table 22 Europe K Carrageenan Revenue (USD Million) By Product (2021-2032)
Table 23 Asia Pacific K Carrageenan Revenue (USD Million) By Type (2021-2032)
Table 24 Asia Pacific K Carrageenan Revenue (USD Million) By Application (2021-2032)
Table 25 Asia Pacific K Carrageenan Revenue (USD Million) By Product (2021-2032)
Table 26 South America K Carrageenan Revenue (USD Million) By Type (2021-2032)
Table 27 South America K Carrageenan Revenue (USD Million) By Application (2021-2032)
Table 28 South America K Carrageenan Revenue (USD Million) By Product (2021-2032)
Table 29 Middle East and Africa K Carrageenan Revenue (USD Million) By Type (2021-2032)
Table 30 Middle East and Africa K Carrageenan Revenue (USD Million) By Application (2021-2032)
Table 31 Middle East and Africa K Carrageenan Revenue (USD Million) By Product (2021-2032)
LIST OF FIGURES
Figure 1. Market Scope
Figure 2. Pricing Forecasts Per Unit, 2023- 2032
Figure 3. Porter’s Five Forces
Figure 4. Global K Carrageenan Market Revenue (USD Million) By Regions (2021-2032)
Figure 5. Global K Carrageenan Market Share (%) By Regions (2023)
Figure 6. North America K Carrageenan Revenue (USD Million) By Country (2021-2032)
Figure 7. United States K Carrageenan Revenue (USD Million) By Country (2021-2032)
Figure 8. Canada K Carrageenan Revenue (USD Million) By Country (2021-2032)
Figure 9. Mexico K Carrageenan Revenue (USD Million) By Country (2021-2032)
Figure 10. Europe K Carrageenan Revenue (USD Million) By Country (2021-2032)
Figure 11. Germany K Carrageenan Revenue (USD Million) By Country (2021-2032)
Figure 12. France K Carrageenan Revenue (USD Million) By Country (2021-2032)
Figure 13. United Kingdom K Carrageenan Revenue (USD Million) By Country (2021-2032)
Figure 14. Spain K Carrageenan Revenue (USD Million) By Country (2021-2032)
Figure 15. Italy K Carrageenan Revenue (USD Million) By Country (2021-2032)
Figure 16. Russia K Carrageenan Revenue (USD Million) By Country (2021-2032)
Figure 17. Rest of Europe K Carrageenan Revenue (USD Million) By Country (2021-2032)
Figure 11. Asia Pacific K Carrageenan Revenue (USD Million) By Country (2021-2032)
Figure 12. China K Carrageenan Revenue (USD Million) By Country (2021-2032)
Figure 13. Japan K Carrageenan Revenue (USD Million) By Country (2021-2032)
Figure 14. India K Carrageenan Revenue (USD Million) By Country (2021-2032)
Figure 15. South Korea K Carrageenan Revenue (USD Million) By Country (2021-2032)
Figure 16. Australia K Carrageenan Revenue (USD Million) By Country (2021-2032)
Figure 17. South East Asia K Carrageenan Revenue (USD Million) By Country (2021-2032)
Figure 18. South America K Carrageenan Revenue (USD Million) By Country (2021-2032)
Figure 19. Brazil K Carrageenan Revenue (USD Million) By Country (2021-2032)
Figure 20. Argentina K Carrageenan Revenue (USD Million) By Country (2021-2032)
Figure 21. Rest of Asia Pacific K Carrageenan Revenue (USD Million) By Country (2021-2032)
Figure 22. Middle East and Africa K Carrageenan Revenue (USD Million) By Region (2021-2032)
Figure 23. Saudi Arabia K Carrageenan Revenue (USD Million) By Region (2021-2032)
Figure 24. The UAE K Carrageenan Revenue (USD Million) By Region (2021-2032)
Figure 25. Rest of Middle East K Carrageenan Revenue (USD Million) By Region (2021-2032)
Figure 26. South Africa K Carrageenan Revenue (USD Million) By Region (2021-2032)
Figure 27. Africa K Carrageenan Revenue (USD Million) By Region (2021-2032)
Figure 28. North America K Carrageenan Revenue (USD Million) By Type (2021-2032)
Figure 29. North America K Carrageenan Revenue (USD Million) By Application (2021-2032)
Figure 30. North America K Carrageenan Revenue (USD Million) By Product (2021-2032)
Figure 31. Europe K Carrageenan Revenue (USD Million) By Type (2021-2032)
Figure 32. Europe K Carrageenan Revenue (USD Million) By Application (2021-2032)
Figure 33. Europe K Carrageenan Revenue (USD Million) By Product (2021-2032)
Figure 34. Asia Pacific K Carrageenan Revenue (USD Million) By Type (2021-2032)
Figure 35. Asia Pacific K Carrageenan Revenue (USD Million) By Application (2021-2032)
Figure 36. Asia Pacific K Carrageenan Revenue (USD Million) By Product (2021-2032)
Figure 37. South America K Carrageenan Revenue (USD Million) By Type (2021-2032)
Figure 38. South America K Carrageenan Revenue (USD Million) By Application (2021-2032)
Figure 39. South America K Carrageenan Revenue (USD Million) By Product (2021-2032)
Figure 40. Middle East and Africa K Carrageenan Revenue (USD Million) By Type (2021-2032)
Figure 41. Middle East and Africa K Carrageenan Revenue (USD Million) By Application (2021-2032)
Figure 42. Middle East and Africa K Carrageenan Revenue (USD Million) By Product (2021-2032)
By Product
Food Grade
Pharmaceutical Grade
Others
By Application
Food Industry
Cosmetics
Pharmaceutical
Biochemistry
Others
By Function
Thickener
Gelling Agent
Stabilizer
Others
Countries Analyzed
North America (US, Canada, Mexico)
Europe (Germany, UK, France, Spain, Italy, Russia, Rest of Europe)
Asia Pacific (China, India, Japan, South Korea, Australia, South East Asia, Rest of Asia)
South America (Brazil, Argentina, Rest of South America)
Middle East and Africa (Saudi Arabia, UAE, Rest of Middle East, South Africa, Egypt, Rest of Africa)
