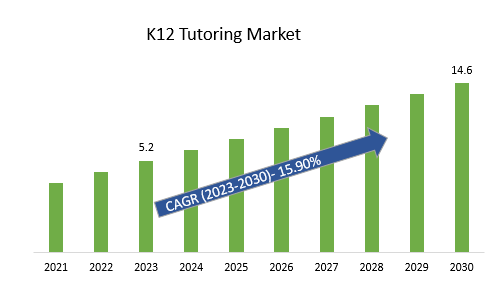
The global K12 Tutoring Market Size is estimated to be US$ 5.2 Billion in 2023 and is poised to register 15.9% growth over the forecast period from 2023 to 2030.
The market growth is driven by increased demand for academic excellence, intensified competition, and changing curricula form the bedrock of this vibrant market. Leveraging digitalization and personalized learning, online platforms offer global reach and data-driven insights, while STEM education, holistic learning, and career-oriented tutoring cater to evolving needs influence grow and hybrid learning models emerge, the market thrives on innovation.
Leading key market players are investing in Technology Integration, Global Accessibility, Specialized Services, Soft Skills Emphasis, Hybrid Learning Models, Research-Backed Approaches, and others to boost market shares in the industry.
Market Overview
The K-12 tutoring market overview is pivotal for investors, educators, policymakers, and stakeholders, offering insights into current trends, investment opportunities, teaching methods, and regulatory considerations. It informs decision-making, guides market entry, and encourages innovation while providing parents with a clearer understanding of tutoring's benefits for their children's education. The collaboration between academic institutions and tutoring services supports global learning perspectives and serves as a benchmark for ongoing progress and improvement.
Market Dynamics
Market Trends: - Companies are launching Hybrid Learning Models to attract a consumer base
Hybrid learning provides students with flexibility in terms of time, location, and pace. This flexibility accommodates different learning styles and individual schedules, making education more accessible and convenient. The integrating online tools, hybrid learning allows for personalized learning paths tailored to each student's needs, strengths, and areas for improvement. Technological Integration industry benefits from integrating technology effectively, fostering digital literacy, and preparing students for the technology-driven demands of the workforce.
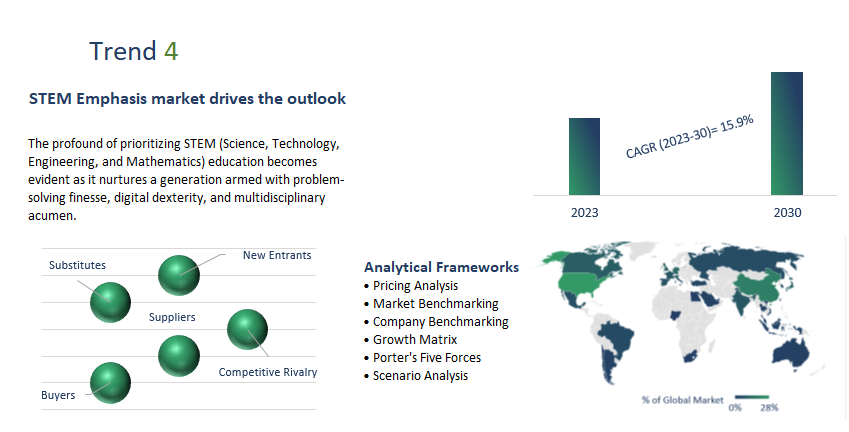
Market Drivers: - STEM Emphasis market drives the outlook
The profound of prioritizing STEM (Science, Technology, Engineering, and Mathematics) education becomes evident as it nurtures a generation armed with problem-solving finesse, digital dexterity, and multidisciplinary acumen. This deliberate focus empowers students to unravel real-world complexities, fuel innovation, and excel across a spectrum of careers. The scientific literacy, igniting entrepreneurial zeal, and fostering global competitiveness, STEM education lays a resilient foundation for navigating dynamic job landscapes and upcoming technological vistas. This narrative of perpetual learning resonates profoundly, guiding individuals toward astute decision-making in our intricately connected world.
Market Opportunity: Introduction of Problem-Solving Skills
The importance of cultivating strong problem-solving skills is paramount in navigating the complexities of modern life and work. These skills transcend specific disciplines, enriching individuals with the ability to analyze challenges, develop innovative solutions, and make informed decisions. Problem-solving skills have several key implications Effective Decision-Making, Collaboration, Critical Thinking, Career Advancement, Personal Empowerment, Continuous Improvement, and others.
Market Segmentation
Structured Tutoring: Structured tutoring within the K-12 education market is a transformative approach that tailors learning to individual needs, offering personalized paths, targeted skill development, and consistent progress tracking. It enhances student's academic proficiency, cultivates essential soft skills, and fosters confidence while preparing them for real-world challenges. With a focus on effective study techniques, test preparation, and holistic development, structured tutoring shapes well-rounded, independent learners poised for future success.
Language Courses: In the K-12 tutoring market, language courses offer cognitive enrichment, cultural awareness, and improved communication skills. They enhance problem-solving abilities, provide academic advantages, and open doors to diverse career opportunities. Early language learning fosters brain plasticity, global awareness, and social integration, contributing to well-rounded individuals who are adept at cross-cultural communication, equipped for academic versatility, and driven toward lifelong learning.
Higher Education: Higher education equips individuals with specialized knowledge and expertise in their chosen fields, preparing them for careers that require advanced skills and understanding. A highly educated workforce contributes to economic growth by fostering innovation, entrepreneurship, and the development of advanced industries.
Market Segmentation
By Type
- Pre-Kindergarten
- Kindergarten
- Primary School
- Junior High School
- High School
By Application
- Online Teaching
- Live Teaching
- Blended Learning
- One-on-One Tutoring
- Group Tutoring
By Subject
- Math
- Science
- English
- Social Studies
- Foreign Languages
- Test Preparation
By Service Provider
- Independent Tutors
- Tutoring Companies
- Franchise Centers
- Online Platforms
By Region
- North America (United States, Canada, Mexico)
- Europe (Germany, France, United Kingdom, Spain, Italy, Others)
- Asia Pacific (China, India, Japan, South Korea, Australia, Others)
- Latin America (Brazil, Argentina, Others)
- Middle East and Africa (Saudi Arabia, UAE, Kuwait, Other Middle East, South Africa, Nigeria, Other Africa)
Key Players
Leading companies profiled in the study include-
- Omega Learning Center
- Huntington Learning Centers
- The Tutoring Center
- JEI Learning Centers
- Sylvan Learning
- GradePower Learning
- Tutor Doctor
- Tomorrow Advancing Life
- Eye Level Learning, Kumon
- Neworiental
- Mathnasium Learning Centers
K12 Tutoring Systems Market Outlook 2023
1 Market Overview
1.1 Introduction to K12 Tutoring Systems Market
1.2 Scope of the Study
1.3 Research Objective
1.3.1 Key Market Scope and Segments
1.3.2 Players Covered
1.3.3 Years Considered
2 Executive Summary
2.1 2023 K12 Tutoring Systems Industry- Market Statistics
3 Market Dynamics
3.1 Market Drivers
3.2 Market Challenges
3.3 Market Opportunities
3.4 Market Trends
4 Market Factor Analysis
4.1 Porter’s Five Forces
4.2 Market Entropy
4.2.1 Global K12 Tutoring Systems Market Companies with Area Served
4.2.2 Products Offerings Global K12 Tutoring Systems Market
5 COVID-19 Impact Analysis and Outlook Scenarios
5.1.1 Covid-19 Impact Analysis
5.1.2 Post-COVID-19 Scenario- Low Growth Case
5.1.3 Post-COVID-19 Scenario- Reference Growth Case
5.1.4 Post-COVID-19 Scenario- Low Growth Case
6 Global K12 Tutoring Systems Market Trends
6.1 Global K12 Tutoring Systems Revenue (USD Million) and CAGR (%) by Type (2018-2030)
6.2 Global K12 Tutoring Systems Revenue (USD Million) and CAGR (%) by Applications (2018-2030)
6.3 Global K12 Tutoring Systems Revenue (USD Million) and CAGR (%) by Regions (2018-2030)
7 Global K12 Tutoring Systems Market Revenue (USD Million) by Type, and Applications (2018-2022)
7.1 Global K12 Tutoring Systems Revenue (USD Million) by Type (2018-2022)
7.1.1 Global K12 Tutoring Systems Revenue (USD Million), Market Share (%) by Type (2018-2022)
7.2 Global K12 Tutoring Systems Revenue (USD Million) by Applications (2018-2022)
7.2.1 Global K12 Tutoring Systems Revenue (USD Million), Market Share (%) by Applications (2018-2022)
8 Global K12 Tutoring Systems Development Regional Status and Outlook
8.1 Global K12 Tutoring Systems Revenue (USD Million) By Regions (2018-2022)
8.2 North America K12 Tutoring Systems Revenue (USD Million) by Type, and Application (2018-2022)
8.2.1 North America K12 Tutoring Systems Revenue (USD Million) by Country (2018-2022)
8.2.2 North America K12 Tutoring Systems Revenue (USD Million) by Type (2018-2022)
8.2.3 North America K12 Tutoring Systems Revenue (USD Million) by Applications (2018-2022)
8.3 Europe K12 Tutoring Systems Revenue (USD Million), by Type, and Applications (USD Million) (2018-2022)
8.3.1 Europe K12 Tutoring Systems Revenue (USD Million), by Country (2018-2022)
8.3.2 Europe K12 Tutoring Systems Revenue (USD Million) by Type (2018-2022)
8.3.3 Europe K12 Tutoring Systems Revenue (USD Million) by Applications (2018-2022)
8.4 Asia Pacific K12 Tutoring Systems Revenue (USD Million), and Revenue (USD Million) by Type, and Applications (2018-2022)
8.4.1 Asia Pacific K12 Tutoring Systems Revenue (USD Million) by Country (2018-2022)
8.4.2 Asia Pacific K12 Tutoring Systems Revenue (USD Million) by Type (2018-2022)
8.4.3 Asia Pacific K12 Tutoring Systems Revenue (USD Million) by Applications (2018-2022)
8.5 South America K12 Tutoring Systems Revenue (USD Million), by Type, and Applications (2018-2022)
8.5.1 South America K12 Tutoring Systems Revenue (USD Million), by Country (2018-2022)
8.5.2 South America K12 Tutoring Systems Revenue (USD Million) by Type (2018-2022)
8.5.3 South America K12 Tutoring Systems Revenue (USD Million) by Applications (2018-2022)
8.6 Middle East and Africa K12 Tutoring Systems Revenue (USD Million), by Type, Technology, Application, Thickness (2018-2022)
8.6.1 Middle East and Africa K12 Tutoring Systems Revenue (USD Million) by Country (2018-2022)
8.6.2 Middle East and Africa K12 Tutoring Systems Revenue (USD Million) by Type (2018-2022)
8.6.3 Middle East and Africa K12 Tutoring Systems Revenue (USD Million) by Applications (2018-2022)
9 Company Profiles
10 Global K12 Tutoring Systems Market Revenue (USD Million), by Type, and Applications (2023-2030)
10.1 Global K12 Tutoring Systems Revenue (USD Million) and Market Share (%) by Type (2023-2030)
10.1.1 Global K12 Tutoring Systems Revenue (USD Million), and Market Share (%) by Type (2023-2030)
10.2 Global K12 Tutoring Systems Revenue (USD Million) and Market Share (%) by Applications (2023-2030)
10.2.1 Global K12 Tutoring Systems Revenue (USD Million), and Market Share (%) by Applications (2023-2030)
11 Global K12 Tutoring Systems Development Regional Status and Outlook Forecast
11.1 Global K12 Tutoring Systems Revenue (USD Million) By Regions (2023-2030)
11.2 North America K12 Tutoring Systems Revenue (USD Million) by Type, and Applications (2023-2030)
11.2.1 North America K12 Tutoring Systems Revenue (USD) Million by Country (2023-2030)
11.2.2 North America K12 Tutoring Systems Revenue (USD Million), by Type (2023-2030)
11.2.3 North America K12 Tutoring Systems Revenue (USD Million), Market Share (%) by Applications (2023-2030)
11.3 Europe K12 Tutoring Systems Revenue (USD Million), by Type, and Applications (2023-2030)
11.3.1 Europe K12 Tutoring Systems Revenue (USD Million), by Country (2023-2030)
11.3.2 Europe K12 Tutoring Systems Revenue (USD Million), by Type (2023-2030)
11.3.3 Europe K12 Tutoring Systems Revenue (USD Million), by Applications (2023-2030)
11.4 Asia Pacific K12 Tutoring Systems Revenue (USD Million) by Type, and Applications (2023-2030)
11.4.1 Asia Pacific K12 Tutoring Systems Revenue (USD Million), by Country (2023-2030)
11.4.2 Asia Pacific K12 Tutoring Systems Revenue (USD Million), by Type (2023-2030)
11.4.3 Asia Pacific K12 Tutoring Systems Revenue (USD Million), by Applications (2023-2030)
11.5 South America K12 Tutoring Systems Revenue (USD Million), by Type, and Applications (2023-2030)
11.5.1 South America K12 Tutoring Systems Revenue (USD Million), by Country (2023-2030)
11.5.2 South America K12 Tutoring Systems Revenue (USD Million), by Type (2023-2030)
11.5.3 South America K12 Tutoring Systems Revenue (USD Million), by Applications (2023-2030)
11.6 Middle East and Africa K12 Tutoring Systems Revenue (USD Million), by Type, and Applications (2023-2030)
11.6.1 Middle East and Africa K12 Tutoring Systems Revenue (USD Million), by Region (2023-2030)
11.6.2 Middle East and Africa K12 Tutoring Systems Revenue (USD Million), by Type (2023-2030)
11.6.3 Middle East and Africa K12 Tutoring Systems Revenue (USD Million), by Applications (2023-2030)
12 Methodology and Data Sources
12.1 Methodology/Research Approach
12.1.1 Research Programs/Design
12.1.2 Market Size Estimation
12.1.3 Market Breakdown and Data Triangulation
12.2 Data Sources
12.2.1 Secondary Sources
12.2.2 Primary Sources
12.3 Disclaimer
List Of Tables
Table 1 Market Segmentation Analysis
Table 2 Global K12 Tutoring Systems Market Companies with Areas Served
Table 3 Products Offerings Global K12 Tutoring Systems Market
Table 4 Low Growth Scenario Forecasts
Table 5 Reference Case Growth Scenario
Table 6 High Growth Case Scenario
Table 7 Global K12 Tutoring Systems Revenue (USD Million) And CAGR (%) By Type (2018-2030)
Table 8 Global K12 Tutoring Systems Revenue (USD Million) And CAGR (%) By Applications (2018-2030)
Table 9 Global K12 Tutoring Systems Revenue (USD Million) And CAGR (%) By Regions (2018-2030)
Table 10 Global K12 Tutoring Systems Revenue (USD Million) By Type (2018-2022)
Table 11 Global K12 Tutoring Systems Revenue Market Share (%) By Type (2018-2022)
Table 12 Global K12 Tutoring Systems Revenue (USD Million) By Applications (2018-2022)
Table 13 Global K12 Tutoring Systems Revenue Market Share (%) By Applications (2018-2022)
Table 14 Global K12 Tutoring Systems Market Revenue (USD Million) By Regions (2018-2022)
Table 15 Global K12 Tutoring Systems Market Share (%) By Regions (2018-2022)
Table 16 North America K12 Tutoring Systems Revenue (USD Million) By Country (2018-2022)
Table 17 North America K12 Tutoring Systems Revenue (USD Million) By Type (2018-2022)
Table 18 North America K12 Tutoring Systems Revenue (USD Million) By Applications (2018-2022)
Table 19 Europe K12 Tutoring Systems Revenue (USD Million) By Country (2018-2022)
Table 20 Europe K12 Tutoring Systems Revenue (USD Million) By Type (2018-2022)
Table 21 Europe K12 Tutoring Systems Revenue (USD Million) By Applications (2018-2022)
Table 22 Asia Pacific K12 Tutoring Systems Revenue (USD Million) By Country (2018-2022)
Table 23 Asia Pacific K12 Tutoring Systems Revenue (USD Million) By Type (2018-2022)
Table 24 Asia Pacific K12 Tutoring Systems Revenue (USD Million) By Applications (2018-2022)
Table 25 South America K12 Tutoring Systems Revenue (USD Million) By Country (2018-2022)
Table 26 South America K12 Tutoring Systems Revenue (USD Million) By Type (2018-2022)
Table 27 South America K12 Tutoring Systems Revenue (USD Million) By Applications (2018-2022)
Table 28 Middle East and Africa K12 Tutoring Systems Revenue (USD Million) By Region (2018-2022)
Table 29 Middle East and Africa K12 Tutoring Systems Revenue (USD Million) By Type (2018-2022)
Table 30 Middle East and Africa K12 Tutoring Systems Revenue (USD Million) By Applications (2018-2022)
Table 31 Financial Analysis
Table 32 Global K12 Tutoring Systems Revenue (USD Million) By Type (2023-2030)
Table 33 Global K12 Tutoring Systems Revenue Market Share (%) By Type (2023-2030)
Table 34 Global K12 Tutoring Systems Revenue (USD Million) By Applications (2023-2030)
Table 35 Global K12 Tutoring Systems Revenue Market Share (%) By Applications (2023-2030)
Table 36 Global K12 Tutoring Systems Market Revenue (USD Million), And Revenue (USD Million) By Regions (2023-2030)
Table 37 North America K12 Tutoring Systems Revenue (USD)By Country (2023-2030)
Table 38 North America K12 Tutoring Systems Revenue (USD Million) By Type (2023-2030)
Table 39 North America K12 Tutoring Systems Revenue (USD Million) By Applications (2023-2030)
Table 40 Europe K12 Tutoring Systems Revenue (USD Million) By Country (2023-2030)
Table 41 Europe K12 Tutoring Systems Revenue (USD Million) By Type (2023-2030)
Table 42 Europe K12 Tutoring Systems Revenue (USD Million) By Applications (2023-2030)
Table 43 Asia Pacific K12 Tutoring Systems Revenue (USD Million) By Country (2023-2030)
Table 44 Asia Pacific K12 Tutoring Systems Revenue (USD Million) By Type (2023-2030)
Table 45 Asia Pacific K12 Tutoring Systems Revenue (USD Million) By Applications (2023-2030)
Table 46 South America K12 Tutoring Systems Revenue (USD Million) By Country (2023-2030)
Table 47 South America K12 Tutoring Systems Revenue (USD Million) By Type (2023-2030)
Table 48 South America K12 Tutoring Systems Revenue (USD Million) By Applications (2023-2030)
Table 49 Middle East and Africa K12 Tutoring Systems Revenue (USD Million) By Region (2023-2030)
Table 50 Middle East and Africa K12 Tutoring Systems Revenue (USD Million) By Region (2023-2030)
Table 51 Middle East and Africa K12 Tutoring Systems Revenue (USD Million) By Type (2023-2030)
Table 52 Middle East and Africa K12 Tutoring Systems Revenue (USD Million) By Applications (2023-2030)
Table 53 Research Programs/Design for This Report
Table 54 Key Data Information from Secondary Sources
Table 55 Key Data Information from Primary Sources
List Of Figures
Figure 1 Market Scope
Figure 2 Porter’s Five Forces
Figure 3 Global K12 Tutoring Systems Revenue (USD Million) By Type (2018-2022)
Figure 4 Global K12 Tutoring Systems Revenue Market Share (%) By Type (2022)
Figure 5 Global K12 Tutoring Systems Revenue (USD Million) By Applications (2018-2022)
Figure 6 Global K12 Tutoring Systems Revenue Market Share (%) By Applications (2022)
Figure 7 Global K12 Tutoring Systems Market Revenue (USD Million) By Regions (2018-2022)
Figure 8 Global K12 Tutoring Systems Market Share (%) By Regions (2022)
Figure 9 North America K12 Tutoring Systems Revenue (USD Million) By Country (2018-2022)
Figure 10 North America K12 Tutoring Systems Revenue (USD Million) By Type (2018-2022)
Figure 11 North America K12 Tutoring Systems Revenue (USD Million) By Applications (2018-2022)
Figure 12 Europe K12 Tutoring Systems Revenue (USD Million) By Country (2018-2022)
Figure 13 Europe K12 Tutoring Systems Revenue (USD Million) By Type (2018-2022)
Figure 14 Europe K12 Tutoring Systems Revenue (USD Million) By Applications (2018-2022)
Figure 15 Asia Pacific K12 Tutoring Systems Revenue (USD Million) By Country (2018-2022)
Figure 16 Asia Pacific K12 Tutoring Systems Revenue (USD Million) By Type (2018-2022)
Figure 17 Asia Pacific K12 Tutoring Systems Revenue (USD Million) By Applications (2018-2022)
Figure 18 South America K12 Tutoring Systems Revenue (USD Million) By Country (2018-2022)
Figure 19 South America K12 Tutoring Systems Revenue (USD Million) By Type (2018-2022)
Figure 20 South America K12 Tutoring Systems Revenue (USD Million) By Applications (2018-2022)
Figure 21 Middle East and Africa K12 Tutoring Systems Revenue (USD Million) By Region (2018-2022)
Figure 22 Middle East and Africa K12 Tutoring Systems Revenue (USD Million) By Type (2018-2022)
Figure 23 Middle East and Africa K12 Tutoring Systems Revenue (USD Million) By Applications (2018-2022)
Figure 24 Global K12 Tutoring Systems Revenue (USD Million) By Type (2023-2030)
Figure 25 Global K12 Tutoring Systems Revenue Market Share (%) By Type (2030)
Figure 26 Global K12 Tutoring Systems Revenue (USD Million) By Applications (2023-2030)
Figure 27 Global K12 Tutoring Systems Revenue Market Share (%) By Applications (2030)
Figure 28 Global K12 Tutoring Systems Market Revenue (USD Million) By Regions (2023-2030)
Figure 29 North America K12 Tutoring Systems Revenue (USD Million) By Country (2023-2030)
Figure 30 North America K12 Tutoring Systems Revenue (USD Million) By Type (2023-2030)
Figure 31 North America K12 Tutoring Systems Revenue (USD Million) By Applications (2023-2030)
Figure 32 Europe K12 Tutoring Systems Revenue (USD Million) By Country (2023-2030)
Figure 33 Europe K12 Tutoring Systems Revenue (USD Million) By Type (2023-2030)
Figure 34 Europe K12 Tutoring Systems Revenue (USD Million) By Applications (2023-2030)
Figure 35 Asia Pacific K12 Tutoring Systems Revenue (USD Million) By Country (2023-2030)
Figure 36 Asia Pacific K12 Tutoring Systems Revenue (USD Million) By Type (2023-2030)
Figure 37 Asia Pacific K12 Tutoring Systems Revenue (USD Million) By Applications (2023-2030)
Figure 38 South America K12 Tutoring Systems Revenue (USD Million) By Country (2023-2030)
Figure 39 South America K12 Tutoring Systems Revenue (USD Million) By Type (2023-2030)
Figure 40 South America K12 Tutoring Systems Revenue (USD Million) By Applications (2023-2030)
Figure 41 Middle East and Africa K12 Tutoring Systems Revenue (USD Million) By Region (2023-2030)
Figure 42 Middle East and Africa K12 Tutoring Systems Revenue (USD Million) By Region (2023-2030)
Figure 43 Middle East and Africa K12 Tutoring Systems Revenue (USD Million) By Type (2023-2030)
Figure 44 Middle East and Africa K12 Tutoring Systems Revenue (USD Million) By Applications (2023-2030)
Figure 45 Bottom-Up and Top-Down Approaches For This Report
Figure 46 Data Triangulation
