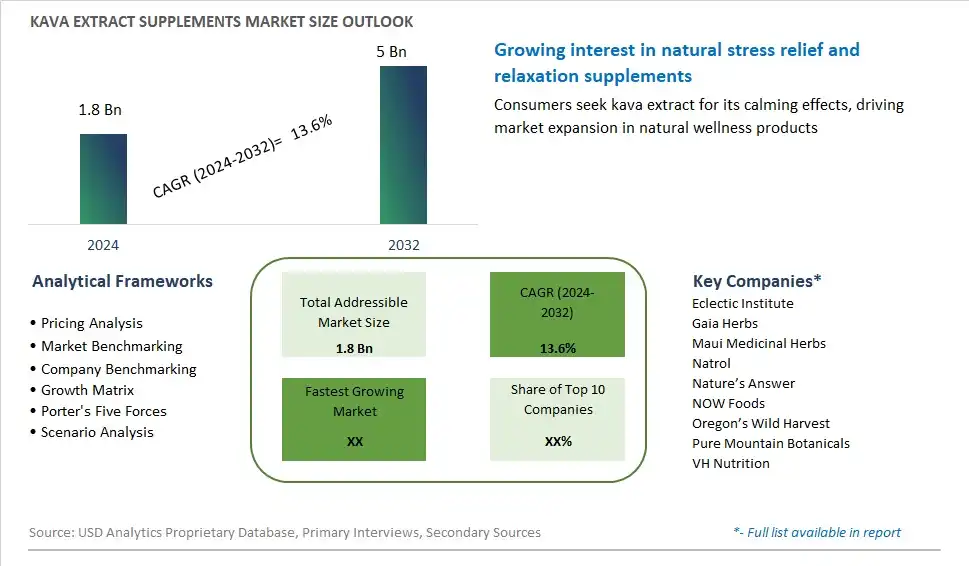
Global Kava Extract Supplements Market Size is valued at $1.8 Billion in 2024 and is forecast to register a growth rate (CAGR) of 13.6% to reach $5 Billion by 2032.
The global Kava Extract Supplements Market Comprehensive Study analyzes and forecasts the market size across 6 regions and 24 countries for diverse segments -By Type (Tablets, Powder, Liquid), By Distribution Channel (Online, Offline)
An Introduction to Kava Extract Supplements Market
In 2024, the kava extract supplements market is expanding, driven by the growing interest in natural and herbal remedies for stress and anxiety relief. Kava, a traditional plant native to the South Pacific, is known for its calming and anxiolytic effects, making it a popular supplement for promoting relaxation and mental well-being. The market benefits from the increasing consumer preference for natural health products and the rising awareness of the benefits of kava. Innovations in extraction and formulation techniques have improved the potency and safety of kava supplements, enhancing their market appeal. Additionally, the trend towards clean-label and organic supplements supports the adoption of kava extract products. As consumers continue to seek natural solutions for mental health and wellness, the demand for kava extract supplements is set to grow robustly.
Kava Extract Supplements Competitive Landscape
The market report analyses the leading companies in the industry including Eclectic Institute, Gaia Herbs, Maui Medicinal Herbs, Natrol, Nature’s Answer, NOW Foods, Oregon’s Wild Harvest, Pure Mountain Botanicals, VH Nutrition, and Others.
Kava Extract Supplements Market Dynamics
Kava Extract Supplements Market Trend: Growing Demand for Natural Stress Relief and Relaxation Solutions
A prominent trend in the kava extract supplements market is the increasing demand for natural stress relief and relaxation solutions. As consumers seek ways to manage stress and anxiety in their daily lives, there's a rising interest in natural and holistic approaches to promote relaxation and mental well-being. Kava extract supplements, derived from the roots of the kava plant, are known for their calming and sedative properties, making them popular as a natural alternative to pharmaceuticals for stress and anxiety management. This trend is driven by factors such as increasing awareness of mental health issues, rising stress levels due to modern lifestyles, and the preference for plant-based remedies with fewer side effects. Additionally, the growing popularity of mindfulness practices and wellness trends has contributed to the mainstream acceptance of kava extract supplements as a safe and effective way to promote relaxation and support mental health. As consumers prioritize holistic approaches to self-care and wellness, the demand for kava extract supplements is expected to grow, driving market expansion and innovation in kava-based products.
Market Driver: Shift Towards Natural and Herbal Remedies for Health and Wellness
An essential driver fueling the kava extract supplements market is the shift towards natural and herbal remedies for health and wellness. With increasing concerns about the safety and efficacy of synthetic pharmaceuticals and over-the-counter medications, there's a growing preference for natural and plant-based alternatives among consumers seeking to maintain their health and well-being. Kava extract supplements, with their long history of traditional use in Pacific Island cultures for ceremonial and medicinal purposes, are gaining traction as a natural remedy for stress, anxiety, and sleep disorders. This driver is reinforced by factors such as the rising interest in traditional medicine and indigenous healing practices, the availability of scientific research supporting the therapeutic benefits of kava, and the endorsement of kava extract supplements by healthcare professionals and wellness influencers. Additionally, the desire for personalized and holistic approaches to healthcare has led to increased consumer interest in herbal supplements and botanical extracts with specific health benefits. As consumers become more educated about the potential health benefits of kava extract supplements, the demand for these products is expected to increase, driving market growth and adoption of kava-based supplements as part of daily wellness routines.
Market Opportunity: Expansion into Functional and Specialty Formulations
A significant opportunity within the kava extract supplements market lies in the expansion into functional and specialty formulations to cater to specific consumer needs and preferences. Beyond traditional kava extract supplements, there's potential to develop a diverse range of functional and specialty formulations targeting specific health concerns such as stress management, relaxation, sleep support, and cognitive function. This opportunity encompasses the development of innovative formulations that combine kava extract with other botanicals, vitamins, minerals, and bioactive compounds to enhance efficacy and address various health and wellness goals. Additionally, there's an opportunity to explore novel delivery formats such as capsules, tablets, tinctures, and beverages to improve convenience, bioavailability, and consumer acceptance. By expanding into functional and specialty formulations, kava extract supplement manufacturers can differentiate their products, meet the evolving needs of diverse consumer demographics, and capitalize on opportunities to penetrate niche market segments such as sports nutrition, mental health, and healthy aging. As consumer awareness of the potential health benefits of kava extract supplements continues to grow, driven by factors such as wellness trends and increasing interest in natural remedies, the market presents significant opportunities for innovation, product development, and market expansion in functional and specialty kava-based formulations.
Kava Extract Supplements Market Share Analysis: Tablets held the dominant market share in 2024
The tablets segment is the largest segment in the kava extract supplements market due to its convenience, portability, and ease of consumption. Tablets offer a standardized dosage of kava extract in a convenient and easily consumable form, making them popular among consumers seeking stress relief, relaxation, and mood enhancement. Further, tablets provide a discreet and mess-free option for supplementing with kava extract, appealing to individuals with busy lifestyles or those who prefer a simple and straightforward supplementation regimen. Additionally, tablets often undergo quality control measures to ensure consistent potency and purity, enhancing consumer trust in their efficacy and safety. As consumers increasingly prioritize holistic health and wellness practices, the tablets segment continues to dominate the kava extract supplements market, offering a convenient and reliable solution for relaxation and stress management.
Kava Extract Supplements Market Share Analysis: Online market is poised to register the fastest growth rae over the forecast period to 2032
The online segment is the fastest-growing segment in the kava extract supplements market, fueled by the convenience, accessibility, and wide assortment of products offered by e-commerce platforms. Online channels provide consumers with the flexibility to browse, compare, and purchase kava extract supplements from the comfort of their homes, overcoming geographical limitations and time constraints associated with traditional brick-and-mortar stores. Further, the increasing penetration of internet and smartphone usage, coupled with the growing popularity of online shopping, particularly amid the COVID-19 pandemic, has accelerated the shift towards online distribution channels for health and wellness products. Furthermore, online retailers often offer competitive pricing, discounts, and subscription services, enhancing the value proposition for consumers and driving sales growth in the online segment. As consumers seek convenient and hassle-free shopping experiences, the online distribution channel is poised to sustain its rapid expansion, reshaping the kava extract supplements market landscape.
Kava Extract Supplements Market Segmentation
By Type
Tablets
Powder
Liquid
By Distribution Channel
Online
Offline
Countries Analyzed
North America (US, Canada, Mexico)
Europe (Germany, UK, France, Spain, Italy, Russia, Rest of Europe)
Asia Pacific (China, India, Japan, South Korea, Australia, South East Asia, Rest of Asia)
South America (Brazil, Argentina, Rest of South America)
Middle East and Africa (Saudi Arabia, UAE, Rest of Middle East, South Africa, Egypt, Rest of Africa)
Kava Extract Supplements Companies Profiled in the Study
Eclectic Institute
Gaia Herbs
Maui Medicinal Herbs
Natrol
Nature’s Answer
NOW Foods
Oregon’s Wild Harvest
Pure Mountain Botanicals
VH Nutrition
*- List Not Exhaustive
Chapter 1. TABLE OF CONTENTS
Chapter 2. Introduction to Kava Extract Supplements Market
2.1. Market Overview
2.2. Key Statistics and Report Highlights
2.3. Scope of the Comprehensive Study
2.3.1. Market Definition
2.3.2 Countries and Regions Covered
2.3.3 Research Objective
2.3.4 Units, Currency, and Conversions
2.3.5 Industry Value Chain
2.4. Key Market Segments
2.5. Key Companies
2.6. Study Period
Chapter 3. Strategic Analysis Review
3.1. Kava Extract Supplements Pricing Analysis and Forecast
3.2. Porter’s Five Forces
3.3. Market Ecosystem
3.4. SWOT Analysis
3.5. Regulatory Scenario
3.3. Effects of Inflation, Russia-Ukraine War, moderating economic growth, and other macroeconomic factors
Chapter 4. Competitive Landscape
4.1. Market Share Analysis
4.1.1. Global Kava Extract Supplements Market Share by Company, 2023
4.1.2. Product Offerings of Leading Kava Extract Supplements Companies
4.2. Market Entropy
4.2.1. New Product Launches in the Industry
4.2.2. Mergers, Acquisitions, Joint ventures, and Partnerships
4.3. Key Strategies and Best Practices
Chapter 5. Global Market Projections: Best, Reference, and Low Case Scenarios
5.1. Growth Analysis- Case Scenario Definitions
5.2. Low Growth Case Scenario Forecasts
5.3. Reference Growth Case Scenario Forecasts
5.4. High Growth Case Scenario Forecasts
Chapter 6. Market Dynamics
6.1. Kava Extract Supplements Market Drivers
6.2. Kava Extract Supplements Market Challenges
6.6. Kava Extract Supplements Market Opportunities
6.4. Kava Extract Supplements Market Trends
Chapter 7. Global Kava Extract Supplements Market Outlook Trends
7.1. Global Kava Extract Supplements Revenue (USD Million) and CAGR (%) by Type (2021-2032)
7.2. Global Kava Extract Supplements Revenue (USD Million) and CAGR (%) by Application (2021-2032)
7.3. Global Kava Extract Supplements Revenue (USD Million) and CAGR (%) by Product (2021-2032)
By Type
Tablets
Powder
Liquid
By Distribution Channel
Online
Offline
Chapter 8. Global Kava Extract Supplements Regional Analysis and Outlook
8.1. Global Kava Extract Supplements Revenue (USD Million) By Regions (2021- 2032)
8.2. North America Kava Extract Supplements Revenue (USD Million) by Country (2021-2032)
8.2.1. United States Kava Extract Supplements Regional Analysis and Outlook
8.2.2. Canada Kava Extract Supplements Regional Analysis and Outlook
8.2.3. Mexico Kava Extract Supplements Regional Analysis and Outlook
8.3. Europe Kava Extract Supplements Revenue (USD Million), by Country (2021-2032)
8.3.1. Germany Kava Extract Supplements Regional Analysis and Outlook
8.3.2. France Kava Extract Supplements Regional Analysis and Outlook
8.3.3. United Kingdom Kava Extract Supplements Regional Analysis and Outlook
8.3.4. Spain Kava Extract Supplements Regional Analysis and Outlook
8.3.5. Italy Kava Extract Supplements Regional Analysis and Outlook
8.3.6. Russia Kava Extract Supplements Regional Analysis and Outlook
8.3.7. Rest of Europe Kava Extract Supplements Regional Analysis and Outlook
8.4. Asia Pacific Kava Extract Supplements Revenue (USD Million) by Country (2021-2032)
8.4.1. China Kava Extract Supplements Regional Analysis and Outlook
8.4.2. Japan Kava Extract Supplements Regional Analysis and Outlook
8.4.3. India Kava Extract Supplements Regional Analysis and Outlook
8.4.4. South Korea Kava Extract Supplements Regional Analysis and Outlook
8.4.5. Australia Kava Extract Supplements Regional Analysis and Outlook
8.4.6. South East Asia Kava Extract Supplements Regional Analysis and Outlook
8.4.7. Rest of Asia Pacific Kava Extract Supplements Regional Analysis and Outlook
8.5. South America Kava Extract Supplements Revenue (USD Million), by Country (2021-2032)
8.5.1. Brazil Kava Extract Supplements Regional Analysis and Outlook
8.5.2. Argentina Kava Extract Supplements Regional Analysis and Outlook
8.5.3. Rest of South America Kava Extract Supplements Regional Analysis and Outlook
8.6. Middle East and Africa Kava Extract Supplements Revenue (USD Million) by Country (2021-2032)
8.6.1. Middle East Kava Extract Supplements Regional Analysis and Outlook
8.6.2. Africa Kava Extract Supplements Regional Analysis and Outlook
Chapter 9. North America Kava Extract Supplements Analysis and Outlook
9.1. North America Kava Extract Supplements Revenue (USD Million) by Segments (2021-2032)
9.1.1. North America Kava Extract Supplements Revenue (USD Million) by Type (2021-2032)
9.1.2. North America Kava Extract Supplements Revenue (USD Million) by Application (2021-2032)
9.1.3. North America Kava Extract Supplements Revenue (USD Million) by Product (2021-2032)
By Type
Tablets
Powder
Liquid
By Distribution Channel
Online
Offline
Chapter 10. Europe Kava Extract Supplements Analysis and Outlook
10.1. Europe Kava Extract Supplements Revenue (USD Million), by Segments (USD Million) (2021-2032)
10.1.1. Europe Kava Extract Supplements Revenue (USD Million) by Type (2021-2032)
10.1.2. Europe Kava Extract Supplements Revenue (USD Million) by Application (2021-2032)
10.1.3. Europe Kava Extract Supplements Revenue (USD Million) by Product (2021-2032)
By Type
Tablets
Powder
Liquid
By Distribution Channel
Online
Offline
Chapter 11. Asia Pacific Kava Extract Supplements Analysis and Outlook
11.1. Asia Pacific Kava Extract Supplements Revenue (USD Million), and Revenue (USD Million) by Segments (2021-2032)
11.1.1. Asia Pacific Kava Extract Supplements Revenue (USD Million) by Type (2021-2032)
11.1.2. Asia Pacific Kava Extract Supplements Revenue (USD Million) by Application (2021-2032)
11.1.3. Asia Pacific Kava Extract Supplements Revenue (USD Million) by Product (2021-2032)
By Type
Tablets
Powder
Liquid
By Distribution Channel
Online
Offline
Chapter 12. South America Kava Extract Supplements Analysis and Outlook
12.1. South America Kava Extract Supplements Revenue (USD Million), by Segments (2021-2032)
12.1.1. South America Kava Extract Supplements Revenue (USD Million) by Type (2021-2032)
12.1.2. South America Kava Extract Supplements Revenue (USD Million) by Application (2021-2032)
12.1.3. South America Kava Extract Supplements Revenue (USD Million) by Product (2021-2032)
By Type
Tablets
Powder
Liquid
By Distribution Channel
Online
Offline
Chapter 13. Middle East and Africa Kava Extract Supplements Analysis and Outlook
13.1. Middle East and Africa Kava Extract Supplements Revenue (USD Million), by Segments (2021-2032)
13.1.1. Middle East and Africa Kava Extract Supplements Revenue (USD Million) by Type (2021-2032)
13.1.2. Middle East and Africa Kava Extract Supplements Revenue (USD Million) by Application (2021-2032)
13.1.3. Middle East and Africa Kava Extract Supplements Revenue (USD Million) by Product (2021-2032)
By Type
Tablets
Powder
Liquid
By Distribution Channel
Online
Offline
Chapter 14. Kava Extract Supplements Company Profiles
14.1 Business Overview
14.2 Product Profiles
14.3 SWOT Profiles
14.5 Recent Developments
14.6 Financial Profile
List of Companies
Eclectic Institute
Gaia Herbs
Maui Medicinal Herbs
Natrol
Nature’s Answer
NOW Foods
Oregon’s Wild Harvest
Pure Mountain Botanicals
VH Nutrition
15. Methodology and Data Sources
15.1 Customization Offerings
15.2 Subscription Services
15.3 Related Reports
15.4 Publisher Expertise
LIST OF TABLES
Table 1 Market Segmentation Analysis
Table 2 Global Kava Extract Supplements Market Share of Leading Companies, 2023
Table 3 Product Offerings of Leading Companies
Table 4 Low Growth Scenario Forecasts
Table 5 Reference Case Growth Scenario
Table 6 High Growth Case Scenario
Table 7 Global Kava Extract Supplements Revenue (USD Million) And CAGR (%) By Type (2021-2032)
Table 8 Global Kava Extract Supplements Revenue (USD Million) And CAGR (%) By Application (2021-2032)
Table 9 Global Kava Extract Supplements Revenue (USD Million) And CAGR (%) By Product (2021-2032)
Table 10 Global Kava Extract Supplements Market Revenue (USD Million) By Regions (2021-2032)
Table 11 Global Kava Extract Supplements Market Share (%) By Regions (2021-2032)
Table 12 North America Kava Extract Supplements Revenue (USD Million) By Country (2021-2032)
Table 13 Europe Kava Extract Supplements Revenue (USD Million) By Country (2021-2032)
Table 14 Asia Pacific Kava Extract Supplements Revenue (USD Million) By Country (2021-2032)
Table 15 South America Kava Extract Supplements Revenue (USD Million) By Country (2021-2032)
Table 16 Middle East and Africa Kava Extract Supplements Revenue (USD Million) By Region (2021-2032)
Table 17 North America Kava Extract Supplements Revenue (USD Million) By Type (2021-2032)
Table 18 North America Kava Extract Supplements Revenue (USD Million) By Application (2021-2032)
Table 19 North America Kava Extract Supplements Revenue (USD Million) By Product (2021-2032)
Table 20 Europe Kava Extract Supplements Revenue (USD Million) By Type (2021-2032)
Table 21 Europe Kava Extract Supplements Revenue (USD Million) By Application (2021-2032)
Table 22 Europe Kava Extract Supplements Revenue (USD Million) By Product (2021-2032)
Table 23 Asia Pacific Kava Extract Supplements Revenue (USD Million) By Type (2021-2032)
Table 24 Asia Pacific Kava Extract Supplements Revenue (USD Million) By Application (2021-2032)
Table 25 Asia Pacific Kava Extract Supplements Revenue (USD Million) By Product (2021-2032)
Table 26 South America Kava Extract Supplements Revenue (USD Million) By Type (2021-2032)
Table 27 South America Kava Extract Supplements Revenue (USD Million) By Application (2021-2032)
Table 28 South America Kava Extract Supplements Revenue (USD Million) By Product (2021-2032)
Table 29 Middle East and Africa Kava Extract Supplements Revenue (USD Million) By Type (2021-2032)
Table 30 Middle East and Africa Kava Extract Supplements Revenue (USD Million) By Application (2021-2032)
Table 31 Middle East and Africa Kava Extract Supplements Revenue (USD Million) By Product (2021-2032)
LIST OF FIGURES
Figure 1. Market Scope
Figure 2. Pricing Forecasts Per Unit, 2023- 2032
Figure 3. Porter’s Five Forces
Figure 4. Global Kava Extract Supplements Market Revenue (USD Million) By Regions (2021-2032)
Figure 5. Global Kava Extract Supplements Market Share (%) By Regions (2023)
Figure 6. North America Kava Extract Supplements Revenue (USD Million) By Country (2021-2032)
Figure 7. United States Kava Extract Supplements Revenue (USD Million) By Country (2021-2032)
Figure 8. Canada Kava Extract Supplements Revenue (USD Million) By Country (2021-2032)
Figure 9. Mexico Kava Extract Supplements Revenue (USD Million) By Country (2021-2032)
Figure 10. Europe Kava Extract Supplements Revenue (USD Million) By Country (2021-2032)
Figure 11. Germany Kava Extract Supplements Revenue (USD Million) By Country (2021-2032)
Figure 12. France Kava Extract Supplements Revenue (USD Million) By Country (2021-2032)
Figure 13. United Kingdom Kava Extract Supplements Revenue (USD Million) By Country (2021-2032)
Figure 14. Spain Kava Extract Supplements Revenue (USD Million) By Country (2021-2032)
Figure 15. Italy Kava Extract Supplements Revenue (USD Million) By Country (2021-2032)
Figure 16. Russia Kava Extract Supplements Revenue (USD Million) By Country (2021-2032)
Figure 17. Rest of Europe Kava Extract Supplements Revenue (USD Million) By Country (2021-2032)
Figure 11. Asia Pacific Kava Extract Supplements Revenue (USD Million) By Country (2021-2032)
Figure 12. China Kava Extract Supplements Revenue (USD Million) By Country (2021-2032)
Figure 13. Japan Kava Extract Supplements Revenue (USD Million) By Country (2021-2032)
Figure 14. India Kava Extract Supplements Revenue (USD Million) By Country (2021-2032)
Figure 15. South Korea Kava Extract Supplements Revenue (USD Million) By Country (2021-2032)
Figure 16. Australia Kava Extract Supplements Revenue (USD Million) By Country (2021-2032)
Figure 17. South East Asia Kava Extract Supplements Revenue (USD Million) By Country (2021-2032)
Figure 18. South America Kava Extract Supplements Revenue (USD Million) By Country (2021-2032)
Figure 19. Brazil Kava Extract Supplements Revenue (USD Million) By Country (2021-2032)
Figure 20. Argentina Kava Extract Supplements Revenue (USD Million) By Country (2021-2032)
Figure 21. Rest of Asia Pacific Kava Extract Supplements Revenue (USD Million) By Country (2021-2032)
Figure 22. Middle East and Africa Kava Extract Supplements Revenue (USD Million) By Region (2021-2032)
Figure 23. Saudi Arabia Kava Extract Supplements Revenue (USD Million) By Region (2021-2032)
Figure 24. The UAE Kava Extract Supplements Revenue (USD Million) By Region (2021-2032)
Figure 25. Rest of Middle East Kava Extract Supplements Revenue (USD Million) By Region (2021-2032)
Figure 26. South Africa Kava Extract Supplements Revenue (USD Million) By Region (2021-2032)
Figure 27. Africa Kava Extract Supplements Revenue (USD Million) By Region (2021-2032)
Figure 28. North America Kava Extract Supplements Revenue (USD Million) By Type (2021-2032)
Figure 29. North America Kava Extract Supplements Revenue (USD Million) By Application (2021-2032)
Figure 30. North America Kava Extract Supplements Revenue (USD Million) By Product (2021-2032)
Figure 31. Europe Kava Extract Supplements Revenue (USD Million) By Type (2021-2032)
Figure 32. Europe Kava Extract Supplements Revenue (USD Million) By Application (2021-2032)
Figure 33. Europe Kava Extract Supplements Revenue (USD Million) By Product (2021-2032)
Figure 34. Asia Pacific Kava Extract Supplements Revenue (USD Million) By Type (2021-2032)
Figure 35. Asia Pacific Kava Extract Supplements Revenue (USD Million) By Application (2021-2032)
Figure 36. Asia Pacific Kava Extract Supplements Revenue (USD Million) By Product (2021-2032)
Figure 37. South America Kava Extract Supplements Revenue (USD Million) By Type (2021-2032)
Figure 38. South America Kava Extract Supplements Revenue (USD Million) By Application (2021-2032)
Figure 39. South America Kava Extract Supplements Revenue (USD Million) By Product (2021-2032)
Figure 40. Middle East and Africa Kava Extract Supplements Revenue (USD Million) By Type (2021-2032)
Figure 41. Middle East and Africa Kava Extract Supplements Revenue (USD Million) By Application (2021-2032)
Figure 42. Middle East and Africa Kava Extract Supplements Revenue (USD Million) By Product (2021-2032)
By Type
Tablets
Powder
Liquid
By Distribution Channel
Online
Offline
Countries Analyzed
North America (US, Canada, Mexico)
Europe (Germany, UK, France, Spain, Italy, Russia, Rest of Europe)
Asia Pacific (China, India, Japan, South Korea, Australia, South East Asia, Rest of Asia)
South America (Brazil, Argentina, Rest of South America)
Middle East and Africa (Saudi Arabia, UAE, Rest of Middle East, South Africa, Egypt, Rest of Africa)
