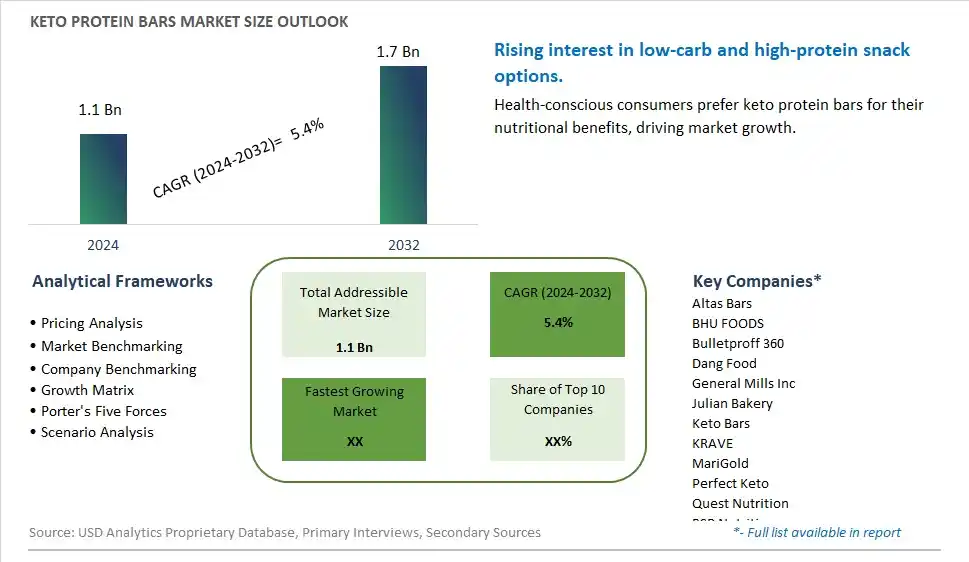
Global Keto Protein Bars Market Size is valued at $1.1 Billion in 2024 and is forecast to register a growth rate (CAGR) of 5.4% to reach $1.7 Billion by 2032.
The global Keto Protein Bars Market Comprehensive Study analyzes and forecasts the market size across 6 regions and 24 countries for diverse segments -By Type (Keto Protein Bar, Keto Protein Bar-Cookie Dough, Keto Protein Bar-Bites), By Application (Adult Male, Adult Female, Others)
An Introduction to Keto Protein Bars Market
The keto protein bars market in 2024 is thriving, fueled by the growing popularity of the ketogenic diet and the demand for convenient, low-carb snacks. Keto protein bars, formulated to be high in healthy fats and protein while low in carbohydrates, cater to consumers seeking to maintain ketosis and support their fitness goals. The market is benefiting from innovations in flavor and ingredient combinations, including plant-based options and fortified bars with added vitamins and minerals. The trend towards clean label and natural products is also influencing product development. The rise of health-conscious lifestyles and the popularity of on-the-go nutrition are further propelling market growth.
Keto Protein Bars Competitive Landscape
The market report analyses the leading companies in the industry including Altas Bars, BHU FOODS, Bulletproff 360, Dang Food, General Mills Inc, Julian Bakery, Keto Bars, KRAVE, MariGold, Perfect Keto, Quest Nutrition, RSP Nutrition, Stoka Bar, The Kraft Heinz Company, ZENWISE Health, and Others.
Keto Protein Bars Market Dynamics
Keto Protein Bars Market Trend: Increasing Popularity of Keto Diets
The most prominent trend in the Keto Protein Bars Market is the increasing popularity of keto diets. As more consumers adopt ketogenic diets for weight management and health benefits, the demand for keto-friendly snacks, including protein bars, has surged. These bars provide convenient, low-carb, high-fat options that align with keto dietary requirements.
Keto Protein Bars Market Driver: Health and Wellness Movement
A key driver in the Keto Protein Bars Market is the health and wellness movement. Consumers are becoming more health-conscious and are actively seeking out products that support their fitness and dietary goals. Keto protein bars cater to this demographic by offering nutritious, on-the-go options that support energy levels and muscle maintenance without compromising ketosis.
Keto Protein Bars Market Opportunity: Expansion into Diverse Flavors and Ingredients
One significant opportunity in the Keto Protein Bars Market lies in the expansion into diverse flavors and ingredients. Companies can innovate by introducing new flavors, incorporating superfoods, and using natural sweeteners to enhance the appeal of their products. This approach can attract a broader consumer base, including those who are not strictly following a keto diet but are looking for healthy snack alternatives.
Keto Protein Bars Market Share Analysis: Keto Protein Bar segment generated the highest revenue share in the industry
Among the segments listed, the Keto Protein Bar emerges as the largest in the Keto Protein Bars Market. Keto protein bars are specifically formulated to cater to consumers following ketogenic diets, which emphasize high fat, moderate protein, and low carbohydrate intake. These bars contain ingredients such as whey protein, collagen peptides, almond or coconut flour, and natural sweeteners like stevia or erythritol, all chosen to maintain ketosis—the metabolic state where the body burns fat for fuel instead of carbohydrates. Keto protein bars are popular among health-conscious individuals seeking convenient, on-the-go snacks that align with their dietary preferences and goals. The demand for keto-friendly products has surged alongside the growing popularity of the ketogenic diet for weight management, improved energy levels, and other health benefits. As a result, the Keto Protein Bar segment continues to expand rapidly, driven by increasing consumer awareness of ketogenic diets and preferences for snacks that offer both nutrition and convenience without compromising dietary restrictions. Innovation in flavors and ingredients tailored to ketogenic principles further propels the growth of this segment in the competitive protein bar market.
Keto Protein Bars Market Share Analysis: Adult Female is the fastest growing segment over the forecast period to 2032
The Adult Female segment is identified as the fastest-growing category in the Keto Protein Bars Market. This growth can be attributed to several factors influencing female consumers' preferences and dietary choices. Women increasingly adopt ketogenic diets for weight management, hormonal balance, and overall health improvement, driving the demand for keto-friendly snacks like protein bars. These bars are designed to meet the nutritional needs of women following a ketogenic lifestyle, providing a convenient source of protein and healthy fats while minimizing carbohydrates. Manufacturers are responding to this trend by developing products specifically tailored to women's tastes and nutritional requirements, incorporating ingredients that support female health, such as collagen peptides for skin and joint support, and adaptogens for stress management. Marketing strategies that emphasize health benefits, convenience, and flavor appeal also contribute to the segment's rapid growth. As awareness of the ketogenic diet's benefits expands among female consumers, supported by endorsements from health influencers and nutritionists, the Adult Female segment is expected to continue its robust growth trajectory in the Keto Protein Bars Market through 2032.
Keto Protein Bars Market Segmentation
By Type
Keto Protein Bar
Keto Protein Bar-Cookie Dough
Keto Protein Bar-Bites
By Application
Adult Male
Adult Female
Others
Countries Analyzed
North America (US, Canada, Mexico)
Europe (Germany, UK, France, Spain, Italy, Russia, Rest of Europe)
Asia Pacific (China, India, Japan, South Korea, Australia, South East Asia, Rest of Asia)
South America (Brazil, Argentina, Rest of South America)
Middle East and Africa (Saudi Arabia, UAE, Rest of Middle East, South Africa, Egypt, Rest of Africa)
Keto Protein Bars Companies Profiled in the Study
Altas Bars
BHU FOODS
Bulletproff 360
Dang Food
General Mills Inc
Julian Bakery
Keto Bars
KRAVE
MariGold
Perfect Keto
Quest Nutrition
RSP Nutrition
Stoka Bar
The Kraft Heinz Company
ZENWISE Health
*- List Not Exhaustive
Chapter 1. TABLE OF CONTENTS
Chapter 2. Introduction to Keto Protein Bars Market
2.1. Market Overview
2.2. Key Statistics and Report Highlights
2.3. Scope of the Comprehensive Study
2.3.1. Market Definition
2.3.2 Countries and Regions Covered
2.3.3 Research Objective
2.3.4 Units, Currency, and Conversions
2.3.5 Industry Value Chain
2.4. Key Market Segments
2.5. Key Companies
2.6. Study Period
Chapter 3. Strategic Analysis Review
3.1. Keto Protein Bars Pricing Analysis and Forecast
3.2. Porter’s Five Forces
3.3. Market Ecosystem
3.4. SWOT Analysis
3.5. Regulatory Scenario
3.3. Effects of Inflation, Russia-Ukraine War, moderating economic growth, and other macroeconomic factors
Chapter 4. Competitive Landscape
4.1. Market Share Analysis
4.1.1. Global Keto Protein Bars Market Share by Company, 2023
4.1.2. Product Offerings of Leading Keto Protein Bars Companies
4.2. Market Entropy
4.2.1. New Product Launches in the Industry
4.2.2. Mergers, Acquisitions, Joint ventures, and Partnerships
4.3. Key Strategies and Best Practices
Chapter 5. Global Market Projections: Best, Reference, and Low Case Scenarios
5.1. Growth Analysis- Case Scenario Definitions
5.2. Low Growth Case Scenario Forecasts
5.3. Reference Growth Case Scenario Forecasts
5.4. High Growth Case Scenario Forecasts
Chapter 6. Market Dynamics
6.1. Keto Protein Bars Market Drivers
6.2. Keto Protein Bars Market Challenges
6.6. Keto Protein Bars Market Opportunities
6.4. Keto Protein Bars Market Trends
Chapter 7. Global Keto Protein Bars Market Outlook Trends
7.1. Global Keto Protein Bars Revenue (USD Million) and CAGR (%) by Type (2021-2032)
7.2. Global Keto Protein Bars Revenue (USD Million) and CAGR (%) by Application (2021-2032)
7.3. Global Keto Protein Bars Revenue (USD Million) and CAGR (%) by Product (2021-2032)
By Type
Keto Protein Bar
Keto Protein Bar-Cookie Dough
Keto Protein Bar-Bites
By Application
Adult Male
Adult Female
Others
Chapter 8. Global Keto Protein Bars Regional Analysis and Outlook
8.1. Global Keto Protein Bars Revenue (USD Million) By Regions (2021- 2032)
8.2. North America Keto Protein Bars Revenue (USD Million) by Country (2021-2032)
8.2.1. United States Keto Protein Bars Regional Analysis and Outlook
8.2.2. Canada Keto Protein Bars Regional Analysis and Outlook
8.2.3. Mexico Keto Protein Bars Regional Analysis and Outlook
8.3. Europe Keto Protein Bars Revenue (USD Million), by Country (2021-2032)
8.3.1. Germany Keto Protein Bars Regional Analysis and Outlook
8.3.2. France Keto Protein Bars Regional Analysis and Outlook
8.3.3. United Kingdom Keto Protein Bars Regional Analysis and Outlook
8.3.4. Spain Keto Protein Bars Regional Analysis and Outlook
8.3.5. Italy Keto Protein Bars Regional Analysis and Outlook
8.3.6. Russia Keto Protein Bars Regional Analysis and Outlook
8.3.7. Rest of Europe Keto Protein Bars Regional Analysis and Outlook
8.4. Asia Pacific Keto Protein Bars Revenue (USD Million) by Country (2021-2032)
8.4.1. China Keto Protein Bars Regional Analysis and Outlook
8.4.2. Japan Keto Protein Bars Regional Analysis and Outlook
8.4.3. India Keto Protein Bars Regional Analysis and Outlook
8.4.4. South Korea Keto Protein Bars Regional Analysis and Outlook
8.4.5. Australia Keto Protein Bars Regional Analysis and Outlook
8.4.6. South East Asia Keto Protein Bars Regional Analysis and Outlook
8.4.7. Rest of Asia Pacific Keto Protein Bars Regional Analysis and Outlook
8.5. South America Keto Protein Bars Revenue (USD Million), by Country (2021-2032)
8.5.1. Brazil Keto Protein Bars Regional Analysis and Outlook
8.5.2. Argentina Keto Protein Bars Regional Analysis and Outlook
8.5.3. Rest of South America Keto Protein Bars Regional Analysis and Outlook
8.6. Middle East and Africa Keto Protein Bars Revenue (USD Million) by Country (2021-2032)
8.6.1. Middle East Keto Protein Bars Regional Analysis and Outlook
8.6.2. Africa Keto Protein Bars Regional Analysis and Outlook
Chapter 9. North America Keto Protein Bars Analysis and Outlook
9.1. North America Keto Protein Bars Revenue (USD Million) by Segments (2021-2032)
9.1.1. North America Keto Protein Bars Revenue (USD Million) by Type (2021-2032)
9.1.2. North America Keto Protein Bars Revenue (USD Million) by Application (2021-2032)
9.1.3. North America Keto Protein Bars Revenue (USD Million) by Product (2021-2032)
By Type
Keto Protein Bar
Keto Protein Bar-Cookie Dough
Keto Protein Bar-Bites
By Application
Adult Male
Adult Female
Others
Chapter 10. Europe Keto Protein Bars Analysis and Outlook
10.1. Europe Keto Protein Bars Revenue (USD Million), by Segments (USD Million) (2021-2032)
10.1.1. Europe Keto Protein Bars Revenue (USD Million) by Type (2021-2032)
10.1.2. Europe Keto Protein Bars Revenue (USD Million) by Application (2021-2032)
10.1.3. Europe Keto Protein Bars Revenue (USD Million) by Product (2021-2032)
By Type
Keto Protein Bar
Keto Protein Bar-Cookie Dough
Keto Protein Bar-Bites
By Application
Adult Male
Adult Female
Others
Chapter 11. Asia Pacific Keto Protein Bars Analysis and Outlook
11.1. Asia Pacific Keto Protein Bars Revenue (USD Million), and Revenue (USD Million) by Segments (2021-2032)
11.1.1. Asia Pacific Keto Protein Bars Revenue (USD Million) by Type (2021-2032)
11.1.2. Asia Pacific Keto Protein Bars Revenue (USD Million) by Application (2021-2032)
11.1.3. Asia Pacific Keto Protein Bars Revenue (USD Million) by Product (2021-2032)
By Type
Keto Protein Bar
Keto Protein Bar-Cookie Dough
Keto Protein Bar-Bites
By Application
Adult Male
Adult Female
Others
Chapter 12. South America Keto Protein Bars Analysis and Outlook
12.1. South America Keto Protein Bars Revenue (USD Million), by Segments (2021-2032)
12.1.1. South America Keto Protein Bars Revenue (USD Million) by Type (2021-2032)
12.1.2. South America Keto Protein Bars Revenue (USD Million) by Application (2021-2032)
12.1.3. South America Keto Protein Bars Revenue (USD Million) by Product (2021-2032)
By Type
Keto Protein Bar
Keto Protein Bar-Cookie Dough
Keto Protein Bar-Bites
By Application
Adult Male
Adult Female
Others
Chapter 13. Middle East and Africa Keto Protein Bars Analysis and Outlook
13.1. Middle East and Africa Keto Protein Bars Revenue (USD Million), by Segments (2021-2032)
13.1.1. Middle East and Africa Keto Protein Bars Revenue (USD Million) by Type (2021-2032)
13.1.2. Middle East and Africa Keto Protein Bars Revenue (USD Million) by Application (2021-2032)
13.1.3. Middle East and Africa Keto Protein Bars Revenue (USD Million) by Product (2021-2032)
By Type
Keto Protein Bar
Keto Protein Bar-Cookie Dough
Keto Protein Bar-Bites
By Application
Adult Male
Adult Female
Others
Chapter 14. Keto Protein Bars Company Profiles
14.1 Business Overview
14.2 Product Profiles
14.3 SWOT Profiles
14.5 Recent Developments
14.6 Financial Profile
List of Companies
Altas Bars
BHU FOODS
Bulletproff 360
Dang Food
General Mills Inc
Julian Bakery
Keto Bars
KRAVE
MariGold
Perfect Keto
Quest Nutrition
RSP Nutrition
Stoka Bar
The Kraft Heinz Company
ZENWISE Health
15. Methodology and Data Sources
15.1 Customization Offerings
15.2 Subscription Services
15.3 Related Reports
15.4 Publisher Expertise
LIST OF TABLES
Table 1 Market Segmentation Analysis
Table 2 Global Keto Protein Bars Market Share of Leading Companies, 2023
Table 3 Product Offerings of Leading Companies
Table 4 Low Growth Scenario Forecasts
Table 5 Reference Case Growth Scenario
Table 6 High Growth Case Scenario
Table 7 Global Keto Protein Bars Revenue (USD Million) And CAGR (%) By Type (2021-2032)
Table 8 Global Keto Protein Bars Revenue (USD Million) And CAGR (%) By Application (2021-2032)
Table 9 Global Keto Protein Bars Revenue (USD Million) And CAGR (%) By Product (2021-2032)
Table 10 Global Keto Protein Bars Market Revenue (USD Million) By Regions (2021-2032)
Table 11 Global Keto Protein Bars Market Share (%) By Regions (2021-2032)
Table 12 North America Keto Protein Bars Revenue (USD Million) By Country (2021-2032)
Table 13 Europe Keto Protein Bars Revenue (USD Million) By Country (2021-2032)
Table 14 Asia Pacific Keto Protein Bars Revenue (USD Million) By Country (2021-2032)
Table 15 South America Keto Protein Bars Revenue (USD Million) By Country (2021-2032)
Table 16 Middle East and Africa Keto Protein Bars Revenue (USD Million) By Region (2021-2032)
Table 17 North America Keto Protein Bars Revenue (USD Million) By Type (2021-2032)
Table 18 North America Keto Protein Bars Revenue (USD Million) By Application (2021-2032)
Table 19 North America Keto Protein Bars Revenue (USD Million) By Product (2021-2032)
Table 20 Europe Keto Protein Bars Revenue (USD Million) By Type (2021-2032)
Table 21 Europe Keto Protein Bars Revenue (USD Million) By Application (2021-2032)
Table 22 Europe Keto Protein Bars Revenue (USD Million) By Product (2021-2032)
Table 23 Asia Pacific Keto Protein Bars Revenue (USD Million) By Type (2021-2032)
Table 24 Asia Pacific Keto Protein Bars Revenue (USD Million) By Application (2021-2032)
Table 25 Asia Pacific Keto Protein Bars Revenue (USD Million) By Product (2021-2032)
Table 26 South America Keto Protein Bars Revenue (USD Million) By Type (2021-2032)
Table 27 South America Keto Protein Bars Revenue (USD Million) By Application (2021-2032)
Table 28 South America Keto Protein Bars Revenue (USD Million) By Product (2021-2032)
Table 29 Middle East and Africa Keto Protein Bars Revenue (USD Million) By Type (2021-2032)
Table 30 Middle East and Africa Keto Protein Bars Revenue (USD Million) By Application (2021-2032)
Table 31 Middle East and Africa Keto Protein Bars Revenue (USD Million) By Product (2021-2032)
LIST OF FIGURES
Figure 1. Market Scope
Figure 2. Pricing Forecasts Per Unit, 2023- 2032
Figure 3. Porter’s Five Forces
Figure 4. Global Keto Protein Bars Market Revenue (USD Million) By Regions (2021-2032)
Figure 5. Global Keto Protein Bars Market Share (%) By Regions (2023)
Figure 6. North America Keto Protein Bars Revenue (USD Million) By Country (2021-2032)
Figure 7. United States Keto Protein Bars Revenue (USD Million) By Country (2021-2032)
Figure 8. Canada Keto Protein Bars Revenue (USD Million) By Country (2021-2032)
Figure 9. Mexico Keto Protein Bars Revenue (USD Million) By Country (2021-2032)
Figure 10. Europe Keto Protein Bars Revenue (USD Million) By Country (2021-2032)
Figure 11. Germany Keto Protein Bars Revenue (USD Million) By Country (2021-2032)
Figure 12. France Keto Protein Bars Revenue (USD Million) By Country (2021-2032)
Figure 13. United Kingdom Keto Protein Bars Revenue (USD Million) By Country (2021-2032)
Figure 14. Spain Keto Protein Bars Revenue (USD Million) By Country (2021-2032)
Figure 15. Italy Keto Protein Bars Revenue (USD Million) By Country (2021-2032)
Figure 16. Russia Keto Protein Bars Revenue (USD Million) By Country (2021-2032)
Figure 17. Rest of Europe Keto Protein Bars Revenue (USD Million) By Country (2021-2032)
Figure 11. Asia Pacific Keto Protein Bars Revenue (USD Million) By Country (2021-2032)
Figure 12. China Keto Protein Bars Revenue (USD Million) By Country (2021-2032)
Figure 13. Japan Keto Protein Bars Revenue (USD Million) By Country (2021-2032)
Figure 14. India Keto Protein Bars Revenue (USD Million) By Country (2021-2032)
Figure 15. South Korea Keto Protein Bars Revenue (USD Million) By Country (2021-2032)
Figure 16. Australia Keto Protein Bars Revenue (USD Million) By Country (2021-2032)
Figure 17. South East Asia Keto Protein Bars Revenue (USD Million) By Country (2021-2032)
Figure 18. South America Keto Protein Bars Revenue (USD Million) By Country (2021-2032)
Figure 19. Brazil Keto Protein Bars Revenue (USD Million) By Country (2021-2032)
Figure 20. Argentina Keto Protein Bars Revenue (USD Million) By Country (2021-2032)
Figure 21. Rest of Asia Pacific Keto Protein Bars Revenue (USD Million) By Country (2021-2032)
Figure 22. Middle East and Africa Keto Protein Bars Revenue (USD Million) By Region (2021-2032)
Figure 23. Saudi Arabia Keto Protein Bars Revenue (USD Million) By Region (2021-2032)
Figure 24. The UAE Keto Protein Bars Revenue (USD Million) By Region (2021-2032)
Figure 25. Rest of Middle East Keto Protein Bars Revenue (USD Million) By Region (2021-2032)
Figure 26. South Africa Keto Protein Bars Revenue (USD Million) By Region (2021-2032)
Figure 27. Africa Keto Protein Bars Revenue (USD Million) By Region (2021-2032)
Figure 28. North America Keto Protein Bars Revenue (USD Million) By Type (2021-2032)
Figure 29. North America Keto Protein Bars Revenue (USD Million) By Application (2021-2032)
Figure 30. North America Keto Protein Bars Revenue (USD Million) By Product (2021-2032)
Figure 31. Europe Keto Protein Bars Revenue (USD Million) By Type (2021-2032)
Figure 32. Europe Keto Protein Bars Revenue (USD Million) By Application (2021-2032)
Figure 33. Europe Keto Protein Bars Revenue (USD Million) By Product (2021-2032)
Figure 34. Asia Pacific Keto Protein Bars Revenue (USD Million) By Type (2021-2032)
Figure 35. Asia Pacific Keto Protein Bars Revenue (USD Million) By Application (2021-2032)
Figure 36. Asia Pacific Keto Protein Bars Revenue (USD Million) By Product (2021-2032)
Figure 37. South America Keto Protein Bars Revenue (USD Million) By Type (2021-2032)
Figure 38. South America Keto Protein Bars Revenue (USD Million) By Application (2021-2032)
Figure 39. South America Keto Protein Bars Revenue (USD Million) By Product (2021-2032)
Figure 40. Middle East and Africa Keto Protein Bars Revenue (USD Million) By Type (2021-2032)
Figure 41. Middle East and Africa Keto Protein Bars Revenue (USD Million) By Application (2021-2032)
Figure 42. Middle East and Africa Keto Protein Bars Revenue (USD Million) By Product (2021-2032)
By Type
Keto Protein Bar
Keto Protein Bar-Cookie Dough
Keto Protein Bar-Bites
By Application
Adult Male
Adult Female
Others
Countries Analyzed
North America (US, Canada, Mexico)
Europe (Germany, UK, France, Spain, Italy, Russia, Rest of Europe)
Asia Pacific (China, India, Japan, South Korea, Australia, South East Asia, Rest of Asia)
South America (Brazil, Argentina, Rest of South America)
Middle East and Africa (Saudi Arabia, UAE, Rest of Middle East, South Africa, Egypt, Rest of Africa)
