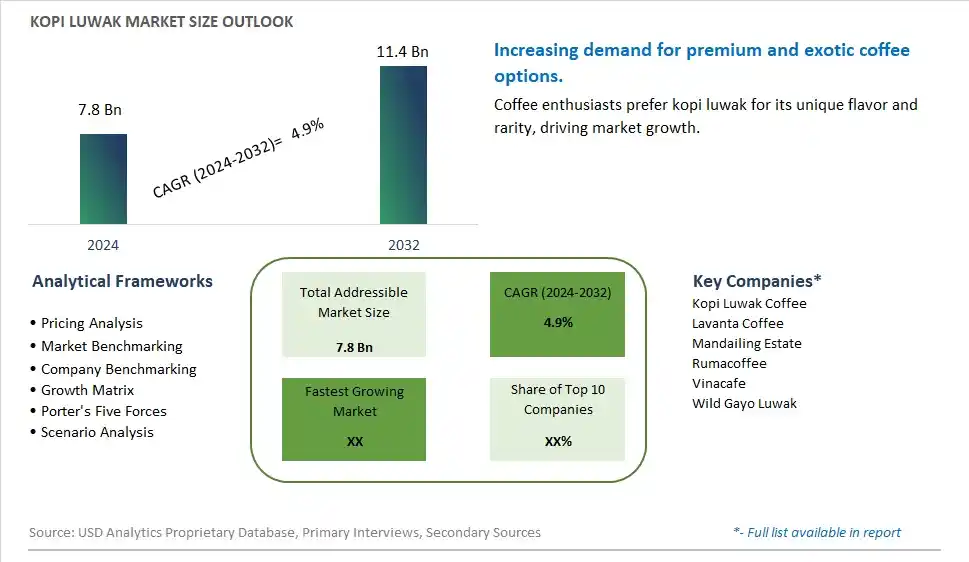
Global Kopi Luwak Market Size is valued at $7.8 Billion in 2024 and is forecast to register a growth rate (CAGR) of 4.9% to reach $11.4 Billion by 2032.
The global Kopi Luwak Market Comprehensive Study analyzes and forecasts the market size across 6 regions and 24 countries for diverse segments -By Type (Raw Coffee Beans, Cooked Beans), By Application (Online Sales, Offline Sales)
An Introduction to Kopi Luwak Market
The Kopi Luwak market in 2024 is thriving, driven by the rising demand for luxury and exotic coffee experiences. Kopi Luwak, also known as civet coffee, is produced from coffee beans that have been partially digested by the Asian palm civet, resulting in a unique flavor profile. The market is benefiting from the growing appreciation for specialty coffees and the willingness of consumers to pay premium prices for rare and unique products. Innovations in sustainable and ethical sourcing practices are enhancing the market appeal of Kopi Luwak. The trend towards artisanal and gourmet food products is supporting the growth of The niche market.
Kopi Luwak Competitive Landscape
The market report analyses the leading companies in the industry including Kopi Luwak Coffee, Lavanta Coffee, Mandailing Estate, Rumacoffee, Vinacafe, Wild Gayo Luwak, and Others.
Kopi Luwak Market Dynamics
Kopi Luwak Market Trend: Growing Demand for Luxury and Exotic Coffee
The most prominent trend in the Kopi Luwak Market is the growing demand for luxury and exotic coffee. Kopi Luwak, also known as civet coffee, is one of the most expensive and unique coffee varieties in the world, made from beans that have been eaten and excreted by civets. This trend is driven by coffee enthusiasts seeking rare and premium coffee experiences.
Kopi Luwak Market Driver: Rising Disposable Income and Affluent Consumer Base
A key driver in the Kopi Luwak Market is the rising disposable income and affluent consumer base. As more consumers have the means to spend on luxury products, there is an increasing willingness to pay a premium for unique and high-quality coffee like Kopi Luwak. This driver is further supported by the growth of specialty coffee shops and high-end cafes that offer exclusive coffee experiences.
Kopi Luwak Market Opportunity: Ethical and Sustainable Sourcing
One significant opportunity in the Kopi Luwak Market lies in ethical and sustainable sourcing. There is growing concern about the welfare of civets and the environmental impact of Kopi Luwak production. Companies that adopt ethical practices, such as sourcing beans from wild civets and implementing sustainable farming methods, can attract environmentally conscious consumers and differentiate their products in the market.
Kopi Luwak Market Share Analysis: Raw Coffee Beans segment generated the highest revenue share in the industry
The Raw Coffee Beans segment dominates the Kopi Luwak Market as the largest segment. Kopi Luwak, renowned for its unique production method involving civet cats, has gained global recognition for its distinct flavor profile and rarity. Raw coffee beans undergo a meticulous process where they are consumed and excreted by civet cats, undergoing fermentation in the animals' digestive tract before being collected, cleaned, and roasted. This process is believed to enhance the coffee's flavor by breaking down proteins that contribute to bitterness, resulting in a smoother and less acidic taste. The Raw Coffee Beans segment appeals to coffee enthusiasts seeking exotic and premium coffee experiences, driving its market growth. As consumer interest in specialty and gourmet coffee continues to rise worldwide, particularly among affluent demographics willing to pay a premium for unique and high-quality products, the Raw Coffee Beans segment of the Kopi Luwak Market is expected to expand significantly. This growth is further supported by the increasing availability of Kopi Luwak through online platforms and specialty coffee shops, catering to a niche but growing market segment seeking exceptional coffee experiences.
Kopi Luwak Market Share Analysis: Online Sales is the fastest growing segment over the forecast period to 2032
The Online Sales segment is experiencing rapid growth in the Kopi Luwak Market. As e-commerce platforms and digital channels continue to expand globally, the accessibility and availability of specialty products like Kopi Luwak have increased significantly. Online sales provide consumers with convenient access to rare and premium coffee varieties, including Kopi Luwak, which was traditionally limited to select coffee shops or specialty stores. The convenience of purchasing Kopi Luwak online appeals to a broader audience of coffee enthusiasts worldwide, driving the market's growth. Further, online platforms offer a platform for coffee producers and retailers to reach international markets, bypassing geographical limitations and reaching consumers who seek unique and exotic coffee experiences. This trend is bolstered by the rising consumer preference for shopping online, especially for high-value and exclusive products, contributing to the substantial growth of the Online Sales segment in the Kopi Luwak Market through 2032.
Kopi Luwak Market Segmentation
By Type
Raw Coffee Beans
Cooked Beans
By Application
Online Sales
Offline Sales
Countries Analyzed
North America (US, Canada, Mexico)
Europe (Germany, UK, France, Spain, Italy, Russia, Rest of Europe)
Asia Pacific (China, India, Japan, South Korea, Australia, South East Asia, Rest of Asia)
South America (Brazil, Argentina, Rest of South America)
Middle East and Africa (Saudi Arabia, UAE, Rest of Middle East, South Africa, Egypt, Rest of Africa)
Kopi Luwak Companies Profiled in the Study
Kopi Luwak Coffee
Lavanta Coffee
Mandailing Estate
Rumacoffee
Vinacafe
Wild Gayo Luwak
*- List Not Exhaustive
Chapter 1. TABLE OF CONTENTS
Chapter 2. Introduction to Kopi Luwak Market
2.1. Market Overview
2.2. Key Statistics and Report Highlights
2.3. Scope of the Comprehensive Study
2.3.1. Market Definition
2.3.2 Countries and Regions Covered
2.3.3 Research Objective
2.3.4 Units, Currency, and Conversions
2.3.5 Industry Value Chain
2.4. Key Market Segments
2.5. Key Companies
2.6. Study Period
Chapter 3. Strategic Analysis Review
3.1. Kopi Luwak Pricing Analysis and Forecast
3.2. Porter’s Five Forces
3.3. Market Ecosystem
3.4. SWOT Analysis
3.5. Regulatory Scenario
3.3. Effects of Inflation, Russia-Ukraine War, moderating economic growth, and other macroeconomic factors
Chapter 4. Competitive Landscape
4.1. Market Share Analysis
4.1.1. Global Kopi Luwak Market Share by Company, 2023
4.1.2. Product Offerings of Leading Kopi Luwak Companies
4.2. Market Entropy
4.2.1. New Product Launches in the Industry
4.2.2. Mergers, Acquisitions, Joint ventures, and Partnerships
4.3. Key Strategies and Best Practices
Chapter 5. Global Market Projections: Best, Reference, and Low Case Scenarios
5.1. Growth Analysis- Case Scenario Definitions
5.2. Low Growth Case Scenario Forecasts
5.3. Reference Growth Case Scenario Forecasts
5.4. High Growth Case Scenario Forecasts
Chapter 6. Market Dynamics
6.1. Kopi Luwak Market Drivers
6.2. Kopi Luwak Market Challenges
6.6. Kopi Luwak Market Opportunities
6.4. Kopi Luwak Market Trends
Chapter 7. Global Kopi Luwak Market Outlook Trends
7.1. Global Kopi Luwak Revenue (USD Million) and CAGR (%) by Type (2021-2032)
7.2. Global Kopi Luwak Revenue (USD Million) and CAGR (%) by Application (2021-2032)
7.3. Global Kopi Luwak Revenue (USD Million) and CAGR (%) by Product (2021-2032)
By Type
Raw Coffee Beans
Cooked Beans
By Application
Online Sales
Offline Sales
Chapter 8. Global Kopi Luwak Regional Analysis and Outlook
8.1. Global Kopi Luwak Revenue (USD Million) By Regions (2021- 2032)
8.2. North America Kopi Luwak Revenue (USD Million) by Country (2021-2032)
8.2.1. United States Kopi Luwak Regional Analysis and Outlook
8.2.2. Canada Kopi Luwak Regional Analysis and Outlook
8.2.3. Mexico Kopi Luwak Regional Analysis and Outlook
8.3. Europe Kopi Luwak Revenue (USD Million), by Country (2021-2032)
8.3.1. Germany Kopi Luwak Regional Analysis and Outlook
8.3.2. France Kopi Luwak Regional Analysis and Outlook
8.3.3. United Kingdom Kopi Luwak Regional Analysis and Outlook
8.3.4. Spain Kopi Luwak Regional Analysis and Outlook
8.3.5. Italy Kopi Luwak Regional Analysis and Outlook
8.3.6. Russia Kopi Luwak Regional Analysis and Outlook
8.3.7. Rest of Europe Kopi Luwak Regional Analysis and Outlook
8.4. Asia Pacific Kopi Luwak Revenue (USD Million) by Country (2021-2032)
8.4.1. China Kopi Luwak Regional Analysis and Outlook
8.4.2. Japan Kopi Luwak Regional Analysis and Outlook
8.4.3. India Kopi Luwak Regional Analysis and Outlook
8.4.4. South Korea Kopi Luwak Regional Analysis and Outlook
8.4.5. Australia Kopi Luwak Regional Analysis and Outlook
8.4.6. South East Asia Kopi Luwak Regional Analysis and Outlook
8.4.7. Rest of Asia Pacific Kopi Luwak Regional Analysis and Outlook
8.5. South America Kopi Luwak Revenue (USD Million), by Country (2021-2032)
8.5.1. Brazil Kopi Luwak Regional Analysis and Outlook
8.5.2. Argentina Kopi Luwak Regional Analysis and Outlook
8.5.3. Rest of South America Kopi Luwak Regional Analysis and Outlook
8.6. Middle East and Africa Kopi Luwak Revenue (USD Million) by Country (2021-2032)
8.6.1. Middle East Kopi Luwak Regional Analysis and Outlook
8.6.2. Africa Kopi Luwak Regional Analysis and Outlook
Chapter 9. North America Kopi Luwak Analysis and Outlook
9.1. North America Kopi Luwak Revenue (USD Million) by Segments (2021-2032)
9.1.1. North America Kopi Luwak Revenue (USD Million) by Type (2021-2032)
9.1.2. North America Kopi Luwak Revenue (USD Million) by Application (2021-2032)
9.1.3. North America Kopi Luwak Revenue (USD Million) by Product (2021-2032)
By Type
Raw Coffee Beans
Cooked Beans
By Application
Online Sales
Offline Sales
Chapter 10. Europe Kopi Luwak Analysis and Outlook
10.1. Europe Kopi Luwak Revenue (USD Million), by Segments (USD Million) (2021-2032)
10.1.1. Europe Kopi Luwak Revenue (USD Million) by Type (2021-2032)
10.1.2. Europe Kopi Luwak Revenue (USD Million) by Application (2021-2032)
10.1.3. Europe Kopi Luwak Revenue (USD Million) by Product (2021-2032)
By Type
Raw Coffee Beans
Cooked Beans
By Application
Online Sales
Offline Sales
Chapter 11. Asia Pacific Kopi Luwak Analysis and Outlook
11.1. Asia Pacific Kopi Luwak Revenue (USD Million), and Revenue (USD Million) by Segments (2021-2032)
11.1.1. Asia Pacific Kopi Luwak Revenue (USD Million) by Type (2021-2032)
11.1.2. Asia Pacific Kopi Luwak Revenue (USD Million) by Application (2021-2032)
11.1.3. Asia Pacific Kopi Luwak Revenue (USD Million) by Product (2021-2032)
By Type
Raw Coffee Beans
Cooked Beans
By Application
Online Sales
Offline Sales
Chapter 12. South America Kopi Luwak Analysis and Outlook
12.1. South America Kopi Luwak Revenue (USD Million), by Segments (2021-2032)
12.1.1. South America Kopi Luwak Revenue (USD Million) by Type (2021-2032)
12.1.2. South America Kopi Luwak Revenue (USD Million) by Application (2021-2032)
12.1.3. South America Kopi Luwak Revenue (USD Million) by Product (2021-2032)
By Type
Raw Coffee Beans
Cooked Beans
By Application
Online Sales
Offline Sales
Chapter 13. Middle East and Africa Kopi Luwak Analysis and Outlook
13.1. Middle East and Africa Kopi Luwak Revenue (USD Million), by Segments (2021-2032)
13.1.1. Middle East and Africa Kopi Luwak Revenue (USD Million) by Type (2021-2032)
13.1.2. Middle East and Africa Kopi Luwak Revenue (USD Million) by Application (2021-2032)
13.1.3. Middle East and Africa Kopi Luwak Revenue (USD Million) by Product (2021-2032)
By Type
Raw Coffee Beans
Cooked Beans
By Application
Online Sales
Offline Sales
Chapter 14. Kopi Luwak Company Profiles
14.1 Business Overview
14.2 Product Profiles
14.3 SWOT Profiles
14.5 Recent Developments
14.6 Financial Profile
List of Companies
Kopi Luwak Coffee
Lavanta Coffee
Mandailing Estate
Rumacoffee
Vinacafe
Wild Gayo Luwak
15. Methodology and Data Sources
15.1 Customization Offerings
15.2 Subscription Services
15.3 Related Reports
15.4 Publisher Expertise
LIST OF TABLES
Table 1 Market Segmentation Analysis
Table 2 Global Kopi Luwak Market Share of Leading Companies, 2023
Table 3 Product Offerings of Leading Companies
Table 4 Low Growth Scenario Forecasts
Table 5 Reference Case Growth Scenario
Table 6 High Growth Case Scenario
Table 7 Global Kopi Luwak Revenue (USD Million) And CAGR (%) By Type (2021-2032)
Table 8 Global Kopi Luwak Revenue (USD Million) And CAGR (%) By Application (2021-2032)
Table 9 Global Kopi Luwak Revenue (USD Million) And CAGR (%) By Product (2021-2032)
Table 10 Global Kopi Luwak Market Revenue (USD Million) By Regions (2021-2032)
Table 11 Global Kopi Luwak Market Share (%) By Regions (2021-2032)
Table 12 North America Kopi Luwak Revenue (USD Million) By Country (2021-2032)
Table 13 Europe Kopi Luwak Revenue (USD Million) By Country (2021-2032)
Table 14 Asia Pacific Kopi Luwak Revenue (USD Million) By Country (2021-2032)
Table 15 South America Kopi Luwak Revenue (USD Million) By Country (2021-2032)
Table 16 Middle East and Africa Kopi Luwak Revenue (USD Million) By Region (2021-2032)
Table 17 North America Kopi Luwak Revenue (USD Million) By Type (2021-2032)
Table 18 North America Kopi Luwak Revenue (USD Million) By Application (2021-2032)
Table 19 North America Kopi Luwak Revenue (USD Million) By Product (2021-2032)
Table 20 Europe Kopi Luwak Revenue (USD Million) By Type (2021-2032)
Table 21 Europe Kopi Luwak Revenue (USD Million) By Application (2021-2032)
Table 22 Europe Kopi Luwak Revenue (USD Million) By Product (2021-2032)
Table 23 Asia Pacific Kopi Luwak Revenue (USD Million) By Type (2021-2032)
Table 24 Asia Pacific Kopi Luwak Revenue (USD Million) By Application (2021-2032)
Table 25 Asia Pacific Kopi Luwak Revenue (USD Million) By Product (2021-2032)
Table 26 South America Kopi Luwak Revenue (USD Million) By Type (2021-2032)
Table 27 South America Kopi Luwak Revenue (USD Million) By Application (2021-2032)
Table 28 South America Kopi Luwak Revenue (USD Million) By Product (2021-2032)
Table 29 Middle East and Africa Kopi Luwak Revenue (USD Million) By Type (2021-2032)
Table 30 Middle East and Africa Kopi Luwak Revenue (USD Million) By Application (2021-2032)
Table 31 Middle East and Africa Kopi Luwak Revenue (USD Million) By Product (2021-2032)
LIST OF FIGURES
Figure 1. Market Scope
Figure 2. Pricing Forecasts Per Unit, 2023- 2032
Figure 3. Porter’s Five Forces
Figure 4. Global Kopi Luwak Market Revenue (USD Million) By Regions (2021-2032)
Figure 5. Global Kopi Luwak Market Share (%) By Regions (2023)
Figure 6. North America Kopi Luwak Revenue (USD Million) By Country (2021-2032)
Figure 7. United States Kopi Luwak Revenue (USD Million) By Country (2021-2032)
Figure 8. Canada Kopi Luwak Revenue (USD Million) By Country (2021-2032)
Figure 9. Mexico Kopi Luwak Revenue (USD Million) By Country (2021-2032)
Figure 10. Europe Kopi Luwak Revenue (USD Million) By Country (2021-2032)
Figure 11. Germany Kopi Luwak Revenue (USD Million) By Country (2021-2032)
Figure 12. France Kopi Luwak Revenue (USD Million) By Country (2021-2032)
Figure 13. United Kingdom Kopi Luwak Revenue (USD Million) By Country (2021-2032)
Figure 14. Spain Kopi Luwak Revenue (USD Million) By Country (2021-2032)
Figure 15. Italy Kopi Luwak Revenue (USD Million) By Country (2021-2032)
Figure 16. Russia Kopi Luwak Revenue (USD Million) By Country (2021-2032)
Figure 17. Rest of Europe Kopi Luwak Revenue (USD Million) By Country (2021-2032)
Figure 11. Asia Pacific Kopi Luwak Revenue (USD Million) By Country (2021-2032)
Figure 12. China Kopi Luwak Revenue (USD Million) By Country (2021-2032)
Figure 13. Japan Kopi Luwak Revenue (USD Million) By Country (2021-2032)
Figure 14. India Kopi Luwak Revenue (USD Million) By Country (2021-2032)
Figure 15. South Korea Kopi Luwak Revenue (USD Million) By Country (2021-2032)
Figure 16. Australia Kopi Luwak Revenue (USD Million) By Country (2021-2032)
Figure 17. South East Asia Kopi Luwak Revenue (USD Million) By Country (2021-2032)
Figure 18. South America Kopi Luwak Revenue (USD Million) By Country (2021-2032)
Figure 19. Brazil Kopi Luwak Revenue (USD Million) By Country (2021-2032)
Figure 20. Argentina Kopi Luwak Revenue (USD Million) By Country (2021-2032)
Figure 21. Rest of Asia Pacific Kopi Luwak Revenue (USD Million) By Country (2021-2032)
Figure 22. Middle East and Africa Kopi Luwak Revenue (USD Million) By Region (2021-2032)
Figure 23. Saudi Arabia Kopi Luwak Revenue (USD Million) By Region (2021-2032)
Figure 24. The UAE Kopi Luwak Revenue (USD Million) By Region (2021-2032)
Figure 25. Rest of Middle East Kopi Luwak Revenue (USD Million) By Region (2021-2032)
Figure 26. South Africa Kopi Luwak Revenue (USD Million) By Region (2021-2032)
Figure 27. Africa Kopi Luwak Revenue (USD Million) By Region (2021-2032)
Figure 28. North America Kopi Luwak Revenue (USD Million) By Type (2021-2032)
Figure 29. North America Kopi Luwak Revenue (USD Million) By Application (2021-2032)
Figure 30. North America Kopi Luwak Revenue (USD Million) By Product (2021-2032)
Figure 31. Europe Kopi Luwak Revenue (USD Million) By Type (2021-2032)
Figure 32. Europe Kopi Luwak Revenue (USD Million) By Application (2021-2032)
Figure 33. Europe Kopi Luwak Revenue (USD Million) By Product (2021-2032)
Figure 34. Asia Pacific Kopi Luwak Revenue (USD Million) By Type (2021-2032)
Figure 35. Asia Pacific Kopi Luwak Revenue (USD Million) By Application (2021-2032)
Figure 36. Asia Pacific Kopi Luwak Revenue (USD Million) By Product (2021-2032)
Figure 37. South America Kopi Luwak Revenue (USD Million) By Type (2021-2032)
Figure 38. South America Kopi Luwak Revenue (USD Million) By Application (2021-2032)
Figure 39. South America Kopi Luwak Revenue (USD Million) By Product (2021-2032)
Figure 40. Middle East and Africa Kopi Luwak Revenue (USD Million) By Type (2021-2032)
Figure 41. Middle East and Africa Kopi Luwak Revenue (USD Million) By Application (2021-2032)
Figure 42. Middle East and Africa Kopi Luwak Revenue (USD Million) By Product (2021-2032)
By Type
Raw Coffee Beans
Cooked Beans
By Application
Online Sales
Offline Sales
Countries Analyzed
North America (US, Canada, Mexico)
Europe (Germany, UK, France, Spain, Italy, Russia, Rest of Europe)
Asia Pacific (China, India, Japan, South Korea, Australia, South East Asia, Rest of Asia)
South America (Brazil, Argentina, Rest of South America)
Middle East and Africa (Saudi Arabia, UAE, Rest of Middle East, South Africa, Egypt, Rest of Africa)
