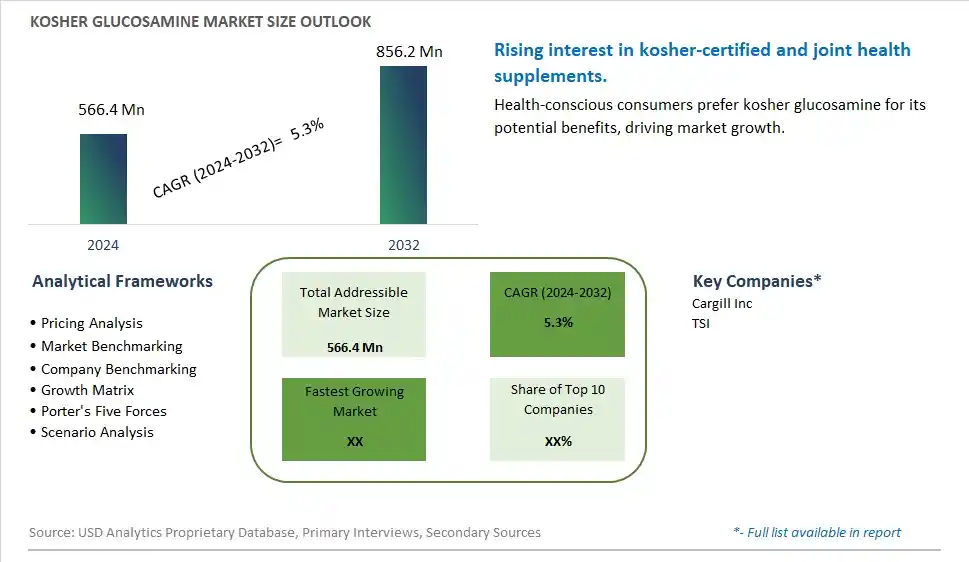
Global Kosher Glucosamine Market Size is valued at $566.4 Million in 2024 and is forecast to register a growth rate (CAGR) of 5.3% to reach $856.2 Million by 2032.
The global Kosher Glucosamine Market Comprehensive Study analyzes and forecasts the market size across 6 regions and 24 countries for diverse segments -By Type (Glucosamine Hydrochloride, Glucosamine Sulfate Potassium Chloride, Glucosamine Sulfate Sodium Chloride, N-Acetylglucosamine), By Application (Health Food, Medicine, Cosmetics)
An Introduction to Kosher Glucosamine Market
In 2024, the kosher glucosamine market is expanding rapidly, driven by the increasing demand for dietary supplements that comply with kosher dietary laws. Glucosamine, commonly used for joint health and arthritis relief, is seeing growing acceptance among health-conscious consumers who follow kosher practices. The market benefits from innovations in production processes that ensure compliance with kosher certification standards. The trend towards natural and clean label supplements is also influencing product development. Additionally, the rise of e-commerce is making kosher glucosamine supplements more accessible to a global consumer base.
Kosher Glucosamine Competitive Landscape
The market report analyses the leading companies in the industry including Cargill Inc, TSI, and Others.
Kosher Glucosamine Market Dynamics
Kosher Glucosamine Market Trend: Increasing Demand for Kosher-Certified Supplements
The most prominent trend in the Kosher Glucosamine Market is the increasing demand for kosher-certified supplements. As dietary supplements gain popularity, there is a growing segment of consumers seeking kosher-certified products to align with their dietary and religious practices. Kosher glucosamine, used for joint health, is becoming more prevalent in the supplement market due to this trend.
Kosher Glucosamine Market Driver: Growing Awareness of Joint Health and Mobility
A key driver in the Kosher Glucosamine Market is the growing awareness of joint health and mobility. As the aging population increases, more individuals are experiencing joint-related issues such as arthritis and are seeking effective supplements to manage their condition. Glucosamine, known for its benefits in maintaining joint health, is widely recommended, driving demand in the market.
Kosher Glucosamine Market Opportunity: Expansion into Functional Foods and Beverages
One significant opportunity in the Kosher Glucosamine Market lies in the expansion into functional foods and beverages. Companies can explore incorporating kosher glucosamine into various products such as fortified drinks, snacks, and meal replacements. By developing innovative and convenient delivery formats, manufacturers can attract a broader consumer base and drive market growth.
Kosher Glucosamine Market Share Analysis: Glucosamine Hydrochloride segment generated the highest revenue share in the industry
The Glucosamine Hydrochloride segment stands out as the largest in the Kosher Glucosamine Market. Glucosamine Hydrochloride is widely recognized for its potential health benefits, particularly in supporting joint health and mobility. It is commonly used as a dietary supplement to alleviate symptoms of osteoarthritis and other joint-related issues. The market dominance of Glucosamine Hydrochloride is driven by its superior bioavailability and efficacy compared to other forms of glucosamine. Further, the kosher certification adds an additional layer of appeal to health-conscious consumers, ensuring the product meets strict dietary guidelines and cultural preferences. As the aging population grows globally and awareness of joint health increases, the demand for Glucosamine Hydrochloride is expected to continue growing steadily. Manufacturers are also innovating by incorporating Glucosamine Hydrochloride into various formulations such as tablets, capsules, and powders, further fueling its market dominance in the Kosher Glucosamine segment.
Kosher Glucosamine Market Share Analysis: Health Food is the fastest growing segment over the forecast period to 2032
The Health Food segment emerges as the fastest-growing in the Kosher Glucosamine Market. This growth is driven by increasing consumer awareness and demand for natural supplements that promote overall well-being and joint health. Kosher-certified Glucosamine products are particularly sought after among health-conscious consumers who adhere to kosher dietary laws. Health foods fortified with Glucosamine appeal to a broad demographic seeking preventive healthcare solutions, especially as the aging population continues to grow globally. The market's rapid expansion is also supported by the versatility of Glucosamine in health food applications, including dietary supplements, functional foods, and nutraceuticals. Manufacturers are capitalizing on this trend by innovating with new product formulations and expanding distribution channels to reach a wider audience. As consumer preferences shift towards holistic health and wellness, the Health Food segment is poised for substantial growth in the Kosher Glucosamine Market through 2032.
Kosher Glucosamine Market Segmentation
By Type
Glucosamine Hydrochloride
Glucosamine Sulfate Potassium Chloride
Glucosamine Sulfate Sodium Chloride
N-Acetylglucosamine
By Application
Health Food
Medicine
Cosmetics
Countries Analyzed
North America (US, Canada, Mexico)
Europe (Germany, UK, France, Spain, Italy, Russia, Rest of Europe)
Asia Pacific (China, India, Japan, South Korea, Australia, South East Asia, Rest of Asia)
South America (Brazil, Argentina, Rest of South America)
Middle East and Africa (Saudi Arabia, UAE, Rest of Middle East, South Africa, Egypt, Rest of Africa)
Kosher Glucosamine Companies Profiled in the Study
Cargill Inc
TSI
*- List Not Exhaustive
Chapter 1. TABLE OF CONTENTS
Chapter 2. Introduction to Kosher Glucosamine Market
2.1. Market Overview
2.2. Key Statistics and Report Highlights
2.3. Scope of the Comprehensive Study
2.3.1. Market Definition
2.3.2 Countries and Regions Covered
2.3.3 Research Objective
2.3.4 Units, Currency, and Conversions
2.3.5 Industry Value Chain
2.4. Key Market Segments
2.5. Key Companies
2.6. Study Period
Chapter 3. Strategic Analysis Review
3.1. Kosher Glucosamine Pricing Analysis and Forecast
3.2. Porter’s Five Forces
3.3. Market Ecosystem
3.4. SWOT Analysis
3.5. Regulatory Scenario
3.3. Effects of Inflation, Russia-Ukraine War, moderating economic growth, and other macroeconomic factors
Chapter 4. Competitive Landscape
4.1. Market Share Analysis
4.1.1. Global Kosher Glucosamine Market Share by Company, 2023
4.1.2. Product Offerings of Leading Kosher Glucosamine Companies
4.2. Market Entropy
4.2.1. New Product Launches in the Industry
4.2.2. Mergers, Acquisitions, Joint ventures, and Partnerships
4.3. Key Strategies and Best Practices
Chapter 5. Global Market Projections: Best, Reference, and Low Case Scenarios
5.1. Growth Analysis- Case Scenario Definitions
5.2. Low Growth Case Scenario Forecasts
5.3. Reference Growth Case Scenario Forecasts
5.4. High Growth Case Scenario Forecasts
Chapter 6. Market Dynamics
6.1. Kosher Glucosamine Market Drivers
6.2. Kosher Glucosamine Market Challenges
6.6. Kosher Glucosamine Market Opportunities
6.4. Kosher Glucosamine Market Trends
Chapter 7. Global Kosher Glucosamine Market Outlook Trends
7.1. Global Kosher Glucosamine Revenue (USD Million) and CAGR (%) by Type (2021-2032)
7.2. Global Kosher Glucosamine Revenue (USD Million) and CAGR (%) by Application (2021-2032)
7.3. Global Kosher Glucosamine Revenue (USD Million) and CAGR (%) by Product (2021-2032)
By Type
Glucosamine Hydrochloride
Glucosamine Sulfate Potassium Chloride
Glucosamine Sulfate Sodium Chloride
N-Acetylglucosamine
By Application
Health Food
Medicine
Cosmetics
Chapter 8. Global Kosher Glucosamine Regional Analysis and Outlook
8.1. Global Kosher Glucosamine Revenue (USD Million) By Regions (2021- 2032)
8.2. North America Kosher Glucosamine Revenue (USD Million) by Country (2021-2032)
8.2.1. United States Kosher Glucosamine Regional Analysis and Outlook
8.2.2. Canada Kosher Glucosamine Regional Analysis and Outlook
8.2.3. Mexico Kosher Glucosamine Regional Analysis and Outlook
8.3. Europe Kosher Glucosamine Revenue (USD Million), by Country (2021-2032)
8.3.1. Germany Kosher Glucosamine Regional Analysis and Outlook
8.3.2. France Kosher Glucosamine Regional Analysis and Outlook
8.3.3. United Kingdom Kosher Glucosamine Regional Analysis and Outlook
8.3.4. Spain Kosher Glucosamine Regional Analysis and Outlook
8.3.5. Italy Kosher Glucosamine Regional Analysis and Outlook
8.3.6. Russia Kosher Glucosamine Regional Analysis and Outlook
8.3.7. Rest of Europe Kosher Glucosamine Regional Analysis and Outlook
8.4. Asia Pacific Kosher Glucosamine Revenue (USD Million) by Country (2021-2032)
8.4.1. China Kosher Glucosamine Regional Analysis and Outlook
8.4.2. Japan Kosher Glucosamine Regional Analysis and Outlook
8.4.3. India Kosher Glucosamine Regional Analysis and Outlook
8.4.4. South Korea Kosher Glucosamine Regional Analysis and Outlook
8.4.5. Australia Kosher Glucosamine Regional Analysis and Outlook
8.4.6. South East Asia Kosher Glucosamine Regional Analysis and Outlook
8.4.7. Rest of Asia Pacific Kosher Glucosamine Regional Analysis and Outlook
8.5. South America Kosher Glucosamine Revenue (USD Million), by Country (2021-2032)
8.5.1. Brazil Kosher Glucosamine Regional Analysis and Outlook
8.5.2. Argentina Kosher Glucosamine Regional Analysis and Outlook
8.5.3. Rest of South America Kosher Glucosamine Regional Analysis and Outlook
8.6. Middle East and Africa Kosher Glucosamine Revenue (USD Million) by Country (2021-2032)
8.6.1. Middle East Kosher Glucosamine Regional Analysis and Outlook
8.6.2. Africa Kosher Glucosamine Regional Analysis and Outlook
Chapter 9. North America Kosher Glucosamine Analysis and Outlook
9.1. North America Kosher Glucosamine Revenue (USD Million) by Segments (2021-2032)
9.1.1. North America Kosher Glucosamine Revenue (USD Million) by Type (2021-2032)
9.1.2. North America Kosher Glucosamine Revenue (USD Million) by Application (2021-2032)
9.1.3. North America Kosher Glucosamine Revenue (USD Million) by Product (2021-2032)
By Type
Glucosamine Hydrochloride
Glucosamine Sulfate Potassium Chloride
Glucosamine Sulfate Sodium Chloride
N-Acetylglucosamine
By Application
Health Food
Medicine
Cosmetics
Chapter 10. Europe Kosher Glucosamine Analysis and Outlook
10.1. Europe Kosher Glucosamine Revenue (USD Million), by Segments (USD Million) (2021-2032)
10.1.1. Europe Kosher Glucosamine Revenue (USD Million) by Type (2021-2032)
10.1.2. Europe Kosher Glucosamine Revenue (USD Million) by Application (2021-2032)
10.1.3. Europe Kosher Glucosamine Revenue (USD Million) by Product (2021-2032)
By Type
Glucosamine Hydrochloride
Glucosamine Sulfate Potassium Chloride
Glucosamine Sulfate Sodium Chloride
N-Acetylglucosamine
By Application
Health Food
Medicine
Cosmetics
Chapter 11. Asia Pacific Kosher Glucosamine Analysis and Outlook
11.1. Asia Pacific Kosher Glucosamine Revenue (USD Million), and Revenue (USD Million) by Segments (2021-2032)
11.1.1. Asia Pacific Kosher Glucosamine Revenue (USD Million) by Type (2021-2032)
11.1.2. Asia Pacific Kosher Glucosamine Revenue (USD Million) by Application (2021-2032)
11.1.3. Asia Pacific Kosher Glucosamine Revenue (USD Million) by Product (2021-2032)
By Type
Glucosamine Hydrochloride
Glucosamine Sulfate Potassium Chloride
Glucosamine Sulfate Sodium Chloride
N-Acetylglucosamine
By Application
Health Food
Medicine
Cosmetics
Chapter 12. South America Kosher Glucosamine Analysis and Outlook
12.1. South America Kosher Glucosamine Revenue (USD Million), by Segments (2021-2032)
12.1.1. South America Kosher Glucosamine Revenue (USD Million) by Type (2021-2032)
12.1.2. South America Kosher Glucosamine Revenue (USD Million) by Application (2021-2032)
12.1.3. South America Kosher Glucosamine Revenue (USD Million) by Product (2021-2032)
By Type
Glucosamine Hydrochloride
Glucosamine Sulfate Potassium Chloride
Glucosamine Sulfate Sodium Chloride
N-Acetylglucosamine
By Application
Health Food
Medicine
Cosmetics
Chapter 13. Middle East and Africa Kosher Glucosamine Analysis and Outlook
13.1. Middle East and Africa Kosher Glucosamine Revenue (USD Million), by Segments (2021-2032)
13.1.1. Middle East and Africa Kosher Glucosamine Revenue (USD Million) by Type (2021-2032)
13.1.2. Middle East and Africa Kosher Glucosamine Revenue (USD Million) by Application (2021-2032)
13.1.3. Middle East and Africa Kosher Glucosamine Revenue (USD Million) by Product (2021-2032)
By Type
Glucosamine Hydrochloride
Glucosamine Sulfate Potassium Chloride
Glucosamine Sulfate Sodium Chloride
N-Acetylglucosamine
By Application
Health Food
Medicine
Cosmetics
Chapter 14. Kosher Glucosamine Company Profiles
14.1 Business Overview
14.2 Product Profiles
14.3 SWOT Profiles
14.5 Recent Developments
14.6 Financial Profile
List of Companies
Cargill Inc
TSI
15. Methodology and Data Sources
15.1 Customization Offerings
15.2 Subscription Services
15.3 Related Reports
15.4 Publisher Expertise
LIST OF TABLES
Table 1 Market Segmentation Analysis
Table 2 Global Kosher Glucosamine Market Share of Leading Companies, 2023
Table 3 Product Offerings of Leading Companies
Table 4 Low Growth Scenario Forecasts
Table 5 Reference Case Growth Scenario
Table 6 High Growth Case Scenario
Table 7 Global Kosher Glucosamine Revenue (USD Million) And CAGR (%) By Type (2021-2032)
Table 8 Global Kosher Glucosamine Revenue (USD Million) And CAGR (%) By Application (2021-2032)
Table 9 Global Kosher Glucosamine Revenue (USD Million) And CAGR (%) By Product (2021-2032)
Table 10 Global Kosher Glucosamine Market Revenue (USD Million) By Regions (2021-2032)
Table 11 Global Kosher Glucosamine Market Share (%) By Regions (2021-2032)
Table 12 North America Kosher Glucosamine Revenue (USD Million) By Country (2021-2032)
Table 13 Europe Kosher Glucosamine Revenue (USD Million) By Country (2021-2032)
Table 14 Asia Pacific Kosher Glucosamine Revenue (USD Million) By Country (2021-2032)
Table 15 South America Kosher Glucosamine Revenue (USD Million) By Country (2021-2032)
Table 16 Middle East and Africa Kosher Glucosamine Revenue (USD Million) By Region (2021-2032)
Table 17 North America Kosher Glucosamine Revenue (USD Million) By Type (2021-2032)
Table 18 North America Kosher Glucosamine Revenue (USD Million) By Application (2021-2032)
Table 19 North America Kosher Glucosamine Revenue (USD Million) By Product (2021-2032)
Table 20 Europe Kosher Glucosamine Revenue (USD Million) By Type (2021-2032)
Table 21 Europe Kosher Glucosamine Revenue (USD Million) By Application (2021-2032)
Table 22 Europe Kosher Glucosamine Revenue (USD Million) By Product (2021-2032)
Table 23 Asia Pacific Kosher Glucosamine Revenue (USD Million) By Type (2021-2032)
Table 24 Asia Pacific Kosher Glucosamine Revenue (USD Million) By Application (2021-2032)
Table 25 Asia Pacific Kosher Glucosamine Revenue (USD Million) By Product (2021-2032)
Table 26 South America Kosher Glucosamine Revenue (USD Million) By Type (2021-2032)
Table 27 South America Kosher Glucosamine Revenue (USD Million) By Application (2021-2032)
Table 28 South America Kosher Glucosamine Revenue (USD Million) By Product (2021-2032)
Table 29 Middle East and Africa Kosher Glucosamine Revenue (USD Million) By Type (2021-2032)
Table 30 Middle East and Africa Kosher Glucosamine Revenue (USD Million) By Application (2021-2032)
Table 31 Middle East and Africa Kosher Glucosamine Revenue (USD Million) By Product (2021-2032)
LIST OF FIGURES
Figure 1. Market Scope
Figure 2. Pricing Forecasts Per Unit, 2023- 2032
Figure 3. Porter’s Five Forces
Figure 4. Global Kosher Glucosamine Market Revenue (USD Million) By Regions (2021-2032)
Figure 5. Global Kosher Glucosamine Market Share (%) By Regions (2023)
Figure 6. North America Kosher Glucosamine Revenue (USD Million) By Country (2021-2032)
Figure 7. United States Kosher Glucosamine Revenue (USD Million) By Country (2021-2032)
Figure 8. Canada Kosher Glucosamine Revenue (USD Million) By Country (2021-2032)
Figure 9. Mexico Kosher Glucosamine Revenue (USD Million) By Country (2021-2032)
Figure 10. Europe Kosher Glucosamine Revenue (USD Million) By Country (2021-2032)
Figure 11. Germany Kosher Glucosamine Revenue (USD Million) By Country (2021-2032)
Figure 12. France Kosher Glucosamine Revenue (USD Million) By Country (2021-2032)
Figure 13. United Kingdom Kosher Glucosamine Revenue (USD Million) By Country (2021-2032)
Figure 14. Spain Kosher Glucosamine Revenue (USD Million) By Country (2021-2032)
Figure 15. Italy Kosher Glucosamine Revenue (USD Million) By Country (2021-2032)
Figure 16. Russia Kosher Glucosamine Revenue (USD Million) By Country (2021-2032)
Figure 17. Rest of Europe Kosher Glucosamine Revenue (USD Million) By Country (2021-2032)
Figure 11. Asia Pacific Kosher Glucosamine Revenue (USD Million) By Country (2021-2032)
Figure 12. China Kosher Glucosamine Revenue (USD Million) By Country (2021-2032)
Figure 13. Japan Kosher Glucosamine Revenue (USD Million) By Country (2021-2032)
Figure 14. India Kosher Glucosamine Revenue (USD Million) By Country (2021-2032)
Figure 15. South Korea Kosher Glucosamine Revenue (USD Million) By Country (2021-2032)
Figure 16. Australia Kosher Glucosamine Revenue (USD Million) By Country (2021-2032)
Figure 17. South East Asia Kosher Glucosamine Revenue (USD Million) By Country (2021-2032)
Figure 18. South America Kosher Glucosamine Revenue (USD Million) By Country (2021-2032)
Figure 19. Brazil Kosher Glucosamine Revenue (USD Million) By Country (2021-2032)
Figure 20. Argentina Kosher Glucosamine Revenue (USD Million) By Country (2021-2032)
Figure 21. Rest of Asia Pacific Kosher Glucosamine Revenue (USD Million) By Country (2021-2032)
Figure 22. Middle East and Africa Kosher Glucosamine Revenue (USD Million) By Region (2021-2032)
Figure 23. Saudi Arabia Kosher Glucosamine Revenue (USD Million) By Region (2021-2032)
Figure 24. The UAE Kosher Glucosamine Revenue (USD Million) By Region (2021-2032)
Figure 25. Rest of Middle East Kosher Glucosamine Revenue (USD Million) By Region (2021-2032)
Figure 26. South Africa Kosher Glucosamine Revenue (USD Million) By Region (2021-2032)
Figure 27. Africa Kosher Glucosamine Revenue (USD Million) By Region (2021-2032)
Figure 28. North America Kosher Glucosamine Revenue (USD Million) By Type (2021-2032)
Figure 29. North America Kosher Glucosamine Revenue (USD Million) By Application (2021-2032)
Figure 30. North America Kosher Glucosamine Revenue (USD Million) By Product (2021-2032)
Figure 31. Europe Kosher Glucosamine Revenue (USD Million) By Type (2021-2032)
Figure 32. Europe Kosher Glucosamine Revenue (USD Million) By Application (2021-2032)
Figure 33. Europe Kosher Glucosamine Revenue (USD Million) By Product (2021-2032)
Figure 34. Asia Pacific Kosher Glucosamine Revenue (USD Million) By Type (2021-2032)
Figure 35. Asia Pacific Kosher Glucosamine Revenue (USD Million) By Application (2021-2032)
Figure 36. Asia Pacific Kosher Glucosamine Revenue (USD Million) By Product (2021-2032)
Figure 37. South America Kosher Glucosamine Revenue (USD Million) By Type (2021-2032)
Figure 38. South America Kosher Glucosamine Revenue (USD Million) By Application (2021-2032)
Figure 39. South America Kosher Glucosamine Revenue (USD Million) By Product (2021-2032)
Figure 40. Middle East and Africa Kosher Glucosamine Revenue (USD Million) By Type (2021-2032)
Figure 41. Middle East and Africa Kosher Glucosamine Revenue (USD Million) By Application (2021-2032)
Figure 42. Middle East and Africa Kosher Glucosamine Revenue (USD Million) By Product (2021-2032)
By Type
Glucosamine Hydrochloride
Glucosamine Sulfate Potassium Chloride
Glucosamine Sulfate Sodium Chloride
N-Acetylglucosamine
By Application
Health Food
Medicine
Cosmetics
Countries Analyzed
North America (US, Canada, Mexico)
Europe (Germany, UK, France, Spain, Italy, Russia, Rest of Europe)
Asia Pacific (China, India, Japan, South Korea, Australia, South East Asia, Rest of Asia)
South America (Brazil, Argentina, Rest of South America)
Middle East and Africa (Saudi Arabia, UAE, Rest of Middle East, South Africa, Egypt, Rest of Africa)
