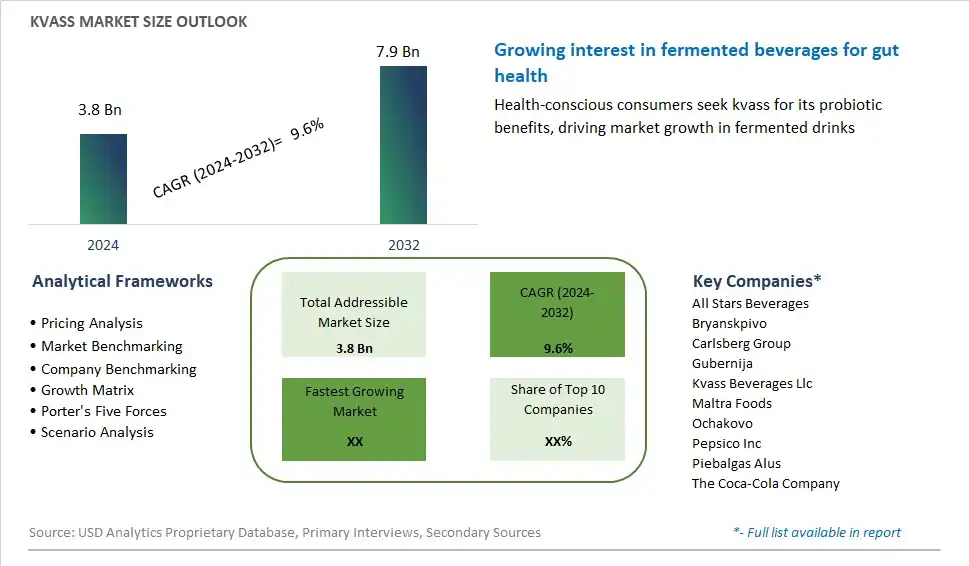
Global Kvass Market Size is valued at $3.8 Billion in 2024 and is forecast to register a growth rate (CAGR) of 9.6% to reach $7.9 Billion by 2032.
The global Kvass Market Comprehensive Study analyzes and forecasts the market size across 6 regions and 24 countries for diverse segments -By Flavor (Apple, Lemon, Cherry, Mint, Beets, Strawberry, Others), By Packaging (Bottle, Can, Others), By Price Point (Premium, Mass), By Distribution Channel (Supermarkets/Hypermarkets, Convenience Store, E-Commerce, Food service, Others)
An Introduction to Kvass Market
The kvass market in 2024 is witnessing significant growth, driven by the rising popularity of fermented beverages and the increasing consumer interest in traditional and probiotic-rich drinks. Kvass, a traditional Slavic beverage made from fermented bread, offers a unique taste profile and health benefits associated with natural fermentation. The market benefits from the growing trend towards functional beverages and the rising demand for non-alcoholic alternatives. Innovations in kvass production, including flavor variations and enhanced fermentation techniques, have expanded its appeal to a broader audience. Additionally, the trend towards natural and artisanal products supports the adoption of kvass. As consumers continue to explore diverse and healthful beverage options, the market for kvass is poised for significant expansion.
Kvass Competitive Landscape
The market report analyses the leading companies in the industry including All Stars Beverages, Bryanskpivo, Carlsberg Group, Gubernija, Kvass Beverages Llc, Maltra Foods, Ochakovo, Pepsico Inc, Piebalgas Alus, The Coca-Cola Company, and Others.
Kvass Market Dynamics
Kvass Market Trend: Growing Interest in Fermented Beverages and Probiotics
A prominent trend in the kvass market is the growing interest in fermented beverages and probiotics. As consumers become more health-conscious and seek out gut-friendly products to support digestive health and overall well-being, there's a rising demand for traditional fermented drinks like kvass. Originating from Eastern Europe, kvass is a fermented beverage made from rye bread or other grains, known for its tangy flavor and probiotic properties. This trend is driven by factors such as increasing awareness of the importance of gut health, the popularity of fermented foods and beverages in wellness circles, and the desire for natural and artisanal products with functional benefits. Additionally, the versatility of kvass as a refreshing beverage and culinary ingredient appeals to consumers looking for unique and flavorful alternatives to conventional soft drinks and juices. As interest in fermented beverages and probiotics continues to grow, driven by consumer interest in holistic health and wellness, the demand for kvass is expected to increase, driving market expansion and innovation in kvass-based products.
Market Driver: Shift Towards Healthier Beverage Choices and Functional Ingredients
An essential driver fueling the kvass market is the shift towards healthier beverage choices and functional ingredients among consumers seeking alternatives to sugary and artificially sweetened drinks. With increasing concerns about the negative health effects of excessive sugar consumption and artificial additives in beverages, there's a growing preference for natural and functional ingredients that offer nutritional benefits and support overall health. Kvass, with its natural fermentation process and probiotic content, is well-positioned to meet this demand as a healthier beverage option that provides hydration, refreshment, and digestive support. This driver is reinforced by factors such as changing consumer attitudes towards health and wellness, the rise of clean label and transparent ingredient trends, and the influence of health-conscious millennials and Generation Z consumers in driving market demand for better-for-you products. Additionally, the nostalgic appeal of traditional and artisanal beverages like kvass resonates with consumers seeking authentic and culturally rich drinking experiences. As consumers prioritize health and wellness in their beverage choices, the demand for kvass as a functional and flavorful alternative to mainstream beverages is expected to grow, driving market growth and adoption of kvass-based products.
Market Opportunity: Innovation in Flavor Varieties and Product Formulations
A significant opportunity within the kvass market lies in innovation in flavor varieties and product formulations to appeal to diverse consumer preferences and market segments. Beyond traditional rye-based kvass, there's potential to develop a wide range of flavor options and formulations that cater to modern tastes and dietary preferences. This opportunity encompasses the development of fruit-infused kvass varieties, such as apple, cherry, and berry, to offer a refreshing twist on classic recipes and attract consumers looking for fruity and flavorful beverages. Additionally, there's an opportunity to explore functional ingredient additions, such as herbs, spices, and botanical extracts, to enhance the nutritional profile and health benefits of kvass-based products. By expanding the flavor and formulation options, manufacturers can capitalize on opportunities to differentiate their products, reach new consumer demographics, and drive market growth through product innovation and diversification. As consumer demand for flavorful and functional beverages continues to rise, driven by factors such as taste preferences, health considerations, and lifestyle trends, the market for kvass presents significant opportunities for creativity, differentiation, and market expansion.
Kvass Market Share Analysis: Apple held the dominant market share in 2024
The apple flavor segment is the largest segment in the kvass market due to its widespread popularity, refreshing taste, and versatile appeal to consumers across different demographics. Apple-flavored kvass offers a harmonious blend of sweet and tart notes, reminiscent of traditional apple cider, making it a favored choice among consumers seeking a refreshing and thirst-quenching beverage option. Further, the familiarity of apple flavor and its association with health benefits contribute to its widespread acceptance and consumption. Additionally, the growing consumer interest in natural and fruit-based beverages further drives the demand for apple-flavored kvass as a healthier alternative to sugary sodas and artificial drinks. With its refreshing taste profile, broad consumer appeal, and alignment with health-conscious trends, the apple flavor segment maintains its dominance in the kvass market, catering to the evolving preferences of beverage enthusiasts worldwide.
Kvass Market Share Analysis: Can market is poised to register the fastest growth rae over the forecast period to 2032
The can segment is the fastest-growing segment in the kvass market, driven by shifting consumer preferences, convenience, and evolving packaging trends. Canned kvass offers numerous advantages, including portability, durability, and ease of storage, making it an ideal choice for on-the-go consumption and outdoor activities. Additionally, cans provide better protection against light and oxygen, preserving the freshness and flavor of kvass for longer periods compared to other packaging options. Further, the rising environmental consciousness among consumers prompts the preference for recyclable and eco-friendly packaging solutions, with aluminum cans being highly recyclable and contributing to sustainability efforts. Furthermore, the convenience of single-serve canned kvass appeals to busy lifestyles and impulse purchases, driving impulse sales and expanding market reach. With these factors in play, the can segment is poised for rapid growth in the kvass market, reflecting changing consumer behaviors and preferences towards convenient and sustainable packaging options.
Kvass Market Share Analysis: Mass held the dominant market share in 2024
The mass segment is the largest segment in the kvass market due to its accessibility, affordability, and broader consumer appeal. Mass-market kvass products are positioned as value-for-money options, offering consumers a refreshing and traditional beverage experience at competitive prices. With a focus on affordability, these products target a wide demographic range, including budget-conscious consumers and those seeking everyday refreshment without breaking the bank. Further, the mass segment benefits from extensive distribution networks, strong brand presence, and economies of scale, further solidifying its dominance in the market. Additionally, as kvass gains popularity as an alternative to carbonated soft drinks and sugary beverages, the mass segment captures a larger share of the market by catering to the diverse tastes and preferences of mainstream consumers. With its accessibility and competitive pricing, the mass segment continues to drive growth and expansion in the kvass market, serving as a cornerstone for market penetration and consumer adoption.
Kvass Market Segmentation
By Flavor
Apple
Lemon
Cherry
Mint
Beets
Strawberry
Others
By Packaging
Bottle
Can
Others
By Price Point
Premium
Mass
By Distribution Channel
Supermarkets/Hypermarkets
Convenience Store
E-Commerce
Food service
Others
Countries Analyzed
North America (US, Canada, Mexico)
Europe (Germany, UK, France, Spain, Italy, Russia, Rest of Europe)
Asia Pacific (China, India, Japan, South Korea, Australia, South East Asia, Rest of Asia)
South America (Brazil, Argentina, Rest of South America)
Middle East and Africa (Saudi Arabia, UAE, Rest of Middle East, South Africa, Egypt, Rest of Africa)
Kvass Companies Profiled in the Study
All Stars Beverages
Bryanskpivo
Carlsberg Group
Gubernija
Kvass Beverages Llc
Maltra Foods
Ochakovo
Pepsico Inc
Piebalgas Alus
The Coca-Cola Company
*- List Not Exhaustive
Chapter 1. TABLE OF CONTENTS
Chapter 2. Introduction to Kvass Market
2.1. Market Overview
2.2. Key Statistics and Report Highlights
2.3. Scope of the Comprehensive Study
2.3.1. Market Definition
2.3.2 Countries and Regions Covered
2.3.3 Research Objective
2.3.4 Units, Currency, and Conversions
2.3.5 Industry Value Chain
2.4. Key Market Segments
2.5. Key Companies
2.6. Study Period
Chapter 3. Strategic Analysis Review
3.1. Kvass Pricing Analysis and Forecast
3.2. Porter’s Five Forces
3.3. Market Ecosystem
3.4. SWOT Analysis
3.5. Regulatory Scenario
3.3. Effects of Inflation, Russia-Ukraine War, moderating economic growth, and other macroeconomic factors
Chapter 4. Competitive Landscape
4.1. Market Share Analysis
4.1.1. Global Kvass Market Share by Company, 2023
4.1.2. Product Offerings of Leading Kvass Companies
4.2. Market Entropy
4.2.1. New Product Launches in the Industry
4.2.2. Mergers, Acquisitions, Joint ventures, and Partnerships
4.3. Key Strategies and Best Practices
Chapter 5. Global Market Projections: Best, Reference, and Low Case Scenarios
5.1. Growth Analysis- Case Scenario Definitions
5.2. Low Growth Case Scenario Forecasts
5.3. Reference Growth Case Scenario Forecasts
5.4. High Growth Case Scenario Forecasts
Chapter 6. Market Dynamics
6.1. Kvass Market Drivers
6.2. Kvass Market Challenges
6.6. Kvass Market Opportunities
6.4. Kvass Market Trends
Chapter 7. Global Kvass Market Outlook Trends
7.1. Global Kvass Revenue (USD Million) and CAGR (%) by Type (2021-2032)
7.2. Global Kvass Revenue (USD Million) and CAGR (%) by Application (2021-2032)
7.3. Global Kvass Revenue (USD Million) and CAGR (%) by Product (2021-2032)
By Flavor
Apple
Lemon
Cherry
Mint
Beets
Strawberry
Others
By Packaging
Bottle
Can
Others
By Price Point
Premium
Mass
By Distribution Channel
Supermarkets/Hypermarkets
Convenience Store
E-Commerce
Food service
Others
Chapter 8. Global Kvass Regional Analysis and Outlook
8.1. Global Kvass Revenue (USD Million) By Regions (2021- 2032)
8.2. North America Kvass Revenue (USD Million) by Country (2021-2032)
8.2.1. United States Kvass Regional Analysis and Outlook
8.2.2. Canada Kvass Regional Analysis and Outlook
8.2.3. Mexico Kvass Regional Analysis and Outlook
8.3. Europe Kvass Revenue (USD Million), by Country (2021-2032)
8.3.1. Germany Kvass Regional Analysis and Outlook
8.3.2. France Kvass Regional Analysis and Outlook
8.3.3. United Kingdom Kvass Regional Analysis and Outlook
8.3.4. Spain Kvass Regional Analysis and Outlook
8.3.5. Italy Kvass Regional Analysis and Outlook
8.3.6. Russia Kvass Regional Analysis and Outlook
8.3.7. Rest of Europe Kvass Regional Analysis and Outlook
8.4. Asia Pacific Kvass Revenue (USD Million) by Country (2021-2032)
8.4.1. China Kvass Regional Analysis and Outlook
8.4.2. Japan Kvass Regional Analysis and Outlook
8.4.3. India Kvass Regional Analysis and Outlook
8.4.4. South Korea Kvass Regional Analysis and Outlook
8.4.5. Australia Kvass Regional Analysis and Outlook
8.4.6. South East Asia Kvass Regional Analysis and Outlook
8.4.7. Rest of Asia Pacific Kvass Regional Analysis and Outlook
8.5. South America Kvass Revenue (USD Million), by Country (2021-2032)
8.5.1. Brazil Kvass Regional Analysis and Outlook
8.5.2. Argentina Kvass Regional Analysis and Outlook
8.5.3. Rest of South America Kvass Regional Analysis and Outlook
8.6. Middle East and Africa Kvass Revenue (USD Million) by Country (2021-2032)
8.6.1. Middle East Kvass Regional Analysis and Outlook
8.6.2. Africa Kvass Regional Analysis and Outlook
Chapter 9. North America Kvass Analysis and Outlook
9.1. North America Kvass Revenue (USD Million) by Segments (2021-2032)
9.1.1. North America Kvass Revenue (USD Million) by Type (2021-2032)
9.1.2. North America Kvass Revenue (USD Million) by Application (2021-2032)
9.1.3. North America Kvass Revenue (USD Million) by Product (2021-2032)
By Flavor
Apple
Lemon
Cherry
Mint
Beets
Strawberry
Others
By Packaging
Bottle
Can
Others
By Price Point
Premium
Mass
By Distribution Channel
Supermarkets/Hypermarkets
Convenience Store
E-Commerce
Food service
Others
Chapter 10. Europe Kvass Analysis and Outlook
10.1. Europe Kvass Revenue (USD Million), by Segments (USD Million) (2021-2032)
10.1.1. Europe Kvass Revenue (USD Million) by Type (2021-2032)
10.1.2. Europe Kvass Revenue (USD Million) by Application (2021-2032)
10.1.3. Europe Kvass Revenue (USD Million) by Product (2021-2032)
By Flavor
Apple
Lemon
Cherry
Mint
Beets
Strawberry
Others
By Packaging
Bottle
Can
Others
By Price Point
Premium
Mass
By Distribution Channel
Supermarkets/Hypermarkets
Convenience Store
E-Commerce
Food service
Others
Chapter 11. Asia Pacific Kvass Analysis and Outlook
11.1. Asia Pacific Kvass Revenue (USD Million), and Revenue (USD Million) by Segments (2021-2032)
11.1.1. Asia Pacific Kvass Revenue (USD Million) by Type (2021-2032)
11.1.2. Asia Pacific Kvass Revenue (USD Million) by Application (2021-2032)
11.1.3. Asia Pacific Kvass Revenue (USD Million) by Product (2021-2032)
By Flavor
Apple
Lemon
Cherry
Mint
Beets
Strawberry
Others
By Packaging
Bottle
Can
Others
By Price Point
Premium
Mass
By Distribution Channel
Supermarkets/Hypermarkets
Convenience Store
E-Commerce
Food service
Others
Chapter 12. South America Kvass Analysis and Outlook
12.1. South America Kvass Revenue (USD Million), by Segments (2021-2032)
12.1.1. South America Kvass Revenue (USD Million) by Type (2021-2032)
12.1.2. South America Kvass Revenue (USD Million) by Application (2021-2032)
12.1.3. South America Kvass Revenue (USD Million) by Product (2021-2032)
By Flavor
Apple
Lemon
Cherry
Mint
Beets
Strawberry
Others
By Packaging
Bottle
Can
Others
By Price Point
Premium
Mass
By Distribution Channel
Supermarkets/Hypermarkets
Convenience Store
E-Commerce
Food service
Others
Chapter 13. Middle East and Africa Kvass Analysis and Outlook
13.1. Middle East and Africa Kvass Revenue (USD Million), by Segments (2021-2032)
13.1.1. Middle East and Africa Kvass Revenue (USD Million) by Type (2021-2032)
13.1.2. Middle East and Africa Kvass Revenue (USD Million) by Application (2021-2032)
13.1.3. Middle East and Africa Kvass Revenue (USD Million) by Product (2021-2032)
By Flavor
Apple
Lemon
Cherry
Mint
Beets
Strawberry
Others
By Packaging
Bottle
Can
Others
By Price Point
Premium
Mass
By Distribution Channel
Supermarkets/Hypermarkets
Convenience Store
E-Commerce
Food service
Others
Chapter 14. Kvass Company Profiles
14.1 Business Overview
14.2 Product Profiles
14.3 SWOT Profiles
14.5 Recent Developments
14.6 Financial Profile
List of Companies
All Stars Beverages
Bryanskpivo
Carlsberg Group
Gubernija
Kvass Beverages Llc
Maltra Foods
Ochakovo
Pepsico Inc
Piebalgas Alus
The Coca-Cola Company
15. Methodology and Data Sources
15.1 Customization Offerings
15.2 Subscription Services
15.3 Related Reports
15.4 Publisher Expertise
LIST OF TABLES
Table 1 Market Segmentation Analysis
Table 2 Global Kvass Market Share of Leading Companies, 2023
Table 3 Product Offerings of Leading Companies
Table 4 Low Growth Scenario Forecasts
Table 5 Reference Case Growth Scenario
Table 6 High Growth Case Scenario
Table 7 Global Kvass Revenue (USD Million) And CAGR (%) By Type (2021-2032)
Table 8 Global Kvass Revenue (USD Million) And CAGR (%) By Application (2021-2032)
Table 9 Global Kvass Revenue (USD Million) And CAGR (%) By Product (2021-2032)
Table 10 Global Kvass Market Revenue (USD Million) By Regions (2021-2032)
Table 11 Global Kvass Market Share (%) By Regions (2021-2032)
Table 12 North America Kvass Revenue (USD Million) By Country (2021-2032)
Table 13 Europe Kvass Revenue (USD Million) By Country (2021-2032)
Table 14 Asia Pacific Kvass Revenue (USD Million) By Country (2021-2032)
Table 15 South America Kvass Revenue (USD Million) By Country (2021-2032)
Table 16 Middle East and Africa Kvass Revenue (USD Million) By Region (2021-2032)
Table 17 North America Kvass Revenue (USD Million) By Type (2021-2032)
Table 18 North America Kvass Revenue (USD Million) By Application (2021-2032)
Table 19 North America Kvass Revenue (USD Million) By Product (2021-2032)
Table 20 Europe Kvass Revenue (USD Million) By Type (2021-2032)
Table 21 Europe Kvass Revenue (USD Million) By Application (2021-2032)
Table 22 Europe Kvass Revenue (USD Million) By Product (2021-2032)
Table 23 Asia Pacific Kvass Revenue (USD Million) By Type (2021-2032)
Table 24 Asia Pacific Kvass Revenue (USD Million) By Application (2021-2032)
Table 25 Asia Pacific Kvass Revenue (USD Million) By Product (2021-2032)
Table 26 South America Kvass Revenue (USD Million) By Type (2021-2032)
Table 27 South America Kvass Revenue (USD Million) By Application (2021-2032)
Table 28 South America Kvass Revenue (USD Million) By Product (2021-2032)
Table 29 Middle East and Africa Kvass Revenue (USD Million) By Type (2021-2032)
Table 30 Middle East and Africa Kvass Revenue (USD Million) By Application (2021-2032)
Table 31 Middle East and Africa Kvass Revenue (USD Million) By Product (2021-2032)
LIST OF FIGURES
Figure 1. Market Scope
Figure 2. Pricing Forecasts Per Unit, 2023- 2032
Figure 3. Porter’s Five Forces
Figure 4. Global Kvass Market Revenue (USD Million) By Regions (2021-2032)
Figure 5. Global Kvass Market Share (%) By Regions (2023)
Figure 6. North America Kvass Revenue (USD Million) By Country (2021-2032)
Figure 7. United States Kvass Revenue (USD Million) By Country (2021-2032)
Figure 8. Canada Kvass Revenue (USD Million) By Country (2021-2032)
Figure 9. Mexico Kvass Revenue (USD Million) By Country (2021-2032)
Figure 10. Europe Kvass Revenue (USD Million) By Country (2021-2032)
Figure 11. Germany Kvass Revenue (USD Million) By Country (2021-2032)
Figure 12. France Kvass Revenue (USD Million) By Country (2021-2032)
Figure 13. United Kingdom Kvass Revenue (USD Million) By Country (2021-2032)
Figure 14. Spain Kvass Revenue (USD Million) By Country (2021-2032)
Figure 15. Italy Kvass Revenue (USD Million) By Country (2021-2032)
Figure 16. Russia Kvass Revenue (USD Million) By Country (2021-2032)
Figure 17. Rest of Europe Kvass Revenue (USD Million) By Country (2021-2032)
Figure 11. Asia Pacific Kvass Revenue (USD Million) By Country (2021-2032)
Figure 12. China Kvass Revenue (USD Million) By Country (2021-2032)
Figure 13. Japan Kvass Revenue (USD Million) By Country (2021-2032)
Figure 14. India Kvass Revenue (USD Million) By Country (2021-2032)
Figure 15. South Korea Kvass Revenue (USD Million) By Country (2021-2032)
Figure 16. Australia Kvass Revenue (USD Million) By Country (2021-2032)
Figure 17. South East Asia Kvass Revenue (USD Million) By Country (2021-2032)
Figure 18. South America Kvass Revenue (USD Million) By Country (2021-2032)
Figure 19. Brazil Kvass Revenue (USD Million) By Country (2021-2032)
Figure 20. Argentina Kvass Revenue (USD Million) By Country (2021-2032)
Figure 21. Rest of Asia Pacific Kvass Revenue (USD Million) By Country (2021-2032)
Figure 22. Middle East and Africa Kvass Revenue (USD Million) By Region (2021-2032)
Figure 23. Saudi Arabia Kvass Revenue (USD Million) By Region (2021-2032)
Figure 24. The UAE Kvass Revenue (USD Million) By Region (2021-2032)
Figure 25. Rest of Middle East Kvass Revenue (USD Million) By Region (2021-2032)
Figure 26. South Africa Kvass Revenue (USD Million) By Region (2021-2032)
Figure 27. Africa Kvass Revenue (USD Million) By Region (2021-2032)
Figure 28. North America Kvass Revenue (USD Million) By Type (2021-2032)
Figure 29. North America Kvass Revenue (USD Million) By Application (2021-2032)
Figure 30. North America Kvass Revenue (USD Million) By Product (2021-2032)
Figure 31. Europe Kvass Revenue (USD Million) By Type (2021-2032)
Figure 32. Europe Kvass Revenue (USD Million) By Application (2021-2032)
Figure 33. Europe Kvass Revenue (USD Million) By Product (2021-2032)
Figure 34. Asia Pacific Kvass Revenue (USD Million) By Type (2021-2032)
Figure 35. Asia Pacific Kvass Revenue (USD Million) By Application (2021-2032)
Figure 36. Asia Pacific Kvass Revenue (USD Million) By Product (2021-2032)
Figure 37. South America Kvass Revenue (USD Million) By Type (2021-2032)
Figure 38. South America Kvass Revenue (USD Million) By Application (2021-2032)
Figure 39. South America Kvass Revenue (USD Million) By Product (2021-2032)
Figure 40. Middle East and Africa Kvass Revenue (USD Million) By Type (2021-2032)
Figure 41. Middle East and Africa Kvass Revenue (USD Million) By Application (2021-2032)
Figure 42. Middle East and Africa Kvass Revenue (USD Million) By Product (2021-2032)
By Flavor
Apple
Lemon
Cherry
Mint
Beets
Strawberry
Others
By Packaging
Bottle
Can
Others
By Price Point
Premium
Mass
By Distribution Channel
Supermarkets/Hypermarkets
Convenience Store
E-Commerce
Food service
Others
Countries Analyzed
North America (US, Canada, Mexico)
Europe (Germany, UK, France, Spain, Italy, Russia, Rest of Europe)
Asia Pacific (China, India, Japan, South Korea, Australia, South East Asia, Rest of Asia)
South America (Brazil, Argentina, Rest of South America)
Middle East and Africa (Saudi Arabia, UAE, Rest of Middle East, South Africa, Egypt, Rest of Africa)
