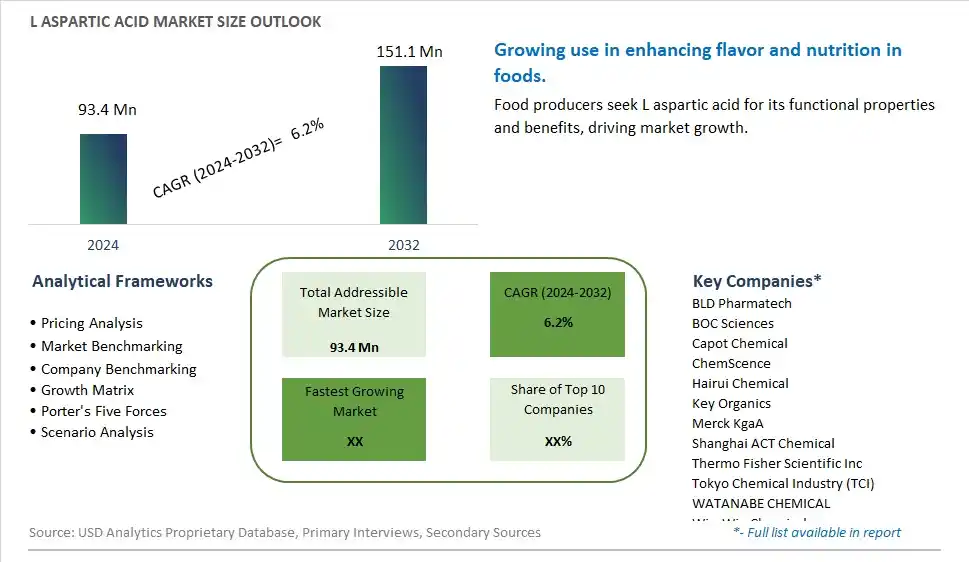
Global L aspartic acid Market Size is valued at $93.4 Million in 2024 and is forecast to register a growth rate (CAGR) of 6.2% to reach $151.1 Million by 2032.
The global L aspartic acid Market Comprehensive Study analyzes and forecasts the market size across 6 regions and 24 countries for diverse segments -By Type (97% Purity, 98% Purity, 99% Purity, Others), By Application (Industrial, Laboratories, Others)
An Introduction to L aspartic acid Market
The L aspartic acid market in 2024 is experiencing significant growth, driven by its extensive use in the food, pharmaceutical, and cosmetics industries. L aspartic acid, an amino acid, is valued for its role in protein synthesis and metabolic functions. The market is benefiting from increasing demand for amino acid supplements and functional foods that support overall health and wellness. Innovations in fermentation and extraction technologies are enhancing the quality and yield of L aspartic acid. The trend towards clean label and natural ingredients is also influencing market dynamics, with a focus on sustainable and eco-friendly production methods.
L aspartic acid Competitive Landscape
The market report analyses the leading companies in the industry including BLD Pharmatech, BOC Sciences, Capot Chemical, ChemScence, Hairui Chemical, Key Organics, Merck KgaA, Shanghai ACT Chemical, Thermo Fisher Scientific Inc, Tokyo Chemical Industry (TCI), WATANABE CHEMICAL, Win-Win Chemical, and Others.
L aspartic acid Market Dynamics
L Aspartic Acid Market Trend: Increasing Use in Nutraceuticals and Dietary Supplements
The most prominent trend in the L Aspartic Acid Market is the increasing use of L aspartic acid in nutraceuticals and dietary supplements. L aspartic acid, an amino acid that plays a role in energy production and metabolism, is gaining popularity as an ingredient in supplements aimed at enhancing physical performance and overall health. This trend is driven by the growing consumer interest in fitness and wellness.
L Aspartic Acid Market Driver: Rising Demand for Sports Nutrition Products
A key driver in the L Aspartic Acid Market is the rising demand for sports nutrition products. As more individuals engage in regular physical activity and seek to improve their athletic performance, there is an increasing demand for supplements that support muscle growth, endurance, and recovery. L aspartic acid, known for its role in protein synthesis and energy production, is a valuable component in sports nutrition formulations.
L Aspartic Acid Market Opportunity: Innovation in Functional Food Applications
One significant opportunity in the L Aspartic Acid Market lies in innovation in functional food applications. Companies can explore incorporating L aspartic acid into a variety of functional foods and beverages, such as protein bars, energy drinks, and meal replacements. By developing new and appealing products that leverage the benefits of L aspartic acid, manufacturers can attract health-conscious consumers and drive market growth.
L aspartic acid Market Share Analysis: 99% Purity segment generated the highest revenue share in the industry
The 99% Purity segment stands out as the largest in the L-aspartic acid market. This high purity grade is highly sought after across various industries due to its superior quality and effectiveness in applications such as pharmaceuticals, food additives, and cosmetics. L-aspartic acid with 99% purity is particularly valued in pharmaceutical formulations where precision and consistency are critical for therapeutic efficacy. The segment's dominance can be attributed to the stringent quality standards required in pharmaceutical and food industries, where purity directly impacts product performance and safety. Manufacturers are investing in advanced purification technologies to meet the growing demand for high-purity L-aspartic acid, driven by increasing applications in health supplements and pharmaceuticals aimed at enhancing cognitive function and athletic performance. As consumer awareness grows regarding the benefits of amino acids, especially in high-purity forms, the 99% Purity segment is expected to maintain its leadership position in the L-aspartic acid market in the foreseeable future.
L aspartic acid Market Share Analysis: Laboratories is the fastest growing segment over the forecast period to 2032
The Laboratories segment emerges as the fastest-growing application in the L-aspartic acid market projected up to 2032. This growth is driven by increasing research and development activities across pharmaceuticals, biotechnology, and academic sectors. L-aspartic acid, renowned for its role as a building block in protein synthesis and its use in cell culture media, finds extensive application in laboratories conducting biochemistry, molecular biology, and pharmaceutical research. The rising demand for amino acids in these laboratories is fueled by advancements in biotechnology and healthcare, where L-aspartic acid serves as a crucial component in the formulation of diagnostic reagents, cell culture media, and therapeutic agents. Further, the expanding scope of personalized medicine and genomic research further propels the demand for high-purity L-aspartic acid in laboratories, as researchers seek precise and reliable components for their studies. As laboratories continue to innovate and expand their capabilities, the Laboratories segment is poised for substantial growth, supported by ongoing technological advancements and increasing investments in biomedical research globally.
L aspartic acid Market Segmentation
By Type
97% Purity
98% Purity
99% Purity
Others
By Application
Industrial
Laboratories
Others
Countries Analyzed
North America (US, Canada, Mexico)
Europe (Germany, UK, France, Spain, Italy, Russia, Rest of Europe)
Asia Pacific (China, India, Japan, South Korea, Australia, South East Asia, Rest of Asia)
South America (Brazil, Argentina, Rest of South America)
Middle East and Africa (Saudi Arabia, UAE, Rest of Middle East, South Africa, Egypt, Rest of Africa)
L aspartic acid Companies Profiled in the Study
BLD Pharmatech
BOC Sciences
Capot Chemical
ChemScence
Hairui Chemical
Key Organics
Merck KgaA
Shanghai ACT Chemical
Thermo Fisher Scientific Inc
Tokyo Chemical Industry (TCI)
WATANABE CHEMICAL
Win-Win Chemical
*- List Not Exhaustive
Chapter 1. TABLE OF CONTENTS
Chapter 2. Introduction to L aspartic acid Market
2.1. Market Overview
2.2. Key Statistics and Report Highlights
2.3. Scope of the Comprehensive Study
2.3.1. Market Definition
2.3.2 Countries and Regions Covered
2.3.3 Research Objective
2.3.4 Units, Currency, and Conversions
2.3.5 Industry Value Chain
2.4. Key Market Segments
2.5. Key Companies
2.6. Study Period
Chapter 3. Strategic Analysis Review
3.1. L aspartic acid Pricing Analysis and Forecast
3.2. Porter’s Five Forces
3.3. Market Ecosystem
3.4. SWOT Analysis
3.5. Regulatory Scenario
3.3. Effects of Inflation, Russia-Ukraine War, moderating economic growth, and other macroeconomic factors
Chapter 4. Competitive Landscape
4.1. Market Share Analysis
4.1.1. Global L aspartic acid Market Share by Company, 2023
4.1.2. Product Offerings of Leading L aspartic acid Companies
4.2. Market Entropy
4.2.1. New Product Launches in the Industry
4.2.2. Mergers, Acquisitions, Joint ventures, and Partnerships
4.3. Key Strategies and Best Practices
Chapter 5. Global Market Projections: Best, Reference, and Low Case Scenarios
5.1. Growth Analysis- Case Scenario Definitions
5.2. Low Growth Case Scenario Forecasts
5.3. Reference Growth Case Scenario Forecasts
5.4. High Growth Case Scenario Forecasts
Chapter 6. Market Dynamics
6.1. L aspartic acid Market Drivers
6.2. L aspartic acid Market Challenges
6.6. L aspartic acid Market Opportunities
6.4. L aspartic acid Market Trends
Chapter 7. Global L aspartic acid Market Outlook Trends
7.1. Global L aspartic acid Revenue (USD Million) and CAGR (%) by Type (2021-2032)
7.2. Global L aspartic acid Revenue (USD Million) and CAGR (%) by Application (2021-2032)
7.3. Global L aspartic acid Revenue (USD Million) and CAGR (%) by Product (2021-2032)
By Type
97% Purity
98% Purity
99% Purity
Others
By Application
Industrial
Laboratories
Others
Chapter 8. Global L aspartic acid Regional Analysis and Outlook
8.1. Global L aspartic acid Revenue (USD Million) By Regions (2021- 2032)
8.2. North America L aspartic acid Revenue (USD Million) by Country (2021-2032)
8.2.1. United States L aspartic acid Regional Analysis and Outlook
8.2.2. Canada L aspartic acid Regional Analysis and Outlook
8.2.3. Mexico L aspartic acid Regional Analysis and Outlook
8.3. Europe L aspartic acid Revenue (USD Million), by Country (2021-2032)
8.3.1. Germany L aspartic acid Regional Analysis and Outlook
8.3.2. France L aspartic acid Regional Analysis and Outlook
8.3.3. United Kingdom L aspartic acid Regional Analysis and Outlook
8.3.4. Spain L aspartic acid Regional Analysis and Outlook
8.3.5. Italy L aspartic acid Regional Analysis and Outlook
8.3.6. Russia L aspartic acid Regional Analysis and Outlook
8.3.7. Rest of Europe L aspartic acid Regional Analysis and Outlook
8.4. Asia Pacific L aspartic acid Revenue (USD Million) by Country (2021-2032)
8.4.1. China L aspartic acid Regional Analysis and Outlook
8.4.2. Japan L aspartic acid Regional Analysis and Outlook
8.4.3. India L aspartic acid Regional Analysis and Outlook
8.4.4. South Korea L aspartic acid Regional Analysis and Outlook
8.4.5. Australia L aspartic acid Regional Analysis and Outlook
8.4.6. South East Asia L aspartic acid Regional Analysis and Outlook
8.4.7. Rest of Asia Pacific L aspartic acid Regional Analysis and Outlook
8.5. South America L aspartic acid Revenue (USD Million), by Country (2021-2032)
8.5.1. Brazil L aspartic acid Regional Analysis and Outlook
8.5.2. Argentina L aspartic acid Regional Analysis and Outlook
8.5.3. Rest of South America L aspartic acid Regional Analysis and Outlook
8.6. Middle East and Africa L aspartic acid Revenue (USD Million) by Country (2021-2032)
8.6.1. Middle East L aspartic acid Regional Analysis and Outlook
8.6.2. Africa L aspartic acid Regional Analysis and Outlook
Chapter 9. North America L aspartic acid Analysis and Outlook
9.1. North America L aspartic acid Revenue (USD Million) by Segments (2021-2032)
9.1.1. North America L aspartic acid Revenue (USD Million) by Type (2021-2032)
9.1.2. North America L aspartic acid Revenue (USD Million) by Application (2021-2032)
9.1.3. North America L aspartic acid Revenue (USD Million) by Product (2021-2032)
By Type
97% Purity
98% Purity
99% Purity
Others
By Application
Industrial
Laboratories
Others
Chapter 10. Europe L aspartic acid Analysis and Outlook
10.1. Europe L aspartic acid Revenue (USD Million), by Segments (USD Million) (2021-2032)
10.1.1. Europe L aspartic acid Revenue (USD Million) by Type (2021-2032)
10.1.2. Europe L aspartic acid Revenue (USD Million) by Application (2021-2032)
10.1.3. Europe L aspartic acid Revenue (USD Million) by Product (2021-2032)
By Type
97% Purity
98% Purity
99% Purity
Others
By Application
Industrial
Laboratories
Others
Chapter 11. Asia Pacific L aspartic acid Analysis and Outlook
11.1. Asia Pacific L aspartic acid Revenue (USD Million), and Revenue (USD Million) by Segments (2021-2032)
11.1.1. Asia Pacific L aspartic acid Revenue (USD Million) by Type (2021-2032)
11.1.2. Asia Pacific L aspartic acid Revenue (USD Million) by Application (2021-2032)
11.1.3. Asia Pacific L aspartic acid Revenue (USD Million) by Product (2021-2032)
By Type
97% Purity
98% Purity
99% Purity
Others
By Application
Industrial
Laboratories
Others
Chapter 12. South America L aspartic acid Analysis and Outlook
12.1. South America L aspartic acid Revenue (USD Million), by Segments (2021-2032)
12.1.1. South America L aspartic acid Revenue (USD Million) by Type (2021-2032)
12.1.2. South America L aspartic acid Revenue (USD Million) by Application (2021-2032)
12.1.3. South America L aspartic acid Revenue (USD Million) by Product (2021-2032)
By Type
97% Purity
98% Purity
99% Purity
Others
By Application
Industrial
Laboratories
Others
Chapter 13. Middle East and Africa L aspartic acid Analysis and Outlook
13.1. Middle East and Africa L aspartic acid Revenue (USD Million), by Segments (2021-2032)
13.1.1. Middle East and Africa L aspartic acid Revenue (USD Million) by Type (2021-2032)
13.1.2. Middle East and Africa L aspartic acid Revenue (USD Million) by Application (2021-2032)
13.1.3. Middle East and Africa L aspartic acid Revenue (USD Million) by Product (2021-2032)
By Type
97% Purity
98% Purity
99% Purity
Others
By Application
Industrial
Laboratories
Others
Chapter 14. L aspartic acid Company Profiles
14.1 Business Overview
14.2 Product Profiles
14.3 SWOT Profiles
14.5 Recent Developments
14.6 Financial Profile
List of Companies
BLD Pharmatech
BOC Sciences
Capot Chemical
ChemScence
Hairui Chemical
Key Organics
Merck KgaA
Shanghai ACT Chemical
Thermo Fisher Scientific Inc
Tokyo Chemical Industry (TCI)
WATANABE CHEMICAL
Win-Win Chemical
15. Methodology and Data Sources
15.1 Customization Offerings
15.2 Subscription Services
15.3 Related Reports
15.4 Publisher Expertise
LIST OF TABLES
Table 1 Market Segmentation Analysis
Table 2 Global L aspartic acid Market Share of Leading Companies, 2023
Table 3 Product Offerings of Leading Companies
Table 4 Low Growth Scenario Forecasts
Table 5 Reference Case Growth Scenario
Table 6 High Growth Case Scenario
Table 7 Global L aspartic acid Revenue (USD Million) And CAGR (%) By Type (2021-2032)
Table 8 Global L aspartic acid Revenue (USD Million) And CAGR (%) By Application (2021-2032)
Table 9 Global L aspartic acid Revenue (USD Million) And CAGR (%) By Product (2021-2032)
Table 10 Global L aspartic acid Market Revenue (USD Million) By Regions (2021-2032)
Table 11 Global L aspartic acid Market Share (%) By Regions (2021-2032)
Table 12 North America L aspartic acid Revenue (USD Million) By Country (2021-2032)
Table 13 Europe L aspartic acid Revenue (USD Million) By Country (2021-2032)
Table 14 Asia Pacific L aspartic acid Revenue (USD Million) By Country (2021-2032)
Table 15 South America L aspartic acid Revenue (USD Million) By Country (2021-2032)
Table 16 Middle East and Africa L aspartic acid Revenue (USD Million) By Region (2021-2032)
Table 17 North America L aspartic acid Revenue (USD Million) By Type (2021-2032)
Table 18 North America L aspartic acid Revenue (USD Million) By Application (2021-2032)
Table 19 North America L aspartic acid Revenue (USD Million) By Product (2021-2032)
Table 20 Europe L aspartic acid Revenue (USD Million) By Type (2021-2032)
Table 21 Europe L aspartic acid Revenue (USD Million) By Application (2021-2032)
Table 22 Europe L aspartic acid Revenue (USD Million) By Product (2021-2032)
Table 23 Asia Pacific L aspartic acid Revenue (USD Million) By Type (2021-2032)
Table 24 Asia Pacific L aspartic acid Revenue (USD Million) By Application (2021-2032)
Table 25 Asia Pacific L aspartic acid Revenue (USD Million) By Product (2021-2032)
Table 26 South America L aspartic acid Revenue (USD Million) By Type (2021-2032)
Table 27 South America L aspartic acid Revenue (USD Million) By Application (2021-2032)
Table 28 South America L aspartic acid Revenue (USD Million) By Product (2021-2032)
Table 29 Middle East and Africa L aspartic acid Revenue (USD Million) By Type (2021-2032)
Table 30 Middle East and Africa L aspartic acid Revenue (USD Million) By Application (2021-2032)
Table 31 Middle East and Africa L aspartic acid Revenue (USD Million) By Product (2021-2032)
LIST OF FIGURES
Figure 1. Market Scope
Figure 2. Pricing Forecasts Per Unit, 2023- 2032
Figure 3. Porter’s Five Forces
Figure 4. Global L aspartic acid Market Revenue (USD Million) By Regions (2021-2032)
Figure 5. Global L aspartic acid Market Share (%) By Regions (2023)
Figure 6. North America L aspartic acid Revenue (USD Million) By Country (2021-2032)
Figure 7. United States L aspartic acid Revenue (USD Million) By Country (2021-2032)
Figure 8. Canada L aspartic acid Revenue (USD Million) By Country (2021-2032)
Figure 9. Mexico L aspartic acid Revenue (USD Million) By Country (2021-2032)
Figure 10. Europe L aspartic acid Revenue (USD Million) By Country (2021-2032)
Figure 11. Germany L aspartic acid Revenue (USD Million) By Country (2021-2032)
Figure 12. France L aspartic acid Revenue (USD Million) By Country (2021-2032)
Figure 13. United Kingdom L aspartic acid Revenue (USD Million) By Country (2021-2032)
Figure 14. Spain L aspartic acid Revenue (USD Million) By Country (2021-2032)
Figure 15. Italy L aspartic acid Revenue (USD Million) By Country (2021-2032)
Figure 16. Russia L aspartic acid Revenue (USD Million) By Country (2021-2032)
Figure 17. Rest of Europe L aspartic acid Revenue (USD Million) By Country (2021-2032)
Figure 11. Asia Pacific L aspartic acid Revenue (USD Million) By Country (2021-2032)
Figure 12. China L aspartic acid Revenue (USD Million) By Country (2021-2032)
Figure 13. Japan L aspartic acid Revenue (USD Million) By Country (2021-2032)
Figure 14. India L aspartic acid Revenue (USD Million) By Country (2021-2032)
Figure 15. South Korea L aspartic acid Revenue (USD Million) By Country (2021-2032)
Figure 16. Australia L aspartic acid Revenue (USD Million) By Country (2021-2032)
Figure 17. South East Asia L aspartic acid Revenue (USD Million) By Country (2021-2032)
Figure 18. South America L aspartic acid Revenue (USD Million) By Country (2021-2032)
Figure 19. Brazil L aspartic acid Revenue (USD Million) By Country (2021-2032)
Figure 20. Argentina L aspartic acid Revenue (USD Million) By Country (2021-2032)
Figure 21. Rest of Asia Pacific L aspartic acid Revenue (USD Million) By Country (2021-2032)
Figure 22. Middle East and Africa L aspartic acid Revenue (USD Million) By Region (2021-2032)
Figure 23. Saudi Arabia L aspartic acid Revenue (USD Million) By Region (2021-2032)
Figure 24. The UAE L aspartic acid Revenue (USD Million) By Region (2021-2032)
Figure 25. Rest of Middle East L aspartic acid Revenue (USD Million) By Region (2021-2032)
Figure 26. South Africa L aspartic acid Revenue (USD Million) By Region (2021-2032)
Figure 27. Africa L aspartic acid Revenue (USD Million) By Region (2021-2032)
Figure 28. North America L aspartic acid Revenue (USD Million) By Type (2021-2032)
Figure 29. North America L aspartic acid Revenue (USD Million) By Application (2021-2032)
Figure 30. North America L aspartic acid Revenue (USD Million) By Product (2021-2032)
Figure 31. Europe L aspartic acid Revenue (USD Million) By Type (2021-2032)
Figure 32. Europe L aspartic acid Revenue (USD Million) By Application (2021-2032)
Figure 33. Europe L aspartic acid Revenue (USD Million) By Product (2021-2032)
Figure 34. Asia Pacific L aspartic acid Revenue (USD Million) By Type (2021-2032)
Figure 35. Asia Pacific L aspartic acid Revenue (USD Million) By Application (2021-2032)
Figure 36. Asia Pacific L aspartic acid Revenue (USD Million) By Product (2021-2032)
Figure 37. South America L aspartic acid Revenue (USD Million) By Type (2021-2032)
Figure 38. South America L aspartic acid Revenue (USD Million) By Application (2021-2032)
Figure 39. South America L aspartic acid Revenue (USD Million) By Product (2021-2032)
Figure 40. Middle East and Africa L aspartic acid Revenue (USD Million) By Type (2021-2032)
Figure 41. Middle East and Africa L aspartic acid Revenue (USD Million) By Application (2021-2032)
Figure 42. Middle East and Africa L aspartic acid Revenue (USD Million) By Product (2021-2032)
By Type
97% Purity
98% Purity
99% Purity
Others
By Application
Industrial
Laboratories
Others
Countries Analyzed
North America (US, Canada, Mexico)
Europe (Germany, UK, France, Spain, Italy, Russia, Rest of Europe)
Asia Pacific (China, India, Japan, South Korea, Australia, South East Asia, Rest of Asia)
South America (Brazil, Argentina, Rest of South America)
Middle East and Africa (Saudi Arabia, UAE, Rest of Middle East, South Africa, Egypt, Rest of Africa)
