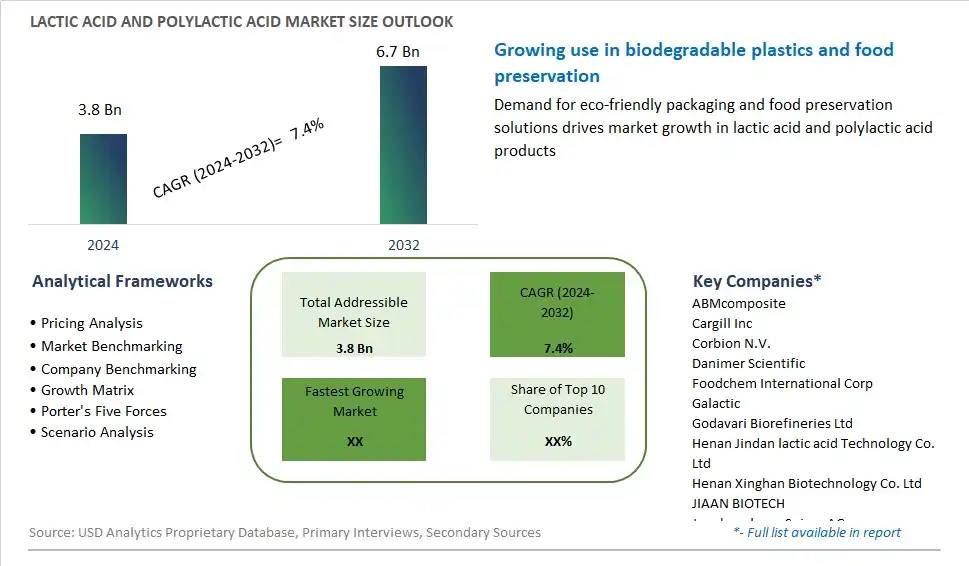
Global Lactic Acid and Polylactic Acid Market Size is valued at $3.8 Billion in 2024 and is forecast to register a growth rate (CAGR) of 7.4% to reach $6.7 Billion by 2032.
The global Lactic Acid and Polylactic Acid Market Comprehensive Study analyzes and forecasts the market size across 6 regions and 24 countries for diverse segments -By Raw Material (Corn, Cassava, Sugarcane, Yeast Extract, Others), By Form (Dry, Liquid), By Application (Lactic Acid, Polylactic Acid)
An Introduction to Lactic Acid and Polylactic Acid Market
Lactic acid and polylactic acid (PLA) are organic compounds derived from fermentation of carbohydrates such as corn starch or sugarcane, used in various food and non-food applications as biodegradable polymers and food additives in 2024. Lactic acid is a naturally occurring organic acid with antimicrobial properties, commonly used as a preservative, pH regulator, and flavoring agent in food and beverage products. PLA is a bioplastic made from lactic acid polymerization, offering a renewable, biodegradable alternative to conventional plastics for packaging materials, food containers, and disposable utensils. With advancements in fermentation technology, polymer chemistry, and bioplastic processing, manufacturers can produce lactic acid and PLA with improved performance, functionality, and sustainability, meeting the growing demand for eco-friendly materials and packaging solutions. As consumer awareness of plastic pollution and environmental sustainability grows, the market for lactic acid and PLA is expected to expand, driven by innovations in production methods, product applications, and end-of-life solutions that reduce environmental impact and promote circularity in the food and packaging industries.
Lactic Acid and Polylactic Acid Competitive Landscape
The market report analyses the leading companies in the industry including ABMcomposite, Cargill Inc, Corbion N.V., Danimer Scientific, Foodchem International Corp, Galactic, Godavari Biorefineries Ltd, Henan Jindan lactic acid Technology Co. Ltd, Henan Xinghan Biotechnology Co. Ltd, JIAAN BIOTECH, Jungbunzlauer Suisse AG, Musashino Chemical Laboratory, ProAgro GmbH, QINGDAO ABEL TECHNOLOGY CO. Ltd, Spectrum Chemical, Sulzer Ltd, TORAY INDUSTRIES Inc, UNITIKA LTD, Vaishnavi Bio Tech International Ltd, Vigon International, and Others.
Lactic Acid and Polylactic Acid Market Dynamics
Lactic Acid and Polylactic Acid Market Trend: Growing Demand for Sustainable and Biodegradable Materials
The market trend for lactic acid and polylactic acid (PLA) is characterized by the increasing demand for sustainable and biodegradable materials across various industries, including packaging, textiles, automotive, and biomedical. With growing environmental concerns and regulatory pressures to reduce reliance on fossil fuels and mitigate plastic pollution, there's a notable shift towards bio-based alternatives such as PLA derived from renewable resources like corn starch or sugarcane. This trend is driven by consumer preferences for eco-friendly products, coupled with advancements in biotechnology and polymer science enabling the production of high-performance PLA materials with improved mechanical properties and processing capabilities. Additionally, the versatility of lactic acid as a precursor to various biodegradable polymers and chemicals further contributes to market growth, offering sustainable solutions to address the environmental challenges associated with conventional plastics.
Market Driver: Regulatory Mandates and Corporate Sustainability Initiatives
A key driver propelling the market for lactic acid and PLA is the implementation of regulatory mandates and corporate sustainability initiatives aimed at reducing carbon emissions, plastic waste, and environmental impact. Governments worldwide are enacting policies and regulations to promote the use of bio-based materials and incentivize the transition towards a circular economy. Furthermore, leading companies across industries are embracing sustainability as a core business strategy, incorporating eco-friendly materials such as PLA into their product portfolios to meet consumer demand for greener alternatives and enhance brand reputation. Additionally, advancements in PLA technology, including the development of compostable and recyclable PLA formulations, align with circular economy principles, driving market adoption and growth.
Market Opportunity: Expansion into Novel Applications and Value-added Products
An opportunity within the lactic acid and PLA market lies in the expansion into novel applications and the development of value-added products to address emerging market needs and create new revenue streams. While PLA is commonly used in packaging, food service ware, and disposable products, there's potential for diversification into sectors such as 3D printing, medical devices, agricultural films, and construction materials. Manufacturers can capitalize on this opportunity by innovating with PLA-based formulations tailored to specific industry requirements, such as high heat resistance, antimicrobial properties, or biocompatibility. Moreover, there's scope for collaboration across the value chain, from raw material suppliers to end-users, to co-create sustainable solutions and drive market penetration in niche applications. By leveraging these opportunities for innovation and collaboration, stakeholders in the lactic acid and PLA market can position themselves as leaders in the transition towards a more sustainable and circular economy.
Lactic Acid and Polylactic Acid Market Share Analysis: Corn held the dominant market share in 2024
Within the diverse landscape of raw materials in the lactic acid and polylactic acid market, corn is the largest segment, driven by its widespread availability, cost-effectiveness, and versatile applications. Corn-based raw materials serve as key feedstocks for the production of lactic acid and its derivatives, including polylactic acid (PLA), a biodegradable and renewable polymer with numerous industrial applications. The abundance of corn as a raw material offers manufacturers a reliable and sustainable source for lactic acid and PLA production, meeting the growing demand for eco-friendly alternatives to conventional plastics. Additionally, advancements in biotechnology have enhanced the efficiency of corn-based fermentation processes, further driving its dominance in the market. As industries increasingly prioritize sustainability and environmental responsibility, the demand for corn-derived lactic acid and PLA is expected to continue growing, solidifying its position as the leading segment in the lactic acid and polylactic acid market.
Lactic Acid and Polylactic Acid Market Share Analysis: Liquid market is poised to register the fastest growth rae over the forecast period to 2032
In the dynamic landscape of lactic acid and polylactic acid, the liquid form is the fastest-growing segment, fueled by its versatility, ease of handling, and diverse applications across various industries. Liquid lactic acid and polylactic acid offer manufacturers and end-users greater flexibility in formulation and processing, allowing for easier integration into a wide range of products, including food and beverages, cosmetics, pharmaceuticals, and bioplastics. The liquid form facilitates precise dosing and homogeneous distribution, ensuring consistent product quality and performance. Additionally, advancements in production technologies and the availability of high-purity liquid lactic acid and PLA variants further contribute to the segment's rapid growth. As industries continue to seek sustainable and biodegradable alternatives to conventional materials, the demand for liquid lactic acid and PLA is expected to surge, driving significant expansion in the market.
Lactic Acid and Polylactic Acid Market Share Analysis: Polylactic Acid (PLA) held the dominant market share in 2024
Within the diverse array of applications in the lactic acid and polylactic acid market, polylactic acid (PLA) is the largest segment, driven by its extensive usage across various industries and its environmentally friendly properties. PLA, a biodegradable and renewable polymer derived from lactic acid, finds widespread applications in packaging, fiber & fabrics, agriculture, electronics, automobiles, and more. Its versatility, combined with growing consumer awareness and regulatory support for sustainable materials, has propelled the demand for PLA-based products globally. Further, advancements in PLA production technology have improved its performance characteristics, making it a viable alternative to traditional petroleum-based plastics in a wide range of applications. As industries increasingly prioritize eco-friendly materials and circular economy initiatives, the dominance of PLA in the lactic acid and polylactic acid market is expected to persist, driving its continued growth and market expansion.
Lactic Acid and Polylactic Acid Market Segmentation
By Raw Material
Corn
Cassava
Sugarcane
Yeast Extract
Others
By Form
Dry
Liquid
By Application
Lactic Acid
-Bio-degradable Polymers
-Food & Beverages
-Personal Care Products
-Pharmaceutical Products
-Others
Polylactic Acid
-Packaging
-Fiber & Fabrics
-Agriculture
-Electronic & Electricals
-Automobiles
-Others
Countries Analyzed
North America (US, Canada, Mexico)
Europe (Germany, UK, France, Spain, Italy, Russia, Rest of Europe)
Asia Pacific (China, India, Japan, South Korea, Australia, South East Asia, Rest of Asia)
South America (Brazil, Argentina, Rest of South America)
Middle East and Africa (Saudi Arabia, UAE, Rest of Middle East, South Africa, Egypt, Rest of Africa)
Lactic Acid and Polylactic Acid Companies Profiled in the Study
ABMcomposite
Cargill Inc
Corbion N.V.
Danimer Scientific
Foodchem International Corp
Galactic
Godavari Biorefineries Ltd
Henan Jindan lactic acid Technology Co. Ltd
Henan Xinghan Biotechnology Co. Ltd
JIAAN BIOTECH
Jungbunzlauer Suisse AG
Musashino Chemical Laboratory
ProAgro GmbH
QINGDAO ABEL TECHNOLOGY CO. Ltd
Spectrum Chemical
Sulzer Ltd
TORAY INDUSTRIES Inc
UNITIKA LTD
Vaishnavi Bio Tech International Ltd
Vigon International
*- List Not Exhaustive
Chapter 1. TABLE OF CONTENTS
Chapter 2. Introduction to Lactic Acid and Polylactic Acid Market
2.1. Market Overview
2.2. Key Statistics and Report Highlights
2.3. Scope of the Comprehensive Study
2.3.1. Market Definition
2.3.2 Countries and Regions Covered
2.3.3 Research Objective
2.3.4 Units, Currency, and Conversions
2.3.5 Industry Value Chain
2.4. Key Market Segments
2.5. Key Companies
2.6. Study Period
Chapter 3. Strategic Analysis Review
3.1. Lactic Acid and Polylactic Acid Pricing Analysis and Forecast
3.2. Porter’s Five Forces
3.3. Market Ecosystem
3.4. SWOT Analysis
3.5. Regulatory Scenario
3.3. Effects of Inflation, Russia-Ukraine War, moderating economic growth, and other macroeconomic factors
Chapter 4. Competitive Landscape
4.1. Market Share Analysis
4.1.1. Global Lactic Acid and Polylactic Acid Market Share by Company, 2023
4.1.2. Product Offerings of Leading Lactic Acid and Polylactic Acid Companies
4.2. Market Entropy
4.2.1. New Product Launches in the Industry
4.2.2. Mergers, Acquisitions, Joint ventures, and Partnerships
4.3. Key Strategies and Best Practices
Chapter 5. Global Market Projections: Best, Reference, and Low Case Scenarios
5.1. Growth Analysis- Case Scenario Definitions
5.2. Low Growth Case Scenario Forecasts
5.3. Reference Growth Case Scenario Forecasts
5.4. High Growth Case Scenario Forecasts
Chapter 6. Market Dynamics
6.1. Lactic Acid and Polylactic Acid Market Drivers
6.2. Lactic Acid and Polylactic Acid Market Challenges
6.6. Lactic Acid and Polylactic Acid Market Opportunities
6.4. Lactic Acid and Polylactic Acid Market Trends
Chapter 7. Global Lactic Acid and Polylactic Acid Market Outlook Trends
7.1. Global Lactic Acid and Polylactic Acid Revenue (USD Million) and CAGR (%) by Type (2021-2032)
7.2. Global Lactic Acid and Polylactic Acid Revenue (USD Million) and CAGR (%) by Application (2021-2032)
7.3. Global Lactic Acid and Polylactic Acid Revenue (USD Million) and CAGR (%) by Product (2021-2032)
By Raw Material
Corn
Cassava
Sugarcane
Yeast Extract
Others
By Form
Dry
Liquid
By Application
Lactic Acid
-Bio-degradable Polymers
-Food & Beverages
-Personal Care Products
-Pharmaceutical Products
-Others
Polylactic Acid
-Packaging
-Fiber & Fabrics
-Agriculture
-Electronic & Electricals
-Automobiles
-Others
Chapter 8. Global Lactic Acid and Polylactic Acid Regional Analysis and Outlook
8.1. Global Lactic Acid and Polylactic Acid Revenue (USD Million) By Regions (2021- 2032)
8.2. North America Lactic Acid and Polylactic Acid Revenue (USD Million) by Country (2021-2032)
8.2.1. United States Lactic Acid and Polylactic Acid Regional Analysis and Outlook
8.2.2. Canada Lactic Acid and Polylactic Acid Regional Analysis and Outlook
8.2.3. Mexico Lactic Acid and Polylactic Acid Regional Analysis and Outlook
8.3. Europe Lactic Acid and Polylactic Acid Revenue (USD Million), by Country (2021-2032)
8.3.1. Germany Lactic Acid and Polylactic Acid Regional Analysis and Outlook
8.3.2. France Lactic Acid and Polylactic Acid Regional Analysis and Outlook
8.3.3. United Kingdom Lactic Acid and Polylactic Acid Regional Analysis and Outlook
8.3.4. Spain Lactic Acid and Polylactic Acid Regional Analysis and Outlook
8.3.5. Italy Lactic Acid and Polylactic Acid Regional Analysis and Outlook
8.3.6. Russia Lactic Acid and Polylactic Acid Regional Analysis and Outlook
8.3.7. Rest of Europe Lactic Acid and Polylactic Acid Regional Analysis and Outlook
8.4. Asia Pacific Lactic Acid and Polylactic Acid Revenue (USD Million) by Country (2021-2032)
8.4.1. China Lactic Acid and Polylactic Acid Regional Analysis and Outlook
8.4.2. Japan Lactic Acid and Polylactic Acid Regional Analysis and Outlook
8.4.3. India Lactic Acid and Polylactic Acid Regional Analysis and Outlook
8.4.4. South Korea Lactic Acid and Polylactic Acid Regional Analysis and Outlook
8.4.5. Australia Lactic Acid and Polylactic Acid Regional Analysis and Outlook
8.4.6. South East Asia Lactic Acid and Polylactic Acid Regional Analysis and Outlook
8.4.7. Rest of Asia Pacific Lactic Acid and Polylactic Acid Regional Analysis and Outlook
8.5. South America Lactic Acid and Polylactic Acid Revenue (USD Million), by Country (2021-2032)
8.5.1. Brazil Lactic Acid and Polylactic Acid Regional Analysis and Outlook
8.5.2. Argentina Lactic Acid and Polylactic Acid Regional Analysis and Outlook
8.5.3. Rest of South America Lactic Acid and Polylactic Acid Regional Analysis and Outlook
8.6. Middle East and Africa Lactic Acid and Polylactic Acid Revenue (USD Million) by Country (2021-2032)
8.6.1. Middle East Lactic Acid and Polylactic Acid Regional Analysis and Outlook
8.6.2. Africa Lactic Acid and Polylactic Acid Regional Analysis and Outlook
Chapter 9. North America Lactic Acid and Polylactic Acid Analysis and Outlook
9.1. North America Lactic Acid and Polylactic Acid Revenue (USD Million) by Segments (2021-2032)
9.1.1. North America Lactic Acid and Polylactic Acid Revenue (USD Million) by Type (2021-2032)
9.1.2. North America Lactic Acid and Polylactic Acid Revenue (USD Million) by Application (2021-2032)
9.1.3. North America Lactic Acid and Polylactic Acid Revenue (USD Million) by Product (2021-2032)
By Raw Material
Corn
Cassava
Sugarcane
Yeast Extract
Others
By Form
Dry
Liquid
By Application
Lactic Acid
-Bio-degradable Polymers
-Food & Beverages
-Personal Care Products
-Pharmaceutical Products
-Others
Polylactic Acid
-Packaging
-Fiber & Fabrics
-Agriculture
-Electronic & Electricals
-Automobiles
-Others
Chapter 10. Europe Lactic Acid and Polylactic Acid Analysis and Outlook
10.1. Europe Lactic Acid and Polylactic Acid Revenue (USD Million), by Segments (USD Million) (2021-2032)
10.1.1. Europe Lactic Acid and Polylactic Acid Revenue (USD Million) by Type (2021-2032)
10.1.2. Europe Lactic Acid and Polylactic Acid Revenue (USD Million) by Application (2021-2032)
10.1.3. Europe Lactic Acid and Polylactic Acid Revenue (USD Million) by Product (2021-2032)
By Raw Material
Corn
Cassava
Sugarcane
Yeast Extract
Others
By Form
Dry
Liquid
By Application
Lactic Acid
-Bio-degradable Polymers
-Food & Beverages
-Personal Care Products
-Pharmaceutical Products
-Others
Polylactic Acid
-Packaging
-Fiber & Fabrics
-Agriculture
-Electronic & Electricals
-Automobiles
-Others
Chapter 11. Asia Pacific Lactic Acid and Polylactic Acid Analysis and Outlook
11.1. Asia Pacific Lactic Acid and Polylactic Acid Revenue (USD Million), and Revenue (USD Million) by Segments (2021-2032)
11.1.1. Asia Pacific Lactic Acid and Polylactic Acid Revenue (USD Million) by Type (2021-2032)
11.1.2. Asia Pacific Lactic Acid and Polylactic Acid Revenue (USD Million) by Application (2021-2032)
11.1.3. Asia Pacific Lactic Acid and Polylactic Acid Revenue (USD Million) by Product (2021-2032)
By Raw Material
Corn
Cassava
Sugarcane
Yeast Extract
Others
By Form
Dry
Liquid
By Application
Lactic Acid
-Bio-degradable Polymers
-Food & Beverages
-Personal Care Products
-Pharmaceutical Products
-Others
Polylactic Acid
-Packaging
-Fiber & Fabrics
-Agriculture
-Electronic & Electricals
-Automobiles
-Others
Chapter 12. South America Lactic Acid and Polylactic Acid Analysis and Outlook
12.1. South America Lactic Acid and Polylactic Acid Revenue (USD Million), by Segments (2021-2032)
12.1.1. South America Lactic Acid and Polylactic Acid Revenue (USD Million) by Type (2021-2032)
12.1.2. South America Lactic Acid and Polylactic Acid Revenue (USD Million) by Application (2021-2032)
12.1.3. South America Lactic Acid and Polylactic Acid Revenue (USD Million) by Product (2021-2032)
By Raw Material
Corn
Cassava
Sugarcane
Yeast Extract
Others
By Form
Dry
Liquid
By Application
Lactic Acid
-Bio-degradable Polymers
-Food & Beverages
-Personal Care Products
-Pharmaceutical Products
-Others
Polylactic Acid
-Packaging
-Fiber & Fabrics
-Agriculture
-Electronic & Electricals
-Automobiles
-Others
Chapter 13. Middle East and Africa Lactic Acid and Polylactic Acid Analysis and Outlook
13.1. Middle East and Africa Lactic Acid and Polylactic Acid Revenue (USD Million), by Segments (2021-2032)
13.1.1. Middle East and Africa Lactic Acid and Polylactic Acid Revenue (USD Million) by Type (2021-2032)
13.1.2. Middle East and Africa Lactic Acid and Polylactic Acid Revenue (USD Million) by Application (2021-2032)
13.1.3. Middle East and Africa Lactic Acid and Polylactic Acid Revenue (USD Million) by Product (2021-2032)
By Raw Material
Corn
Cassava
Sugarcane
Yeast Extract
Others
By Form
Dry
Liquid
By Application
Lactic Acid
-Bio-degradable Polymers
-Food & Beverages
-Personal Care Products
-Pharmaceutical Products
-Others
Polylactic Acid
-Packaging
-Fiber & Fabrics
-Agriculture
-Electronic & Electricals
-Automobiles
-Others
Chapter 14. Lactic Acid and Polylactic Acid Company Profiles
14.1 Business Overview
14.2 Product Profiles
14.3 SWOT Profiles
14.5 Recent Developments
14.6 Financial Profile
List of Companies
ABMcomposite
Cargill Inc
Corbion N.V.
Danimer Scientific
Foodchem International Corp
Galactic
Godavari Biorefineries Ltd
Henan Jindan lactic acid Technology Co. Ltd
Henan Xinghan Biotechnology Co. Ltd
JIAAN BIOTECH
Jungbunzlauer Suisse AG
Musashino Chemical Laboratory
ProAgro GmbH
QINGDAO ABEL TECHNOLOGY CO. Ltd
Spectrum Chemical
Sulzer Ltd
TORAY INDUSTRIES Inc
UNITIKA LTD
Vaishnavi Bio Tech International Ltd
Vigon International
15. Methodology and Data Sources
15.1 Customization Offerings
15.2 Subscription Services
15.3 Related Reports
15.4 Publisher Expertise
LIST OF TABLES
Table 1 Market Segmentation Analysis
Table 2 Global Lactic Acid and Polylactic Acid Market Share of Leading Companies, 2023
Table 3 Product Offerings of Leading Companies
Table 4 Low Growth Scenario Forecasts
Table 5 Reference Case Growth Scenario
Table 6 High Growth Case Scenario
Table 7 Global Lactic Acid and Polylactic Acid Revenue (USD Million) And CAGR (%) By Type (2021-2032)
Table 8 Global Lactic Acid and Polylactic Acid Revenue (USD Million) And CAGR (%) By Application (2021-2032)
Table 9 Global Lactic Acid and Polylactic Acid Revenue (USD Million) And CAGR (%) By Product (2021-2032)
Table 10 Global Lactic Acid and Polylactic Acid Market Revenue (USD Million) By Regions (2021-2032)
Table 11 Global Lactic Acid and Polylactic Acid Market Share (%) By Regions (2021-2032)
Table 12 North America Lactic Acid and Polylactic Acid Revenue (USD Million) By Country (2021-2032)
Table 13 Europe Lactic Acid and Polylactic Acid Revenue (USD Million) By Country (2021-2032)
Table 14 Asia Pacific Lactic Acid and Polylactic Acid Revenue (USD Million) By Country (2021-2032)
Table 15 South America Lactic Acid and Polylactic Acid Revenue (USD Million) By Country (2021-2032)
Table 16 Middle East and Africa Lactic Acid and Polylactic Acid Revenue (USD Million) By Region (2021-2032)
Table 17 North America Lactic Acid and Polylactic Acid Revenue (USD Million) By Type (2021-2032)
Table 18 North America Lactic Acid and Polylactic Acid Revenue (USD Million) By Application (2021-2032)
Table 19 North America Lactic Acid and Polylactic Acid Revenue (USD Million) By Product (2021-2032)
Table 20 Europe Lactic Acid and Polylactic Acid Revenue (USD Million) By Type (2021-2032)
Table 21 Europe Lactic Acid and Polylactic Acid Revenue (USD Million) By Application (2021-2032)
Table 22 Europe Lactic Acid and Polylactic Acid Revenue (USD Million) By Product (2021-2032)
Table 23 Asia Pacific Lactic Acid and Polylactic Acid Revenue (USD Million) By Type (2021-2032)
Table 24 Asia Pacific Lactic Acid and Polylactic Acid Revenue (USD Million) By Application (2021-2032)
Table 25 Asia Pacific Lactic Acid and Polylactic Acid Revenue (USD Million) By Product (2021-2032)
Table 26 South America Lactic Acid and Polylactic Acid Revenue (USD Million) By Type (2021-2032)
Table 27 South America Lactic Acid and Polylactic Acid Revenue (USD Million) By Application (2021-2032)
Table 28 South America Lactic Acid and Polylactic Acid Revenue (USD Million) By Product (2021-2032)
Table 29 Middle East and Africa Lactic Acid and Polylactic Acid Revenue (USD Million) By Type (2021-2032)
Table 30 Middle East and Africa Lactic Acid and Polylactic Acid Revenue (USD Million) By Application (2021-2032)
Table 31 Middle East and Africa Lactic Acid and Polylactic Acid Revenue (USD Million) By Product (2021-2032)
LIST OF FIGURES
Figure 1. Market Scope
Figure 2. Pricing Forecasts Per Unit, 2023- 2032
Figure 3. Porter’s Five Forces
Figure 4. Global Lactic Acid and Polylactic Acid Market Revenue (USD Million) By Regions (2021-2032)
Figure 5. Global Lactic Acid and Polylactic Acid Market Share (%) By Regions (2023)
Figure 6. North America Lactic Acid and Polylactic Acid Revenue (USD Million) By Country (2021-2032)
Figure 7. United States Lactic Acid and Polylactic Acid Revenue (USD Million) By Country (2021-2032)
Figure 8. Canada Lactic Acid and Polylactic Acid Revenue (USD Million) By Country (2021-2032)
Figure 9. Mexico Lactic Acid and Polylactic Acid Revenue (USD Million) By Country (2021-2032)
Figure 10. Europe Lactic Acid and Polylactic Acid Revenue (USD Million) By Country (2021-2032)
Figure 11. Germany Lactic Acid and Polylactic Acid Revenue (USD Million) By Country (2021-2032)
Figure 12. France Lactic Acid and Polylactic Acid Revenue (USD Million) By Country (2021-2032)
Figure 13. United Kingdom Lactic Acid and Polylactic Acid Revenue (USD Million) By Country (2021-2032)
Figure 14. Spain Lactic Acid and Polylactic Acid Revenue (USD Million) By Country (2021-2032)
Figure 15. Italy Lactic Acid and Polylactic Acid Revenue (USD Million) By Country (2021-2032)
Figure 16. Russia Lactic Acid and Polylactic Acid Revenue (USD Million) By Country (2021-2032)
Figure 17. Rest of Europe Lactic Acid and Polylactic Acid Revenue (USD Million) By Country (2021-2032)
Figure 11. Asia Pacific Lactic Acid and Polylactic Acid Revenue (USD Million) By Country (2021-2032)
Figure 12. China Lactic Acid and Polylactic Acid Revenue (USD Million) By Country (2021-2032)
Figure 13. Japan Lactic Acid and Polylactic Acid Revenue (USD Million) By Country (2021-2032)
Figure 14. India Lactic Acid and Polylactic Acid Revenue (USD Million) By Country (2021-2032)
Figure 15. South Korea Lactic Acid and Polylactic Acid Revenue (USD Million) By Country (2021-2032)
Figure 16. Australia Lactic Acid and Polylactic Acid Revenue (USD Million) By Country (2021-2032)
Figure 17. South East Asia Lactic Acid and Polylactic Acid Revenue (USD Million) By Country (2021-2032)
Figure 18. South America Lactic Acid and Polylactic Acid Revenue (USD Million) By Country (2021-2032)
Figure 19. Brazil Lactic Acid and Polylactic Acid Revenue (USD Million) By Country (2021-2032)
Figure 20. Argentina Lactic Acid and Polylactic Acid Revenue (USD Million) By Country (2021-2032)
Figure 21. Rest of Asia Pacific Lactic Acid and Polylactic Acid Revenue (USD Million) By Country (2021-2032)
Figure 22. Middle East and Africa Lactic Acid and Polylactic Acid Revenue (USD Million) By Region (2021-2032)
Figure 23. Saudi Arabia Lactic Acid and Polylactic Acid Revenue (USD Million) By Region (2021-2032)
Figure 24. The UAE Lactic Acid and Polylactic Acid Revenue (USD Million) By Region (2021-2032)
Figure 25. Rest of Middle East Lactic Acid and Polylactic Acid Revenue (USD Million) By Region (2021-2032)
Figure 26. South Africa Lactic Acid and Polylactic Acid Revenue (USD Million) By Region (2021-2032)
Figure 27. Africa Lactic Acid and Polylactic Acid Revenue (USD Million) By Region (2021-2032)
Figure 28. North America Lactic Acid and Polylactic Acid Revenue (USD Million) By Type (2021-2032)
Figure 29. North America Lactic Acid and Polylactic Acid Revenue (USD Million) By Application (2021-2032)
Figure 30. North America Lactic Acid and Polylactic Acid Revenue (USD Million) By Product (2021-2032)
Figure 31. Europe Lactic Acid and Polylactic Acid Revenue (USD Million) By Type (2021-2032)
Figure 32. Europe Lactic Acid and Polylactic Acid Revenue (USD Million) By Application (2021-2032)
Figure 33. Europe Lactic Acid and Polylactic Acid Revenue (USD Million) By Product (2021-2032)
Figure 34. Asia Pacific Lactic Acid and Polylactic Acid Revenue (USD Million) By Type (2021-2032)
Figure 35. Asia Pacific Lactic Acid and Polylactic Acid Revenue (USD Million) By Application (2021-2032)
Figure 36. Asia Pacific Lactic Acid and Polylactic Acid Revenue (USD Million) By Product (2021-2032)
Figure 37. South America Lactic Acid and Polylactic Acid Revenue (USD Million) By Type (2021-2032)
Figure 38. South America Lactic Acid and Polylactic Acid Revenue (USD Million) By Application (2021-2032)
Figure 39. South America Lactic Acid and Polylactic Acid Revenue (USD Million) By Product (2021-2032)
Figure 40. Middle East and Africa Lactic Acid and Polylactic Acid Revenue (USD Million) By Type (2021-2032)
Figure 41. Middle East and Africa Lactic Acid and Polylactic Acid Revenue (USD Million) By Application (2021-2032)
Figure 42. Middle East and Africa Lactic Acid and Polylactic Acid Revenue (USD Million) By Product (2021-2032)
By Raw Material
Corn
Cassava
Sugarcane
Yeast Extract
Others
By Form
Dry
Liquid
By Application
Lactic Acid
-Bio-degradable Polymers
-Food & Beverages
-Personal Care Products
-Pharmaceutical Products
-Others
Polylactic Acid
-Packaging
-Fiber & Fabrics
-Agriculture
-Electronic & Electricals
-Automobiles
-Others
Countries Analyzed
North America (US, Canada, Mexico)
Europe (Germany, UK, France, Spain, Italy, Russia, Rest of Europe)
Asia Pacific (China, India, Japan, South Korea, Australia, South East Asia, Rest of Asia)
South America (Brazil, Argentina, Rest of South America)
Middle East and Africa (Saudi Arabia, UAE, Rest of Middle East, South Africa, Egypt, Rest of Africa)
