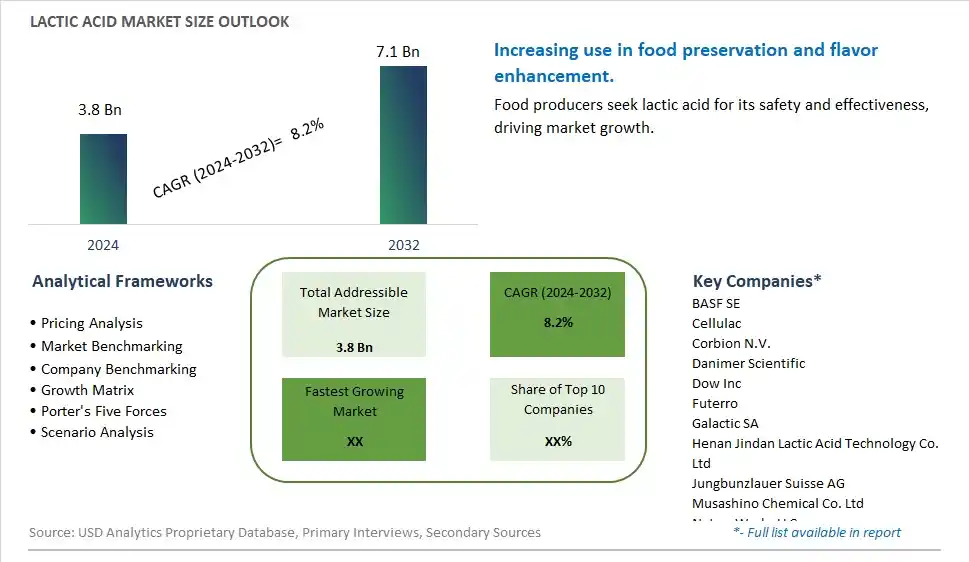
Global Lactic Acid Market Size is valued at $3.8 Billion in 2024 and is forecast to register a growth rate (CAGR) of 8.2% to reach $7.1 Billion by 2032.
The global Lactic Acid Market Comprehensive Study analyzes and forecasts the market size across 6 regions and 24 countries for diverse segments -By Material (Corn, Sugarcane, Cassava, Yeast Extract, Others), By Form (Dry, Liquid), By Application (Industrial, Food & Beverages, -Beverages, -Bakery & Confectionary Products, -Dairy Products, -Meat Products, -Others, Pharmaceuticals, Personal Care, Others)
An Introduction to Lactic Acid Market
The lactic acids market in 2024 is expanding rapidly, driven by the demand for natural preservatives and pH regulators used in food, pharmaceuticals, and cosmetics. Lactic acid, derived from fermentation processes, offers antimicrobial properties and enhances product stability. The market benefits from innovations in fermentation and purification technologies that improve the efficiency and sustainability of lactic acid production. The trend towards clean label and natural ingredients is influencing product development. Increasing consumer interest in natural and functional ingredients, supported by the popularity of minimally processed and shelf-stable foods, is further supporting market growth.
Lactic Acid Competitive Landscape
The market report analyses the leading companies in the industry including BASF SE, Cellulac, Corbion N.V., Danimer Scientific, Dow Inc, Futerro, Galactic SA, Henan Jindan Lactic Acid Technology Co. Ltd, Jungbunzlauer Suisse AG, Musashino Chemical Co. Ltd, NatureWorks LLC, TEIJIN Ltd, thyssenkrupp AG, Vaishnavi Bio Tech, and Others.
Lactic Acid Market Dynamics
Lactic Acids Market Trend: Increasing Use in Food and Beverage Preservation
The most prominent trend in the Lactic Acids Market is the increasing use in food and beverage preservation. Lactic acid is valued for its antimicrobial properties and ability to extend the shelf life of various products, making it a popular choice for natural preservation. This trend is driven by the growing demand for clean label preservatives that do not compromise food safety and quality.
Lactic Acids Market Driver: Health Consciousness and Clean Label Demand
A key driver in the Lactic Acids Market is health consciousness and the demand for clean label ingredients. As more individuals focus on consuming foods free from synthetic additives and preservatives, there is a rising demand for lactic acid as a natural preservative that meets these criteria. This demand supports market growth as food producers seek to cater to health-conscious consumers with clean label products.
Lactic Acids Market Opportunity: Innovation in Bioplastics and Personal Care Products
One significant opportunity in the Lactic Acids Market lies in innovation in bioplastics and personal care products. Companies can develop new lactic acid-based materials for eco-friendly packaging solutions and personal care formulations, offering sustainable and natural alternatives to traditional products. By highlighting the versatility and environmental benefits of lactic acid, manufacturers can attract a broader market and drive growth.
Lactic Acid Market Share Analysis- Largest Segment by Material
In the Lactic Acid Market, Corn is the largest material segment. This dominance is attributed to corn’s high availability and cost-effectiveness as a raw material for lactic acid production. Corn-based lactic acid production benefits from established agricultural practices and infrastructure, ensuring a stable supply chain. Additionally, the efficiency of converting corn starch into lactic acid supports its prominence in the market. As a result, corn remains the primary material for lactic acid production due to its economic advantages and widespread use.
Lactic Acid Market Share Analysis- Poised to Grow Fastest Over the Next Five Years by Form
In the Lactic Acid Market, Dry lactic acid is poised to grow the fastest over the next five years. The growth of this segment is driven by the increasing demand for convenient and longer shelf-life products in various applications. Dry lactic acid offers advantages such as easier handling, storage, and transport compared to its liquid counterpart. As industries seek more versatile and efficient forms of lactic acid, the demand for dry lactic acid is expected to rise, contributing to its rapid growth.
Lactic Acid Market Share Analysis- Largest Segment by Application
In the Lactic Acid Market, Food & Beverages is the largest application segment. This dominance is due to the extensive use of lactic acid as a preservative, flavor enhancer, and acidulant in various food products. Its ability to improve taste, extend shelf life, and maintain food safety makes it a crucial ingredient in the food and beverage industry. Additionally, the growing trend towards functional foods and clean-label products further drives the demand for lactic acid in this sector, solidifying its position as the largest application segment.
Lactic Acid Market Segmentation
By Material
Corn
Sugarcane
Cassava
Yeast Extract
Others
By Form
Dry
Liquid
By Application
Industrial
Food & Beverages
-Beverages
-Bakery & Confectionary Products
-Dairy Products
-Meat Products
-Others
Pharmaceuticals
Personal Care
Others
Countries Analyzed
North America (US, Canada, Mexico)
Europe (Germany, UK, France, Spain, Italy, Russia, Rest of Europe)
Asia Pacific (China, India, Japan, South Korea, Australia, South East Asia, Rest of Asia)
South America (Brazil, Argentina, Rest of South America)
Middle East and Africa (Saudi Arabia, UAE, Rest of Middle East, South Africa, Egypt, Rest of Africa)
Lactic Acid Companies Profiled in the Study
BASF SE
Cellulac
Corbion N.V.
Danimer Scientific
Dow Inc
Futerro
Galactic SA
Henan Jindan Lactic Acid Technology Co. Ltd
Jungbunzlauer Suisse AG
Musashino Chemical Co. Ltd
NatureWorks LLC
TEIJIN Ltd
thyssenkrupp AG
Vaishnavi Bio Tech
*- List Not Exhaustive
Chapter 1. TABLE OF CONTENTS
Chapter 2. Introduction to Lactic Acid Market
2.1. Market Overview
2.2. Key Statistics and Report Highlights
2.3. Scope of the Comprehensive Study
2.3.1. Market Definition
2.3.2 Countries and Regions Covered
2.3.3 Research Objective
2.3.4 Units, Currency, and Conversions
2.3.5 Industry Value Chain
2.4. Key Market Segments
2.5. Key Companies
2.6. Study Period
Chapter 3. Strategic Analysis Review
3.1. Lactic Acid Pricing Analysis and Forecast
3.2. Porter’s Five Forces
3.3. Market Ecosystem
3.4. SWOT Analysis
3.5. Regulatory Scenario
3.3. Effects of Inflation, Russia-Ukraine War, moderating economic growth, and other macroeconomic factors
Chapter 4. Competitive Landscape
4.1. Market Share Analysis
4.1.1. Global Lactic Acid Market Share by Company, 2023
4.1.2. Product Offerings of Leading Lactic Acid Companies
4.2. Market Entropy
4.2.1. New Product Launches in the Industry
4.2.2. Mergers, Acquisitions, Joint ventures, and Partnerships
4.3. Key Strategies and Best Practices
Chapter 5. Global Market Projections: Best, Reference, and Low Case Scenarios
5.1. Growth Analysis- Case Scenario Definitions
5.2. Low Growth Case Scenario Forecasts
5.3. Reference Growth Case Scenario Forecasts
5.4. High Growth Case Scenario Forecasts
Chapter 6. Market Dynamics
6.1. Lactic Acid Market Drivers
6.2. Lactic Acid Market Challenges
6.6. Lactic Acid Market Opportunities
6.4. Lactic Acid Market Trends
Chapter 7. Global Lactic Acid Market Outlook Trends
7.1. Global Lactic Acid Revenue (USD Million) and CAGR (%) by Type (2021-2032)
7.2. Global Lactic Acid Revenue (USD Million) and CAGR (%) by Application (2021-2032)
7.3. Global Lactic Acid Revenue (USD Million) and CAGR (%) by Product (2021-2032)
By Material
Corn
Sugarcane
Cassava
Yeast Extract
Others
By Form
Dry
Liquid
By Application
Industrial
Food & Beverages
-Beverages
-Bakery & Confectionary Products
-Dairy Products
-Meat Products
-Others
Pharmaceuticals
Personal Care
Others
Chapter 8. Global Lactic Acid Regional Analysis and Outlook
8.1. Global Lactic Acid Revenue (USD Million) By Regions (2021- 2032)
8.2. North America Lactic Acid Revenue (USD Million) by Country (2021-2032)
8.2.1. United States Lactic Acid Regional Analysis and Outlook
8.2.2. Canada Lactic Acid Regional Analysis and Outlook
8.2.3. Mexico Lactic Acid Regional Analysis and Outlook
8.3. Europe Lactic Acid Revenue (USD Million), by Country (2021-2032)
8.3.1. Germany Lactic Acid Regional Analysis and Outlook
8.3.2. France Lactic Acid Regional Analysis and Outlook
8.3.3. United Kingdom Lactic Acid Regional Analysis and Outlook
8.3.4. Spain Lactic Acid Regional Analysis and Outlook
8.3.5. Italy Lactic Acid Regional Analysis and Outlook
8.3.6. Russia Lactic Acid Regional Analysis and Outlook
8.3.7. Rest of Europe Lactic Acid Regional Analysis and Outlook
8.4. Asia Pacific Lactic Acid Revenue (USD Million) by Country (2021-2032)
8.4.1. China Lactic Acid Regional Analysis and Outlook
8.4.2. Japan Lactic Acid Regional Analysis and Outlook
8.4.3. India Lactic Acid Regional Analysis and Outlook
8.4.4. South Korea Lactic Acid Regional Analysis and Outlook
8.4.5. Australia Lactic Acid Regional Analysis and Outlook
8.4.6. South East Asia Lactic Acid Regional Analysis and Outlook
8.4.7. Rest of Asia Pacific Lactic Acid Regional Analysis and Outlook
8.5. South America Lactic Acid Revenue (USD Million), by Country (2021-2032)
8.5.1. Brazil Lactic Acid Regional Analysis and Outlook
8.5.2. Argentina Lactic Acid Regional Analysis and Outlook
8.5.3. Rest of South America Lactic Acid Regional Analysis and Outlook
8.6. Middle East and Africa Lactic Acid Revenue (USD Million) by Country (2021-2032)
8.6.1. Middle East Lactic Acid Regional Analysis and Outlook
8.6.2. Africa Lactic Acid Regional Analysis and Outlook
Chapter 9. North America Lactic Acid Analysis and Outlook
9.1. North America Lactic Acid Revenue (USD Million) by Segments (2021-2032)
9.1.1. North America Lactic Acid Revenue (USD Million) by Type (2021-2032)
9.1.2. North America Lactic Acid Revenue (USD Million) by Application (2021-2032)
9.1.3. North America Lactic Acid Revenue (USD Million) by Product (2021-2032)
By Material
Corn
Sugarcane
Cassava
Yeast Extract
Others
By Form
Dry
Liquid
By Application
Industrial
Food & Beverages
-Beverages
-Bakery & Confectionary Products
-Dairy Products
-Meat Products
-Others
Pharmaceuticals
Personal Care
Others
Chapter 10. Europe Lactic Acid Analysis and Outlook
10.1. Europe Lactic Acid Revenue (USD Million), by Segments (USD Million) (2021-2032)
10.1.1. Europe Lactic Acid Revenue (USD Million) by Type (2021-2032)
10.1.2. Europe Lactic Acid Revenue (USD Million) by Application (2021-2032)
10.1.3. Europe Lactic Acid Revenue (USD Million) by Product (2021-2032)
By Material
Corn
Sugarcane
Cassava
Yeast Extract
Others
By Form
Dry
Liquid
By Application
Industrial
Food & Beverages
-Beverages
-Bakery & Confectionary Products
-Dairy Products
-Meat Products
-Others
Pharmaceuticals
Personal Care
Others
Chapter 11. Asia Pacific Lactic Acid Analysis and Outlook
11.1. Asia Pacific Lactic Acid Revenue (USD Million), and Revenue (USD Million) by Segments (2021-2032)
11.1.1. Asia Pacific Lactic Acid Revenue (USD Million) by Type (2021-2032)
11.1.2. Asia Pacific Lactic Acid Revenue (USD Million) by Application (2021-2032)
11.1.3. Asia Pacific Lactic Acid Revenue (USD Million) by Product (2021-2032)
By Material
Corn
Sugarcane
Cassava
Yeast Extract
Others
By Form
Dry
Liquid
By Application
Industrial
Food & Beverages
-Beverages
-Bakery & Confectionary Products
-Dairy Products
-Meat Products
-Others
Pharmaceuticals
Personal Care
Others
Chapter 12. South America Lactic Acid Analysis and Outlook
12.1. South America Lactic Acid Revenue (USD Million), by Segments (2021-2032)
12.1.1. South America Lactic Acid Revenue (USD Million) by Type (2021-2032)
12.1.2. South America Lactic Acid Revenue (USD Million) by Application (2021-2032)
12.1.3. South America Lactic Acid Revenue (USD Million) by Product (2021-2032)
By Material
Corn
Sugarcane
Cassava
Yeast Extract
Others
By Form
Dry
Liquid
By Application
Industrial
Food & Beverages
-Beverages
-Bakery & Confectionary Products
-Dairy Products
-Meat Products
-Others
Pharmaceuticals
Personal Care
Others
Chapter 13. Middle East and Africa Lactic Acid Analysis and Outlook
13.1. Middle East and Africa Lactic Acid Revenue (USD Million), by Segments (2021-2032)
13.1.1. Middle East and Africa Lactic Acid Revenue (USD Million) by Type (2021-2032)
13.1.2. Middle East and Africa Lactic Acid Revenue (USD Million) by Application (2021-2032)
13.1.3. Middle East and Africa Lactic Acid Revenue (USD Million) by Product (2021-2032)
By Material
Corn
Sugarcane
Cassava
Yeast Extract
Others
By Form
Dry
Liquid
By Application
Industrial
Food & Beverages
-Beverages
-Bakery & Confectionary Products
-Dairy Products
-Meat Products
-Others
Pharmaceuticals
Personal Care
Others
Chapter 14. Lactic Acid Company Profiles
14.1 Business Overview
14.2 Product Profiles
14.3 SWOT Profiles
14.5 Recent Developments
14.6 Financial Profile
List of Companies
BASF SE
Cellulac
Corbion N.V.
Danimer Scientific
Dow Inc
Futerro
Galactic SA
Henan Jindan Lactic Acid Technology Co. Ltd
Jungbunzlauer Suisse AG
Musashino Chemical Co. Ltd
NatureWorks LLC
TEIJIN Ltd
thyssenkrupp AG
Vaishnavi Bio Tech
15. Methodology and Data Sources
15.1 Customization Offerings
15.2 Subscription Services
15.3 Related Reports
15.4 Publisher Expertise
LIST OF TABLES
Table 1 Market Segmentation Analysis
Table 2 Global Lactic Acid Market Share of Leading Companies, 2023
Table 3 Product Offerings of Leading Companies
Table 4 Low Growth Scenario Forecasts
Table 5 Reference Case Growth Scenario
Table 6 High Growth Case Scenario
Table 7 Global Lactic Acid Revenue (USD Million) And CAGR (%) By Type (2021-2032)
Table 8 Global Lactic Acid Revenue (USD Million) And CAGR (%) By Application (2021-2032)
Table 9 Global Lactic Acid Revenue (USD Million) And CAGR (%) By Product (2021-2032)
Table 10 Global Lactic Acid Market Revenue (USD Million) By Regions (2021-2032)
Table 11 Global Lactic Acid Market Share (%) By Regions (2021-2032)
Table 12 North America Lactic Acid Revenue (USD Million) By Country (2021-2032)
Table 13 Europe Lactic Acid Revenue (USD Million) By Country (2021-2032)
Table 14 Asia Pacific Lactic Acid Revenue (USD Million) By Country (2021-2032)
Table 15 South America Lactic Acid Revenue (USD Million) By Country (2021-2032)
Table 16 Middle East and Africa Lactic Acid Revenue (USD Million) By Region (2021-2032)
Table 17 North America Lactic Acid Revenue (USD Million) By Type (2021-2032)
Table 18 North America Lactic Acid Revenue (USD Million) By Application (2021-2032)
Table 19 North America Lactic Acid Revenue (USD Million) By Product (2021-2032)
Table 20 Europe Lactic Acid Revenue (USD Million) By Type (2021-2032)
Table 21 Europe Lactic Acid Revenue (USD Million) By Application (2021-2032)
Table 22 Europe Lactic Acid Revenue (USD Million) By Product (2021-2032)
Table 23 Asia Pacific Lactic Acid Revenue (USD Million) By Type (2021-2032)
Table 24 Asia Pacific Lactic Acid Revenue (USD Million) By Application (2021-2032)
Table 25 Asia Pacific Lactic Acid Revenue (USD Million) By Product (2021-2032)
Table 26 South America Lactic Acid Revenue (USD Million) By Type (2021-2032)
Table 27 South America Lactic Acid Revenue (USD Million) By Application (2021-2032)
Table 28 South America Lactic Acid Revenue (USD Million) By Product (2021-2032)
Table 29 Middle East and Africa Lactic Acid Revenue (USD Million) By Type (2021-2032)
Table 30 Middle East and Africa Lactic Acid Revenue (USD Million) By Application (2021-2032)
Table 31 Middle East and Africa Lactic Acid Revenue (USD Million) By Product (2021-2032)
LIST OF FIGURES
Figure 1. Market Scope
Figure 2. Pricing Forecasts Per Unit, 2023- 2032
Figure 3. Porter’s Five Forces
Figure 4. Global Lactic Acid Market Revenue (USD Million) By Regions (2021-2032)
Figure 5. Global Lactic Acid Market Share (%) By Regions (2023)
Figure 6. North America Lactic Acid Revenue (USD Million) By Country (2021-2032)
Figure 7. United States Lactic Acid Revenue (USD Million) By Country (2021-2032)
Figure 8. Canada Lactic Acid Revenue (USD Million) By Country (2021-2032)
Figure 9. Mexico Lactic Acid Revenue (USD Million) By Country (2021-2032)
Figure 10. Europe Lactic Acid Revenue (USD Million) By Country (2021-2032)
Figure 11. Germany Lactic Acid Revenue (USD Million) By Country (2021-2032)
Figure 12. France Lactic Acid Revenue (USD Million) By Country (2021-2032)
Figure 13. United Kingdom Lactic Acid Revenue (USD Million) By Country (2021-2032)
Figure 14. Spain Lactic Acid Revenue (USD Million) By Country (2021-2032)
Figure 15. Italy Lactic Acid Revenue (USD Million) By Country (2021-2032)
Figure 16. Russia Lactic Acid Revenue (USD Million) By Country (2021-2032)
Figure 17. Rest of Europe Lactic Acid Revenue (USD Million) By Country (2021-2032)
Figure 11. Asia Pacific Lactic Acid Revenue (USD Million) By Country (2021-2032)
Figure 12. China Lactic Acid Revenue (USD Million) By Country (2021-2032)
Figure 13. Japan Lactic Acid Revenue (USD Million) By Country (2021-2032)
Figure 14. India Lactic Acid Revenue (USD Million) By Country (2021-2032)
Figure 15. South Korea Lactic Acid Revenue (USD Million) By Country (2021-2032)
Figure 16. Australia Lactic Acid Revenue (USD Million) By Country (2021-2032)
Figure 17. South East Asia Lactic Acid Revenue (USD Million) By Country (2021-2032)
Figure 18. South America Lactic Acid Revenue (USD Million) By Country (2021-2032)
Figure 19. Brazil Lactic Acid Revenue (USD Million) By Country (2021-2032)
Figure 20. Argentina Lactic Acid Revenue (USD Million) By Country (2021-2032)
Figure 21. Rest of Asia Pacific Lactic Acid Revenue (USD Million) By Country (2021-2032)
Figure 22. Middle East and Africa Lactic Acid Revenue (USD Million) By Region (2021-2032)
Figure 23. Saudi Arabia Lactic Acid Revenue (USD Million) By Region (2021-2032)
Figure 24. The UAE Lactic Acid Revenue (USD Million) By Region (2021-2032)
Figure 25. Rest of Middle East Lactic Acid Revenue (USD Million) By Region (2021-2032)
Figure 26. South Africa Lactic Acid Revenue (USD Million) By Region (2021-2032)
Figure 27. Africa Lactic Acid Revenue (USD Million) By Region (2021-2032)
Figure 28. North America Lactic Acid Revenue (USD Million) By Type (2021-2032)
Figure 29. North America Lactic Acid Revenue (USD Million) By Application (2021-2032)
Figure 30. North America Lactic Acid Revenue (USD Million) By Product (2021-2032)
Figure 31. Europe Lactic Acid Revenue (USD Million) By Type (2021-2032)
Figure 32. Europe Lactic Acid Revenue (USD Million) By Application (2021-2032)
Figure 33. Europe Lactic Acid Revenue (USD Million) By Product (2021-2032)
Figure 34. Asia Pacific Lactic Acid Revenue (USD Million) By Type (2021-2032)
Figure 35. Asia Pacific Lactic Acid Revenue (USD Million) By Application (2021-2032)
Figure 36. Asia Pacific Lactic Acid Revenue (USD Million) By Product (2021-2032)
Figure 37. South America Lactic Acid Revenue (USD Million) By Type (2021-2032)
Figure 38. South America Lactic Acid Revenue (USD Million) By Application (2021-2032)
Figure 39. South America Lactic Acid Revenue (USD Million) By Product (2021-2032)
Figure 40. Middle East and Africa Lactic Acid Revenue (USD Million) By Type (2021-2032)
Figure 41. Middle East and Africa Lactic Acid Revenue (USD Million) By Application (2021-2032)
Figure 42. Middle East and Africa Lactic Acid Revenue (USD Million) By Product (2021-2032)
By Material
Corn
Sugarcane
Cassava
Yeast Extract
Others
By Form
Dry
Liquid
By Application
Industrial
Food & Beverages
-Beverages
-Bakery & Confectionary Products
-Dairy Products
-Meat Products
-Others
Pharmaceuticals
Personal Care
Others
Countries Analyzed
North America (US, Canada, Mexico)
Europe (Germany, UK, France, Spain, Italy, Russia, Rest of Europe)
Asia Pacific (China, India, Japan, South Korea, Australia, South East Asia, Rest of Asia)
South America (Brazil, Argentina, Rest of South America)
Middle East and Africa (Saudi Arabia, UAE, Rest of Middle East, South Africa, Egypt, Rest of Africa)
