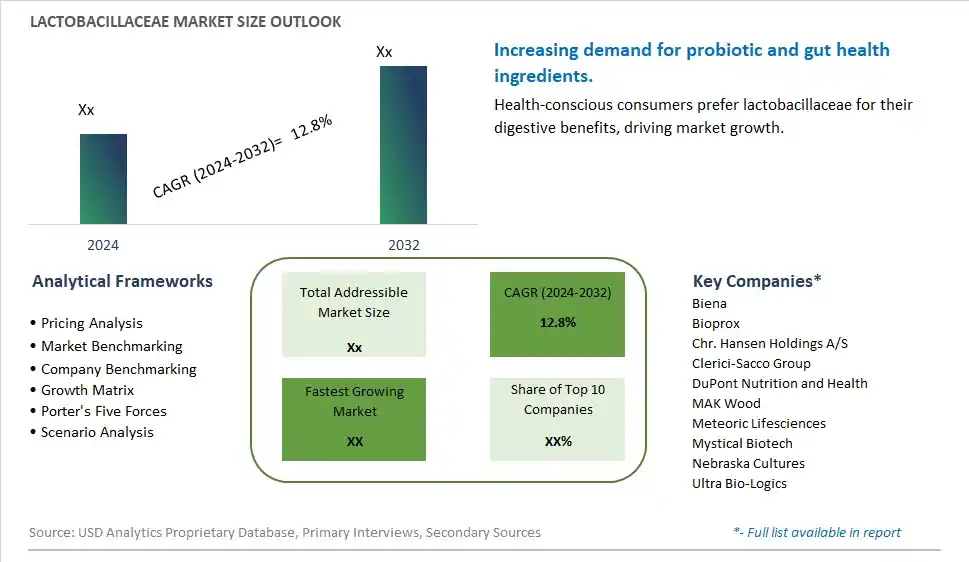
Global Lactobacillaceae Market Size is valued at $XX Million in 2024 and is forecast to register a growth rate (CAGR) of 12.8% to reach $XX Million by 2032.
The global Lactobacillaceae Market Comprehensive Study analyzes and forecasts the market size across 6 regions and 24 countries for diverse segments -By Type (Food Grade, Pharmaceutical Grade), By Application (Food Industry, Medical Industry, Others)
An Introduction to Lactobacillaceae Market
In 2024, the Lactobacillaceae market is thriving, driven by the rising awareness of the health benefits associated with probiotics. Lactobacillaceae, a family of beneficial bacteria, is widely used in dietary supplements, functional foods, and beverages to promote gut health and boost the immune system. The market benefits from advancements in probiotic research and formulation technologies that enhance the stability and efficacy of Lactobacillaceae strains. The trend towards natural and preventive health measures is supporting the growth of probiotic products. Additionally, increasing consumer interest in digestive health and wellness is propelling market demand.
Lactobacillaceae Competitive Landscape
The market report analyses the leading companies in the industry including Biena, Bioprox, Chr. Hansen Holdings A/S, Clerici-Sacco Group, DuPont Nutrition and Health, MAK Wood, Meteoric Lifesciences, Mystical Biotech, Nebraska Cultures, Ultra Bio-Logics, and Others.
Lactobacillaceae Market Dynamics
Lactobacillaceae Market Trend: Growing Interest in Probiotics for Gut Health
The most prominent trend in the Lactobacillaceae Market is the growing interest in probiotics for gut health. Lactobacillaceae, a family of beneficial bacteria, is widely used in probiotic supplements and fermented foods to promote digestive health and support a healthy microbiome. This trend is driven by the increasing awareness of the importance of gut health for overall well-being.
Lactobacillaceae Market Driver: Rising Incidence of Digestive Disorders
A key driver in the Lactobacillaceae Market is the rising incidence of digestive disorders. As more individuals experience issues such as irritable bowel syndrome (IBS), inflammatory bowel disease (IBD), and other gastrointestinal problems, there is a growing demand for probiotics that can help manage these conditions. Lactobacillaceae, known for its beneficial effects on gut health, is a key ingredient in many probiotic formulations.
Lactobacillaceae Market Opportunity: Expansion into Personalized Nutrition
One significant opportunity in the Lactobacillaceae Market lies in the expansion into personalized nutrition. Advances in microbiome research are enabling the development of personalized probiotic products tailored to individual health needs and genetic profiles. Companies that invest in research and development to create customized probiotic solutions can attract health-conscious consumers and drive market growth through innovation.
Lactobacillaceae Market Share Analysis: Food Grade segment generated the highest revenue share in the industry
The Food Grade segment stands out as the largest in the Lactobacillaceae market. This segment encompasses strains of Lactobacillaceae bacteria specifically selected and cultivated for use in food products, including dairy, fermented foods, probiotic supplements, and functional beverages. Lactobacillaceae strains are highly valued in the food industry for their ability to ferment sugars into lactic acid, enhancing food preservation, flavor development, and texture improvement. They play a crucial role in the production of yogurt, cheese, sauerkraut, kimchi, and various other fermented foods that benefit from their probiotic properties and health-promoting attributes. The increasing consumer awareness of gut health and the demand for natural, functional foods have propelled the growth of the Food Grade segment. Additionally, advancements in biotechnology and microbial strain selection have enabled the development of novel applications, further expanding the market for food-grade Lactobacillaceae strains. As regulatory frameworks continue to support the use of probiotics in food products, the Food Grade segment is expected to maintain its dominance and witness continued growth in the coming years.
Lactobacillaceae Market Share Analysis: Medical Industry is the fastest growing segment over the forecast period to 2032
In the Lactobacillaceae market, the Medical Industry segment is experiencing rapid growth and significant demand expansion projected up to 2032. Lactobacillaceae bacteria have gained considerable attention in medical applications due to their probiotic properties and potential health benefits. These bacteria are increasingly recognized for their role in supporting digestive health, immune system modulation, and even in therapeutic interventions for certain medical conditions. Medical research continues to explore new avenues for Lactobacillaceae strains, including their use in treating gastrointestinal disorders, preventing antibiotic-associated diarrhea, managing irritable bowel syndrome, and potentially even influencing mental health through the gut-brain axis. The Medical Industry segment's growth is driven by rising consumer awareness of probiotics' health benefits, coupled with advancements in probiotic formulation technologies that enhance bacterial survival and efficacy in medical settings. Regulatory approvals and clinical studies supporting these applications further bolster market expansion, making the Medical Industry a promising area for future developments in Lactobacillaceae-based products and therapies.
Lactobacillaceae Market Segmentation
By Type
Food Grade
Pharmaceutical Grade
By Application
Food Industry
Medical Industry
Others
Countries Analyzed
North America (US, Canada, Mexico)
Europe (Germany, UK, France, Spain, Italy, Russia, Rest of Europe)
Asia Pacific (China, India, Japan, South Korea, Australia, South East Asia, Rest of Asia)
South America (Brazil, Argentina, Rest of South America)
Middle East and Africa (Saudi Arabia, UAE, Rest of Middle East, South Africa, Egypt, Rest of Africa)
Lactobacillaceae Companies Profiled in the Study
Biena
Bioprox
Chr. Hansen Holdings A/S
Clerici-Sacco Group
DuPont Nutrition and Health
MAK Wood
Meteoric Lifesciences
Mystical Biotech
Nebraska Cultures
Ultra Bio-Logics
*- List Not Exhaustive
Chapter 1. TABLE OF CONTENTS
Chapter 2. Introduction to Lactobacillaceae Market
2.1. Market Overview
2.2. Key Statistics and Report Highlights
2.3. Scope of the Comprehensive Study
2.3.1. Market Definition
2.3.2 Countries and Regions Covered
2.3.3 Research Objective
2.3.4 Units, Currency, and Conversions
2.3.5 Industry Value Chain
2.4. Key Market Segments
2.5. Key Companies
2.6. Study Period
Chapter 3. Strategic Analysis Review
3.1. Lactobacillaceae Pricing Analysis and Forecast
3.2. Porter’s Five Forces
3.3. Market Ecosystem
3.4. SWOT Analysis
3.5. Regulatory Scenario
3.3. Effects of Inflation, Russia-Ukraine War, moderating economic growth, and other macroeconomic factors
Chapter 4. Competitive Landscape
4.1. Market Share Analysis
4.1.1. Global Lactobacillaceae Market Share by Company, 2023
4.1.2. Product Offerings of Leading Lactobacillaceae Companies
4.2. Market Entropy
4.2.1. New Product Launches in the Industry
4.2.2. Mergers, Acquisitions, Joint ventures, and Partnerships
4.3. Key Strategies and Best Practices
Chapter 5. Global Market Projections: Best, Reference, and Low Case Scenarios
5.1. Growth Analysis- Case Scenario Definitions
5.2. Low Growth Case Scenario Forecasts
5.3. Reference Growth Case Scenario Forecasts
5.4. High Growth Case Scenario Forecasts
Chapter 6. Market Dynamics
6.1. Lactobacillaceae Market Drivers
6.2. Lactobacillaceae Market Challenges
6.6. Lactobacillaceae Market Opportunities
6.4. Lactobacillaceae Market Trends
Chapter 7. Global Lactobacillaceae Market Outlook Trends
7.1. Global Lactobacillaceae Revenue (USD Million) and CAGR (%) by Type (2021-2032)
7.2. Global Lactobacillaceae Revenue (USD Million) and CAGR (%) by Application (2021-2032)
7.3. Global Lactobacillaceae Revenue (USD Million) and CAGR (%) by Product (2021-2032)
By Type
Food Grade
Pharmaceutical Grade
By Application
Food Industry
Medical Industry
Others
Chapter 8. Global Lactobacillaceae Regional Analysis and Outlook
8.1. Global Lactobacillaceae Revenue (USD Million) By Regions (2021- 2032)
8.2. North America Lactobacillaceae Revenue (USD Million) by Country (2021-2032)
8.2.1. United States Lactobacillaceae Regional Analysis and Outlook
8.2.2. Canada Lactobacillaceae Regional Analysis and Outlook
8.2.3. Mexico Lactobacillaceae Regional Analysis and Outlook
8.3. Europe Lactobacillaceae Revenue (USD Million), by Country (2021-2032)
8.3.1. Germany Lactobacillaceae Regional Analysis and Outlook
8.3.2. France Lactobacillaceae Regional Analysis and Outlook
8.3.3. United Kingdom Lactobacillaceae Regional Analysis and Outlook
8.3.4. Spain Lactobacillaceae Regional Analysis and Outlook
8.3.5. Italy Lactobacillaceae Regional Analysis and Outlook
8.3.6. Russia Lactobacillaceae Regional Analysis and Outlook
8.3.7. Rest of Europe Lactobacillaceae Regional Analysis and Outlook
8.4. Asia Pacific Lactobacillaceae Revenue (USD Million) by Country (2021-2032)
8.4.1. China Lactobacillaceae Regional Analysis and Outlook
8.4.2. Japan Lactobacillaceae Regional Analysis and Outlook
8.4.3. India Lactobacillaceae Regional Analysis and Outlook
8.4.4. South Korea Lactobacillaceae Regional Analysis and Outlook
8.4.5. Australia Lactobacillaceae Regional Analysis and Outlook
8.4.6. South East Asia Lactobacillaceae Regional Analysis and Outlook
8.4.7. Rest of Asia Pacific Lactobacillaceae Regional Analysis and Outlook
8.5. South America Lactobacillaceae Revenue (USD Million), by Country (2021-2032)
8.5.1. Brazil Lactobacillaceae Regional Analysis and Outlook
8.5.2. Argentina Lactobacillaceae Regional Analysis and Outlook
8.5.3. Rest of South America Lactobacillaceae Regional Analysis and Outlook
8.6. Middle East and Africa Lactobacillaceae Revenue (USD Million) by Country (2021-2032)
8.6.1. Middle East Lactobacillaceae Regional Analysis and Outlook
8.6.2. Africa Lactobacillaceae Regional Analysis and Outlook
Chapter 9. North America Lactobacillaceae Analysis and Outlook
9.1. North America Lactobacillaceae Revenue (USD Million) by Segments (2021-2032)
9.1.1. North America Lactobacillaceae Revenue (USD Million) by Type (2021-2032)
9.1.2. North America Lactobacillaceae Revenue (USD Million) by Application (2021-2032)
9.1.3. North America Lactobacillaceae Revenue (USD Million) by Product (2021-2032)
By Type
Food Grade
Pharmaceutical Grade
By Application
Food Industry
Medical Industry
Others
Chapter 10. Europe Lactobacillaceae Analysis and Outlook
10.1. Europe Lactobacillaceae Revenue (USD Million), by Segments (USD Million) (2021-2032)
10.1.1. Europe Lactobacillaceae Revenue (USD Million) by Type (2021-2032)
10.1.2. Europe Lactobacillaceae Revenue (USD Million) by Application (2021-2032)
10.1.3. Europe Lactobacillaceae Revenue (USD Million) by Product (2021-2032)
By Type
Food Grade
Pharmaceutical Grade
By Application
Food Industry
Medical Industry
Others
Chapter 11. Asia Pacific Lactobacillaceae Analysis and Outlook
11.1. Asia Pacific Lactobacillaceae Revenue (USD Million), and Revenue (USD Million) by Segments (2021-2032)
11.1.1. Asia Pacific Lactobacillaceae Revenue (USD Million) by Type (2021-2032)
11.1.2. Asia Pacific Lactobacillaceae Revenue (USD Million) by Application (2021-2032)
11.1.3. Asia Pacific Lactobacillaceae Revenue (USD Million) by Product (2021-2032)
By Type
Food Grade
Pharmaceutical Grade
By Application
Food Industry
Medical Industry
Others
Chapter 12. South America Lactobacillaceae Analysis and Outlook
12.1. South America Lactobacillaceae Revenue (USD Million), by Segments (2021-2032)
12.1.1. South America Lactobacillaceae Revenue (USD Million) by Type (2021-2032)
12.1.2. South America Lactobacillaceae Revenue (USD Million) by Application (2021-2032)
12.1.3. South America Lactobacillaceae Revenue (USD Million) by Product (2021-2032)
By Type
Food Grade
Pharmaceutical Grade
By Application
Food Industry
Medical Industry
Others
Chapter 13. Middle East and Africa Lactobacillaceae Analysis and Outlook
13.1. Middle East and Africa Lactobacillaceae Revenue (USD Million), by Segments (2021-2032)
13.1.1. Middle East and Africa Lactobacillaceae Revenue (USD Million) by Type (2021-2032)
13.1.2. Middle East and Africa Lactobacillaceae Revenue (USD Million) by Application (2021-2032)
13.1.3. Middle East and Africa Lactobacillaceae Revenue (USD Million) by Product (2021-2032)
By Type
Food Grade
Pharmaceutical Grade
By Application
Food Industry
Medical Industry
Others
Chapter 14. Lactobacillaceae Company Profiles
14.1 Business Overview
14.2 Product Profiles
14.3 SWOT Profiles
14.5 Recent Developments
14.6 Financial Profile
List of Companies
Biena
Bioprox
Chr. Hansen Holdings A/S
Clerici-Sacco Group
DuPont Nutrition and Health
MAK Wood
Meteoric Lifesciences
Mystical Biotech
Nebraska Cultures
Ultra Bio-Logics
15. Methodology and Data Sources
15.1 Customization Offerings
15.2 Subscription Services
15.3 Related Reports
15.4 Publisher Expertise
LIST OF TABLES
Table 1 Market Segmentation Analysis
Table 2 Global Lactobacillaceae Market Share of Leading Companies, 2023
Table 3 Product Offerings of Leading Companies
Table 4 Low Growth Scenario Forecasts
Table 5 Reference Case Growth Scenario
Table 6 High Growth Case Scenario
Table 7 Global Lactobacillaceae Revenue (USD Million) And CAGR (%) By Type (2021-2032)
Table 8 Global Lactobacillaceae Revenue (USD Million) And CAGR (%) By Application (2021-2032)
Table 9 Global Lactobacillaceae Revenue (USD Million) And CAGR (%) By Product (2021-2032)
Table 10 Global Lactobacillaceae Market Revenue (USD Million) By Regions (2021-2032)
Table 11 Global Lactobacillaceae Market Share (%) By Regions (2021-2032)
Table 12 North America Lactobacillaceae Revenue (USD Million) By Country (2021-2032)
Table 13 Europe Lactobacillaceae Revenue (USD Million) By Country (2021-2032)
Table 14 Asia Pacific Lactobacillaceae Revenue (USD Million) By Country (2021-2032)
Table 15 South America Lactobacillaceae Revenue (USD Million) By Country (2021-2032)
Table 16 Middle East and Africa Lactobacillaceae Revenue (USD Million) By Region (2021-2032)
Table 17 North America Lactobacillaceae Revenue (USD Million) By Type (2021-2032)
Table 18 North America Lactobacillaceae Revenue (USD Million) By Application (2021-2032)
Table 19 North America Lactobacillaceae Revenue (USD Million) By Product (2021-2032)
Table 20 Europe Lactobacillaceae Revenue (USD Million) By Type (2021-2032)
Table 21 Europe Lactobacillaceae Revenue (USD Million) By Application (2021-2032)
Table 22 Europe Lactobacillaceae Revenue (USD Million) By Product (2021-2032)
Table 23 Asia Pacific Lactobacillaceae Revenue (USD Million) By Type (2021-2032)
Table 24 Asia Pacific Lactobacillaceae Revenue (USD Million) By Application (2021-2032)
Table 25 Asia Pacific Lactobacillaceae Revenue (USD Million) By Product (2021-2032)
Table 26 South America Lactobacillaceae Revenue (USD Million) By Type (2021-2032)
Table 27 South America Lactobacillaceae Revenue (USD Million) By Application (2021-2032)
Table 28 South America Lactobacillaceae Revenue (USD Million) By Product (2021-2032)
Table 29 Middle East and Africa Lactobacillaceae Revenue (USD Million) By Type (2021-2032)
Table 30 Middle East and Africa Lactobacillaceae Revenue (USD Million) By Application (2021-2032)
Table 31 Middle East and Africa Lactobacillaceae Revenue (USD Million) By Product (2021-2032)
LIST OF FIGURES
Figure 1. Market Scope
Figure 2. Pricing Forecasts Per Unit, 2023- 2032
Figure 3. Porter’s Five Forces
Figure 4. Global Lactobacillaceae Market Revenue (USD Million) By Regions (2021-2032)
Figure 5. Global Lactobacillaceae Market Share (%) By Regions (2023)
Figure 6. North America Lactobacillaceae Revenue (USD Million) By Country (2021-2032)
Figure 7. United States Lactobacillaceae Revenue (USD Million) By Country (2021-2032)
Figure 8. Canada Lactobacillaceae Revenue (USD Million) By Country (2021-2032)
Figure 9. Mexico Lactobacillaceae Revenue (USD Million) By Country (2021-2032)
Figure 10. Europe Lactobacillaceae Revenue (USD Million) By Country (2021-2032)
Figure 11. Germany Lactobacillaceae Revenue (USD Million) By Country (2021-2032)
Figure 12. France Lactobacillaceae Revenue (USD Million) By Country (2021-2032)
Figure 13. United Kingdom Lactobacillaceae Revenue (USD Million) By Country (2021-2032)
Figure 14. Spain Lactobacillaceae Revenue (USD Million) By Country (2021-2032)
Figure 15. Italy Lactobacillaceae Revenue (USD Million) By Country (2021-2032)
Figure 16. Russia Lactobacillaceae Revenue (USD Million) By Country (2021-2032)
Figure 17. Rest of Europe Lactobacillaceae Revenue (USD Million) By Country (2021-2032)
Figure 11. Asia Pacific Lactobacillaceae Revenue (USD Million) By Country (2021-2032)
Figure 12. China Lactobacillaceae Revenue (USD Million) By Country (2021-2032)
Figure 13. Japan Lactobacillaceae Revenue (USD Million) By Country (2021-2032)
Figure 14. India Lactobacillaceae Revenue (USD Million) By Country (2021-2032)
Figure 15. South Korea Lactobacillaceae Revenue (USD Million) By Country (2021-2032)
Figure 16. Australia Lactobacillaceae Revenue (USD Million) By Country (2021-2032)
Figure 17. South East Asia Lactobacillaceae Revenue (USD Million) By Country (2021-2032)
Figure 18. South America Lactobacillaceae Revenue (USD Million) By Country (2021-2032)
Figure 19. Brazil Lactobacillaceae Revenue (USD Million) By Country (2021-2032)
Figure 20. Argentina Lactobacillaceae Revenue (USD Million) By Country (2021-2032)
Figure 21. Rest of Asia Pacific Lactobacillaceae Revenue (USD Million) By Country (2021-2032)
Figure 22. Middle East and Africa Lactobacillaceae Revenue (USD Million) By Region (2021-2032)
Figure 23. Saudi Arabia Lactobacillaceae Revenue (USD Million) By Region (2021-2032)
Figure 24. The UAE Lactobacillaceae Revenue (USD Million) By Region (2021-2032)
Figure 25. Rest of Middle East Lactobacillaceae Revenue (USD Million) By Region (2021-2032)
Figure 26. South Africa Lactobacillaceae Revenue (USD Million) By Region (2021-2032)
Figure 27. Africa Lactobacillaceae Revenue (USD Million) By Region (2021-2032)
Figure 28. North America Lactobacillaceae Revenue (USD Million) By Type (2021-2032)
Figure 29. North America Lactobacillaceae Revenue (USD Million) By Application (2021-2032)
Figure 30. North America Lactobacillaceae Revenue (USD Million) By Product (2021-2032)
Figure 31. Europe Lactobacillaceae Revenue (USD Million) By Type (2021-2032)
Figure 32. Europe Lactobacillaceae Revenue (USD Million) By Application (2021-2032)
Figure 33. Europe Lactobacillaceae Revenue (USD Million) By Product (2021-2032)
Figure 34. Asia Pacific Lactobacillaceae Revenue (USD Million) By Type (2021-2032)
Figure 35. Asia Pacific Lactobacillaceae Revenue (USD Million) By Application (2021-2032)
Figure 36. Asia Pacific Lactobacillaceae Revenue (USD Million) By Product (2021-2032)
Figure 37. South America Lactobacillaceae Revenue (USD Million) By Type (2021-2032)
Figure 38. South America Lactobacillaceae Revenue (USD Million) By Application (2021-2032)
Figure 39. South America Lactobacillaceae Revenue (USD Million) By Product (2021-2032)
Figure 40. Middle East and Africa Lactobacillaceae Revenue (USD Million) By Type (2021-2032)
Figure 41. Middle East and Africa Lactobacillaceae Revenue (USD Million) By Application (2021-2032)
Figure 42. Middle East and Africa Lactobacillaceae Revenue (USD Million) By Product (2021-2032)
By Type
Food Grade
Pharmaceutical Grade
By Application
Food Industry
Medical Industry
Others
Countries Analyzed
North America (US, Canada, Mexico)
Europe (Germany, UK, France, Spain, Italy, Russia, Rest of Europe)
Asia Pacific (China, India, Japan, South Korea, Australia, South East Asia, Rest of Asia)
South America (Brazil, Argentina, Rest of South America)
Middle East and Africa (Saudi Arabia, UAE, Rest of Middle East, South Africa, Egypt, Rest of Africa)
