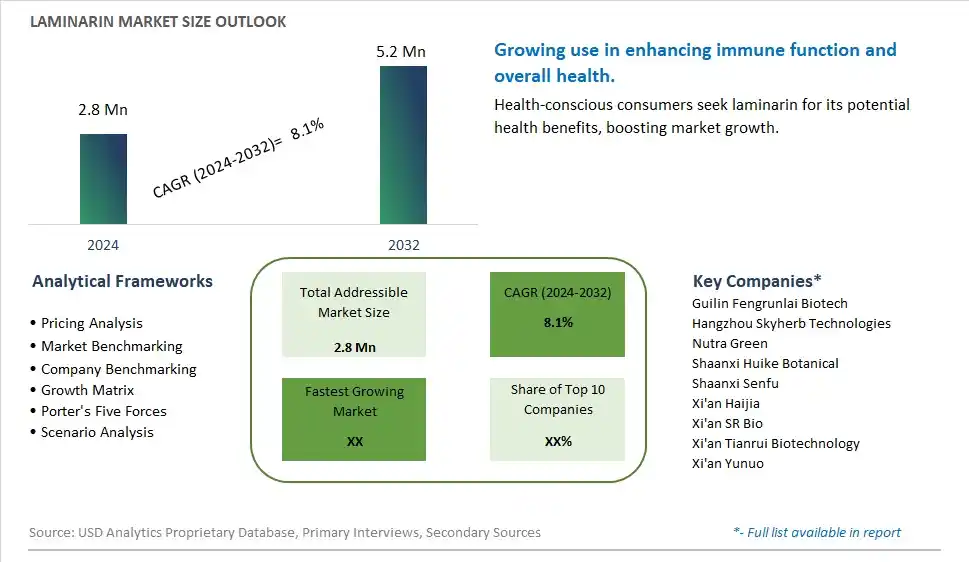
Global Laminarin Market Size is valued at $2.8 Million in 2024 and is forecast to register a growth rate (CAGR) of 8.1% to reach $5.2 Million by 2032.
The global Laminarin Market Comprehensive Study analyzes and forecasts the market size across 6 regions and 24 countries for diverse segments -By Type (20 to 30% Purity, 30 to 60% Purity, 60 to 95% Purity, Others), By Application (Food & Beverages, Dietary Supplements, Others)
An Introduction to Laminarin Market
The laminarin market in 2024 is experiencing robust growth, driven by the rising demand for natural and functional ingredients in the food, pharmaceutical, and cosmetic industries. Laminarin, a polysaccharide derived from brown seaweed, is valued for its antioxidant, anti-inflammatory, and immune-boosting properties. The market benefits from increasing consumer interest in natural health products and the trend towards marine-sourced ingredients. Innovations in extraction and processing techniques are enhancing the purity and efficacy of laminarin products. The trend towards clean label and sustainable ingredients is further propelling market demand.
Laminarin Competitive Landscape
The market report analyses the leading companies in the industry including Guilin Fengrunlai Biotech, Hangzhou Skyherb Technologies, Nutra Green, Shaanxi Huike Botanical, Shaanxi Senfu, Xi'an Haijia, Xi'an SR Bio, Xi'an Tianrui Biotechnology, Xi'an Yunuo, and Others.
Laminarin Market Dynamics
Laminarin Market Trend: Growing Interest in Marine-Derived Ingredients
The most prominent trend in the Laminarin Market is the growing interest in marine-derived ingredients. Laminarin, a polysaccharide extracted from brown seaweed, is gaining popularity for its potential health benefits and applications in various industries, including food, pharmaceuticals, and cosmetics. This trend is driven by the rising demand for natural and sustainable ingredients.
Laminarin Market Driver: Increasing Research and Development Activities
A key driver in the Laminarin Market is the increasing research and development activities focused on marine bioactive compounds. Scientific studies have highlighted the potential health benefits of laminarin, such as its antioxidant, anti-inflammatory, and immunomodulatory properties. This growing body of research supports the development and commercialization of laminarin-based products.
Laminarin Market Opportunity: Expansion into Functional Foods and Nutraceuticals
One significant opportunity in the Laminarin Market lies in the expansion into functional foods and nutraceuticals. Companies can explore incorporating laminarin into a variety of health-focused products, such as dietary supplements, fortified foods, and functional beverages. By leveraging the health benefits of laminarin, manufacturers can attract health-conscious consumers and drive market growth.
Laminarin Market Share Analysis: 60 to 95% Purity segment generated the highest revenue share in the industry
Within the Laminarin market, the 60 to 95% Purity segment stands out as the largest segment. Laminarin, a type of beta-glucan polysaccharide found in brown algae, varies in purity levels that affect its applications and market demand. The 60 to 95% purity range indicates a high concentration of laminarin, making it suitable for diverse industrial and pharmaceutical applications. High-purity laminarin is prized for its bioactive properties, including immune-modulating effects, antioxidant activity, and potential therapeutic applications in managing various health conditions. Industries utilize 60 to 95% pure laminarin in dietary supplements, functional foods, cosmetics, and pharmaceutical formulations aimed at promoting health and wellness. The robust demand for high-purity laminarin stems from ongoing research and development efforts exploring its medicinal benefits, coupled with consumer preferences for natural and effective bioactive ingredients. As technological advancements enhance extraction and purification processes, the market for 60 to 95% pure laminarin is expected to grow steadily, driven by its versatile applications across multiple sectors.
Laminarin Market Share Analysis: Dietary Supplements is the fastest growing segment over the forecast period to 2032
Among the segments in the Laminarin market, Dietary Supplements emerge as the fastest-growing segment projected to 2032. Laminarin, a prominent beta-glucan found in brown algae, is gaining traction in the dietary supplements industry due to its recognized health benefits. As consumers become more health-conscious and seek natural alternatives, laminarin's role in supporting immune function, promoting gut health, and acting as an antioxidant has garnered significant interest. The demand for dietary supplements containing laminarin is driven by increasing consumer awareness of its potential therapeutic properties and the growing preference for supplements derived from natural marine sources. Furthermore, ongoing research into laminarin's bioactive compounds and its application in personalized nutrition contributes to its expanding market presence. Manufacturers are investing in innovative formulations and product development to capitalize on the rising consumer demand for dietary supplements enriched with laminarin. With regulatory support and expanding distribution channels, the dietary supplements segment of the laminarin market is poised for substantial growth in the coming years, reflecting broader trends towards natural and functional ingredients in health and wellness products.
Laminarin Market Segmentation
By Type
20 to 30% Purity
30 to 60% Purity
60 to 95% Purity
Others
By Application
Food & Beverages
Dietary Supplements
Others
Countries Analyzed
North America (US, Canada, Mexico)
Europe (Germany, UK, France, Spain, Italy, Russia, Rest of Europe)
Asia Pacific (China, India, Japan, South Korea, Australia, South East Asia, Rest of Asia)
South America (Brazil, Argentina, Rest of South America)
Middle East and Africa (Saudi Arabia, UAE, Rest of Middle East, South Africa, Egypt, Rest of Africa)
Laminarin Companies Profiled in the Study
Guilin Fengrunlai Biotech
Hangzhou Skyherb Technologies
Nutra Green
Shaanxi Huike Botanical
Shaanxi Senfu
Xi'an Haijia
Xi'an SR Bio
Xi'an Tianrui Biotechnology
Xi'an Yunuo
*- List Not Exhaustive
Chapter 1. TABLE OF CONTENTS
Chapter 2. Introduction to Laminarin Market
2.1. Market Overview
2.2. Key Statistics and Report Highlights
2.3. Scope of the Comprehensive Study
2.3.1. Market Definition
2.3.2 Countries and Regions Covered
2.3.3 Research Objective
2.3.4 Units, Currency, and Conversions
2.3.5 Industry Value Chain
2.4. Key Market Segments
2.5. Key Companies
2.6. Study Period
Chapter 3. Strategic Analysis Review
3.1. Laminarin Pricing Analysis and Forecast
3.2. Porter’s Five Forces
3.3. Market Ecosystem
3.4. SWOT Analysis
3.5. Regulatory Scenario
3.3. Effects of Inflation, Russia-Ukraine War, moderating economic growth, and other macroeconomic factors
Chapter 4. Competitive Landscape
4.1. Market Share Analysis
4.1.1. Global Laminarin Market Share by Company, 2023
4.1.2. Product Offerings of Leading Laminarin Companies
4.2. Market Entropy
4.2.1. New Product Launches in the Industry
4.2.2. Mergers, Acquisitions, Joint ventures, and Partnerships
4.3. Key Strategies and Best Practices
Chapter 5. Global Market Projections: Best, Reference, and Low Case Scenarios
5.1. Growth Analysis- Case Scenario Definitions
5.2. Low Growth Case Scenario Forecasts
5.3. Reference Growth Case Scenario Forecasts
5.4. High Growth Case Scenario Forecasts
Chapter 6. Market Dynamics
6.1. Laminarin Market Drivers
6.2. Laminarin Market Challenges
6.6. Laminarin Market Opportunities
6.4. Laminarin Market Trends
Chapter 7. Global Laminarin Market Outlook Trends
7.1. Global Laminarin Revenue (USD Million) and CAGR (%) by Type (2021-2032)
7.2. Global Laminarin Revenue (USD Million) and CAGR (%) by Application (2021-2032)
7.3. Global Laminarin Revenue (USD Million) and CAGR (%) by Product (2021-2032)
By Type
20 to 30% Purity
30 to 60% Purity
60 to 95% Purity
Others
By Application
Food & Beverages
Dietary Supplements
Others
Chapter 8. Global Laminarin Regional Analysis and Outlook
8.1. Global Laminarin Revenue (USD Million) By Regions (2021- 2032)
8.2. North America Laminarin Revenue (USD Million) by Country (2021-2032)
8.2.1. United States Laminarin Regional Analysis and Outlook
8.2.2. Canada Laminarin Regional Analysis and Outlook
8.2.3. Mexico Laminarin Regional Analysis and Outlook
8.3. Europe Laminarin Revenue (USD Million), by Country (2021-2032)
8.3.1. Germany Laminarin Regional Analysis and Outlook
8.3.2. France Laminarin Regional Analysis and Outlook
8.3.3. United Kingdom Laminarin Regional Analysis and Outlook
8.3.4. Spain Laminarin Regional Analysis and Outlook
8.3.5. Italy Laminarin Regional Analysis and Outlook
8.3.6. Russia Laminarin Regional Analysis and Outlook
8.3.7. Rest of Europe Laminarin Regional Analysis and Outlook
8.4. Asia Pacific Laminarin Revenue (USD Million) by Country (2021-2032)
8.4.1. China Laminarin Regional Analysis and Outlook
8.4.2. Japan Laminarin Regional Analysis and Outlook
8.4.3. India Laminarin Regional Analysis and Outlook
8.4.4. South Korea Laminarin Regional Analysis and Outlook
8.4.5. Australia Laminarin Regional Analysis and Outlook
8.4.6. South East Asia Laminarin Regional Analysis and Outlook
8.4.7. Rest of Asia Pacific Laminarin Regional Analysis and Outlook
8.5. South America Laminarin Revenue (USD Million), by Country (2021-2032)
8.5.1. Brazil Laminarin Regional Analysis and Outlook
8.5.2. Argentina Laminarin Regional Analysis and Outlook
8.5.3. Rest of South America Laminarin Regional Analysis and Outlook
8.6. Middle East and Africa Laminarin Revenue (USD Million) by Country (2021-2032)
8.6.1. Middle East Laminarin Regional Analysis and Outlook
8.6.2. Africa Laminarin Regional Analysis and Outlook
Chapter 9. North America Laminarin Analysis and Outlook
9.1. North America Laminarin Revenue (USD Million) by Segments (2021-2032)
9.1.1. North America Laminarin Revenue (USD Million) by Type (2021-2032)
9.1.2. North America Laminarin Revenue (USD Million) by Application (2021-2032)
9.1.3. North America Laminarin Revenue (USD Million) by Product (2021-2032)
By Type
20 to 30% Purity
30 to 60% Purity
60 to 95% Purity
Others
By Application
Food & Beverages
Dietary Supplements
Others
Chapter 10. Europe Laminarin Analysis and Outlook
10.1. Europe Laminarin Revenue (USD Million), by Segments (USD Million) (2021-2032)
10.1.1. Europe Laminarin Revenue (USD Million) by Type (2021-2032)
10.1.2. Europe Laminarin Revenue (USD Million) by Application (2021-2032)
10.1.3. Europe Laminarin Revenue (USD Million) by Product (2021-2032)
By Type
20 to 30% Purity
30 to 60% Purity
60 to 95% Purity
Others
By Application
Food & Beverages
Dietary Supplements
Others
Chapter 11. Asia Pacific Laminarin Analysis and Outlook
11.1. Asia Pacific Laminarin Revenue (USD Million), and Revenue (USD Million) by Segments (2021-2032)
11.1.1. Asia Pacific Laminarin Revenue (USD Million) by Type (2021-2032)
11.1.2. Asia Pacific Laminarin Revenue (USD Million) by Application (2021-2032)
11.1.3. Asia Pacific Laminarin Revenue (USD Million) by Product (2021-2032)
By Type
20 to 30% Purity
30 to 60% Purity
60 to 95% Purity
Others
By Application
Food & Beverages
Dietary Supplements
Others
Chapter 12. South America Laminarin Analysis and Outlook
12.1. South America Laminarin Revenue (USD Million), by Segments (2021-2032)
12.1.1. South America Laminarin Revenue (USD Million) by Type (2021-2032)
12.1.2. South America Laminarin Revenue (USD Million) by Application (2021-2032)
12.1.3. South America Laminarin Revenue (USD Million) by Product (2021-2032)
By Type
20 to 30% Purity
30 to 60% Purity
60 to 95% Purity
Others
By Application
Food & Beverages
Dietary Supplements
Others
Chapter 13. Middle East and Africa Laminarin Analysis and Outlook
13.1. Middle East and Africa Laminarin Revenue (USD Million), by Segments (2021-2032)
13.1.1. Middle East and Africa Laminarin Revenue (USD Million) by Type (2021-2032)
13.1.2. Middle East and Africa Laminarin Revenue (USD Million) by Application (2021-2032)
13.1.3. Middle East and Africa Laminarin Revenue (USD Million) by Product (2021-2032)
By Type
20 to 30% Purity
30 to 60% Purity
60 to 95% Purity
Others
By Application
Food & Beverages
Dietary Supplements
Others
Chapter 14. Laminarin Company Profiles
14.1 Business Overview
14.2 Product Profiles
14.3 SWOT Profiles
14.5 Recent Developments
14.6 Financial Profile
List of Companies
Guilin Fengrunlai Biotech
Hangzhou Skyherb Technologies
Nutra Green
Shaanxi Huike Botanical
Shaanxi Senfu
Xi'an Haijia
Xi'an SR Bio
Xi'an Tianrui Biotechnology
Xi'an Yunuo
15. Methodology and Data Sources
15.1 Customization Offerings
15.2 Subscription Services
15.3 Related Reports
15.4 Publisher Expertise
LIST OF TABLES
Table 1 Market Segmentation Analysis
Table 2 Global Laminarin Market Share of Leading Companies, 2023
Table 3 Product Offerings of Leading Companies
Table 4 Low Growth Scenario Forecasts
Table 5 Reference Case Growth Scenario
Table 6 High Growth Case Scenario
Table 7 Global Laminarin Revenue (USD Million) And CAGR (%) By Type (2021-2032)
Table 8 Global Laminarin Revenue (USD Million) And CAGR (%) By Application (2021-2032)
Table 9 Global Laminarin Revenue (USD Million) And CAGR (%) By Product (2021-2032)
Table 10 Global Laminarin Market Revenue (USD Million) By Regions (2021-2032)
Table 11 Global Laminarin Market Share (%) By Regions (2021-2032)
Table 12 North America Laminarin Revenue (USD Million) By Country (2021-2032)
Table 13 Europe Laminarin Revenue (USD Million) By Country (2021-2032)
Table 14 Asia Pacific Laminarin Revenue (USD Million) By Country (2021-2032)
Table 15 South America Laminarin Revenue (USD Million) By Country (2021-2032)
Table 16 Middle East and Africa Laminarin Revenue (USD Million) By Region (2021-2032)
Table 17 North America Laminarin Revenue (USD Million) By Type (2021-2032)
Table 18 North America Laminarin Revenue (USD Million) By Application (2021-2032)
Table 19 North America Laminarin Revenue (USD Million) By Product (2021-2032)
Table 20 Europe Laminarin Revenue (USD Million) By Type (2021-2032)
Table 21 Europe Laminarin Revenue (USD Million) By Application (2021-2032)
Table 22 Europe Laminarin Revenue (USD Million) By Product (2021-2032)
Table 23 Asia Pacific Laminarin Revenue (USD Million) By Type (2021-2032)
Table 24 Asia Pacific Laminarin Revenue (USD Million) By Application (2021-2032)
Table 25 Asia Pacific Laminarin Revenue (USD Million) By Product (2021-2032)
Table 26 South America Laminarin Revenue (USD Million) By Type (2021-2032)
Table 27 South America Laminarin Revenue (USD Million) By Application (2021-2032)
Table 28 South America Laminarin Revenue (USD Million) By Product (2021-2032)
Table 29 Middle East and Africa Laminarin Revenue (USD Million) By Type (2021-2032)
Table 30 Middle East and Africa Laminarin Revenue (USD Million) By Application (2021-2032)
Table 31 Middle East and Africa Laminarin Revenue (USD Million) By Product (2021-2032)
LIST OF FIGURES
Figure 1. Market Scope
Figure 2. Pricing Forecasts Per Unit, 2023- 2032
Figure 3. Porter’s Five Forces
Figure 4. Global Laminarin Market Revenue (USD Million) By Regions (2021-2032)
Figure 5. Global Laminarin Market Share (%) By Regions (2023)
Figure 6. North America Laminarin Revenue (USD Million) By Country (2021-2032)
Figure 7. United States Laminarin Revenue (USD Million) By Country (2021-2032)
Figure 8. Canada Laminarin Revenue (USD Million) By Country (2021-2032)
Figure 9. Mexico Laminarin Revenue (USD Million) By Country (2021-2032)
Figure 10. Europe Laminarin Revenue (USD Million) By Country (2021-2032)
Figure 11. Germany Laminarin Revenue (USD Million) By Country (2021-2032)
Figure 12. France Laminarin Revenue (USD Million) By Country (2021-2032)
Figure 13. United Kingdom Laminarin Revenue (USD Million) By Country (2021-2032)
Figure 14. Spain Laminarin Revenue (USD Million) By Country (2021-2032)
Figure 15. Italy Laminarin Revenue (USD Million) By Country (2021-2032)
Figure 16. Russia Laminarin Revenue (USD Million) By Country (2021-2032)
Figure 17. Rest of Europe Laminarin Revenue (USD Million) By Country (2021-2032)
Figure 11. Asia Pacific Laminarin Revenue (USD Million) By Country (2021-2032)
Figure 12. China Laminarin Revenue (USD Million) By Country (2021-2032)
Figure 13. Japan Laminarin Revenue (USD Million) By Country (2021-2032)
Figure 14. India Laminarin Revenue (USD Million) By Country (2021-2032)
Figure 15. South Korea Laminarin Revenue (USD Million) By Country (2021-2032)
Figure 16. Australia Laminarin Revenue (USD Million) By Country (2021-2032)
Figure 17. South East Asia Laminarin Revenue (USD Million) By Country (2021-2032)
Figure 18. South America Laminarin Revenue (USD Million) By Country (2021-2032)
Figure 19. Brazil Laminarin Revenue (USD Million) By Country (2021-2032)
Figure 20. Argentina Laminarin Revenue (USD Million) By Country (2021-2032)
Figure 21. Rest of Asia Pacific Laminarin Revenue (USD Million) By Country (2021-2032)
Figure 22. Middle East and Africa Laminarin Revenue (USD Million) By Region (2021-2032)
Figure 23. Saudi Arabia Laminarin Revenue (USD Million) By Region (2021-2032)
Figure 24. The UAE Laminarin Revenue (USD Million) By Region (2021-2032)
Figure 25. Rest of Middle East Laminarin Revenue (USD Million) By Region (2021-2032)
Figure 26. South Africa Laminarin Revenue (USD Million) By Region (2021-2032)
Figure 27. Africa Laminarin Revenue (USD Million) By Region (2021-2032)
Figure 28. North America Laminarin Revenue (USD Million) By Type (2021-2032)
Figure 29. North America Laminarin Revenue (USD Million) By Application (2021-2032)
Figure 30. North America Laminarin Revenue (USD Million) By Product (2021-2032)
Figure 31. Europe Laminarin Revenue (USD Million) By Type (2021-2032)
Figure 32. Europe Laminarin Revenue (USD Million) By Application (2021-2032)
Figure 33. Europe Laminarin Revenue (USD Million) By Product (2021-2032)
Figure 34. Asia Pacific Laminarin Revenue (USD Million) By Type (2021-2032)
Figure 35. Asia Pacific Laminarin Revenue (USD Million) By Application (2021-2032)
Figure 36. Asia Pacific Laminarin Revenue (USD Million) By Product (2021-2032)
Figure 37. South America Laminarin Revenue (USD Million) By Type (2021-2032)
Figure 38. South America Laminarin Revenue (USD Million) By Application (2021-2032)
Figure 39. South America Laminarin Revenue (USD Million) By Product (2021-2032)
Figure 40. Middle East and Africa Laminarin Revenue (USD Million) By Type (2021-2032)
Figure 41. Middle East and Africa Laminarin Revenue (USD Million) By Application (2021-2032)
Figure 42. Middle East and Africa Laminarin Revenue (USD Million) By Product (2021-2032)
By Type
20 to 30% Purity
30 to 60% Purity
60 to 95% Purity
Others
By Application
Food & Beverages
Dietary Supplements
Others
Countries Analyzed
North America (US, Canada, Mexico)
Europe (Germany, UK, France, Spain, Italy, Russia, Rest of Europe)
Asia Pacific (China, India, Japan, South Korea, Australia, South East Asia, Rest of Asia)
South America (Brazil, Argentina, Rest of South America)
Middle East and Africa (Saudi Arabia, UAE, Rest of Middle East, South Africa, Egypt, Rest of Africa)
