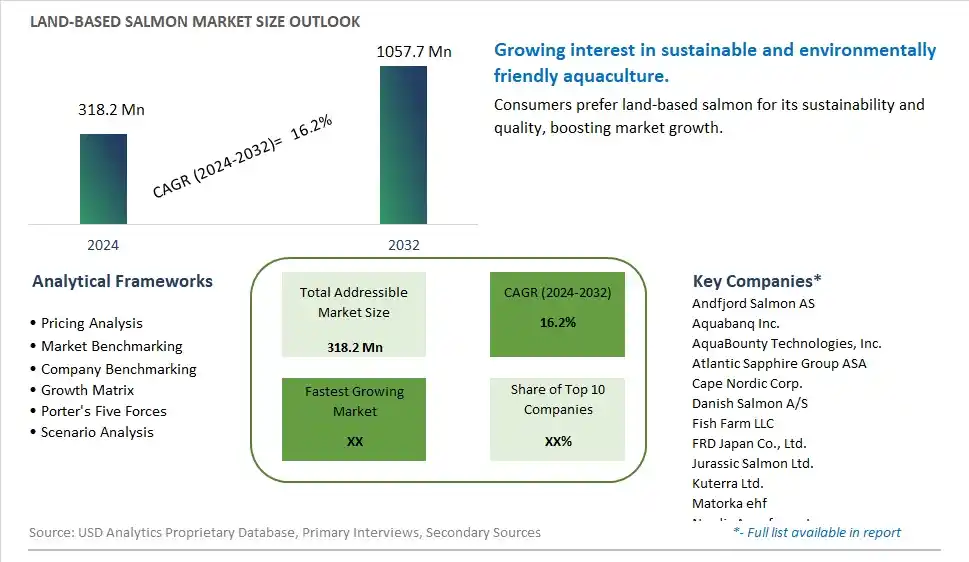
Global Land-Based Salmon Market Size is valued at $318.2 Million in 2024 and is forecast to register a growth rate (CAGR) of 16.2% to reach $1057.7 Million by 2032.
The global Land-Based Salmon Market Comprehensive Study analyzes and forecasts the market size across 6 regions and 24 countries for diverse segments -By Type (Atlantic Salmon, Chinook (Spring/King) Salmon, Coho (Silver) Salmon, Others), By Application (Fresh Salmon, Frozen Salmon, Smoked Salmon, Canned Salmon)
An Introduction to Land-Based Salmon Market
The Land-Based Salmon Market focuses on the production and sale of salmon raised in land-based aquaculture systems, which offer sustainable and controlled environments for fish farming. The market is driven by increasing demand for sustainable seafood, rising awareness about the environmental impact of traditional aquaculture, and growing consumer preference for high-quality and responsibly sourced fish. Additionally, advancements in aquaculture technologies and the expansion of land-based farming operations support market growth.
Land Based Salmon Competitive Landscape
The market report analyses the leading companies in the industry including Andfjord Salmon AS, Aquabanq Inc., AquaBounty Technologies, Inc., Atlantic Sapphire Group ASA, Cape Nordic Corp., Danish Salmon A/S, Fish Farm LLC, FRD Japan Co., Ltd., Jurassic Salmon Ltd., Kuterra Ltd., Matorka ehf, Nordic Aquafarms Inc., Pure Salmon, Samherji hf, Shandong Ocean Oriental Sci-Tech Co., Ltd., Superior Fresh LLC, Sustainable Blue Inc., Swiss Lachs AG, West Creek Aquaculture LLC, Whole Oceans LLC, and Others.
Land Based Salmon Market Dynamics
Land-Based Salmon Market Trend: Expansion of Sustainable Aquaculture
The most prominent trend in the Land-Based Salmon Market is the expansion of sustainable aquaculture practices. Land-based salmon farming, using recirculating aquaculture systems (RAS), is gaining traction as a sustainable alternative to traditional ocean-based fish farming. This trend is driven by growing concerns over environmental impacts, including ocean pollution, overfishing, and the spread of diseases in open waters.
Land-Based Salmon Market Driver: Demand for High-Quality and Traceable Seafood
A key driver in the Land-Based Salmon Market is the increasing demand for high-quality and traceable seafood. Consumers are becoming more aware of the origins and environmental impact of their food. Land-based salmon farms offer better control over the farming environment, leading to higher quality and more consistent products. This transparency and quality assurance are attracting health-conscious and environmentally aware consumers.
Land-Based Salmon Market Opportunity: Technological Advancements and Market Expansion
One significant opportunity in the Land-Based Salmon Market lies in technological advancements and market expansion. Innovations in RAS technology can improve efficiency, reduce costs, and enhance the sustainability of land-based salmon farming. Additionally, expanding into new geographic markets, particularly in regions with limited access to fresh seafood, presents significant growth potential. Companies that invest in these advancements and market strategies can capture a larger share of the growing demand for sustainable seafood.
Land-Based Salmon Market Share Analysis- Largest Segment by Type
The Atlantic Salmon segment is the largest in the Land-Based Salmon Market by type. This dominance is driven by the high consumer demand for Atlantic salmon, known for its mild flavor, tender texture, and high nutritional value, including omega-3 fatty acids. Atlantic salmon is widely farmed and considered a staple in both domestic and international markets, making it the most commercially viable and popular choice among consumers. The continuous innovation in land-based salmon farming techniques, including advanced aquaculture systems that ensure sustainable and high-quality production, enhances the appeal of Atlantic salmon. Additionally, the growing trend of health and wellness supports the significant market share of the Atlantic salmon segment, as consumers seek nutritious and sustainable seafood options. The extensive availability of Atlantic salmon in supermarkets, specialty seafood stores, and online platforms further boosts its accessibility to a broad consumer base. The strong consumer preference for versatile and healthy seafood options reinforces the dominant position of the Atlantic salmon segment in the market.
Land-Based Salmon Market Share Analysis- Fastest Growing Segment by Application
The Smoked Salmon segment is poised to grow the fastest in the Land-Based Salmon Market by application over the next five years. This rapid growth is driven by the increasing consumer demand for ready-to-eat and gourmet seafood options. Smoked salmon offers a unique flavor profile and is a popular choice for various culinary applications, including appetizers, sandwiches, salads, and gourmet dishes. The continuous innovation in smoked salmon production, including the use of advanced smoking techniques and diverse flavor infusions, enhances its appeal. Additionally, the growing trend of premiumization in the seafood market supports the fast growth of the smoked salmon segment, as consumers seek high-quality and luxurious seafood products. The expanding market for convenience foods and the increasing focus on providing ready-to-eat gourmet options further drive the demand for smoked salmon. The influence of culinary trends and the rising popularity of seafood-based dishes contribute to the rapid growth of the smoked salmon segment.
Land Based Salmon Market Segmentation
By Type
Atlantic Salmon
Chinook (Spring/King) Salmon
Coho (Silver) Salmon
Others
By Application
Fresh Salmon
Frozen Salmon
Smoked Salmon
Canned Salmon
Countries Analyzed
North America (US, Canada, Mexico)
Europe (Germany, UK, France, Spain, Italy, Russia, Rest of Europe)
Asia Pacific (China, India, Japan, South Korea, Australia, South East Asia, Rest of Asia)
South America (Brazil, Argentina, Rest of South America)
Middle East and Africa (Saudi Arabia, UAE, Rest of Middle East, South Africa, Egypt, Rest of Africa)
Land Based Salmon Companies Profiled in the Study
Andfjord Salmon AS
Aquabanq Inc.
AquaBounty Technologies, Inc.
Atlantic Sapphire Group ASA
Cape Nordic Corp.
Danish Salmon A/S
Fish Farm LLC
FRD Japan Co., Ltd.
Jurassic Salmon Ltd.
Kuterra Ltd.
Matorka ehf
Nordic Aquafarms Inc.
Pure Salmon
Samherji hf
Shandong Ocean Oriental Sci-Tech Co., Ltd.
Superior Fresh LLC
Sustainable Blue Inc.
Swiss Lachs AG
West Creek Aquaculture LLC
Whole Oceans LLC
*- List Not Exhaustive
Chapter 1. TABLE OF CONTENTS
Chapter 2. Introduction to Land Based Salmon Market
2.1. Market Overview
2.2. Key Statistics and Report Highlights
2.3. Scope of the Comprehensive Study
2.3.1. Market Definition
2.3.2 Countries and Regions Covered
2.3.3 Research Objective
2.3.4 Units, Currency, and Conversions
2.3.5 Industry Value Chain
2.4. Key Market Segments
2.5. Key Companies
2.6. Study Period
Chapter 3. Strategic Analysis Review
3.1. Land Based Salmon Pricing Analysis and Forecast
3.2. Porter’s Five Forces
3.3. Market Ecosystem
3.4. SWOT Analysis
3.5. Regulatory Scenario
3.3. Effects of Inflation, Russia-Ukraine War, moderating economic growth, and other macroeconomic factors
Chapter 4. Competitive Landscape
4.1. Market Share Analysis
4.1.1. Global Land Based Salmon Market Share by Company, 2023
4.1.2. Product Offerings of Leading Land Based Salmon Companies
4.2. Market Entropy
4.2.1. New Product Launches in the Industry
4.2.2. Mergers, Acquisitions, Joint ventures, and Partnerships
4.3. Key Strategies and Best Practices
Chapter 5. Global Market Projections: Best, Reference, and Low Case Scenarios
5.1. Growth Analysis- Case Scenario Definitions
5.2. Low Growth Case Scenario Forecasts
5.3. Reference Growth Case Scenario Forecasts
5.4. High Growth Case Scenario Forecasts
Chapter 6. Market Dynamics
6.1. Land Based Salmon Market Drivers
6.2. Land Based Salmon Market Challenges
6.6. Land Based Salmon Market Opportunities
6.4. Land Based Salmon Market Trends
Chapter 7. Global Land Based Salmon Market Outlook Trends
7.1. Global Land Based Salmon Revenue (USD Million) and CAGR (%) by Type (2021-2032)
7.2. Global Land Based Salmon Revenue (USD Million) and CAGR (%) by Application (2021-2032)
7.3. Global Land Based Salmon Revenue (USD Million) and CAGR (%) by Product (2021-2032)
By Type
Atlantic Salmon
Chinook (Spring/King) Salmon
Coho (Silver) Salmon
Others
By Application
Fresh Salmon
Frozen Salmon
Smoked Salmon
Canned Salmon
Chapter 8. Global Land Based Salmon Regional Analysis and Outlook
8.1. Global Land Based Salmon Revenue (USD Million) By Regions (2021- 2032)
8.2. North America Land Based Salmon Revenue (USD Million) by Country (2021-2032)
8.2.1. United States Land Based Salmon Regional Analysis and Outlook
8.2.2. Canada Land Based Salmon Regional Analysis and Outlook
8.2.3. Mexico Land Based Salmon Regional Analysis and Outlook
8.3. Europe Land Based Salmon Revenue (USD Million), by Country (2021-2032)
8.3.1. Germany Land Based Salmon Regional Analysis and Outlook
8.3.2. France Land Based Salmon Regional Analysis and Outlook
8.3.3. United Kingdom Land Based Salmon Regional Analysis and Outlook
8.3.4. Spain Land Based Salmon Regional Analysis and Outlook
8.3.5. Italy Land Based Salmon Regional Analysis and Outlook
8.3.6. Russia Land Based Salmon Regional Analysis and Outlook
8.3.7. Rest of Europe Land Based Salmon Regional Analysis and Outlook
8.4. Asia Pacific Land Based Salmon Revenue (USD Million) by Country (2021-2032)
8.4.1. China Land Based Salmon Regional Analysis and Outlook
8.4.2. Japan Land Based Salmon Regional Analysis and Outlook
8.4.3. India Land Based Salmon Regional Analysis and Outlook
8.4.4. South Korea Land Based Salmon Regional Analysis and Outlook
8.4.5. Australia Land Based Salmon Regional Analysis and Outlook
8.4.6. South East Asia Land Based Salmon Regional Analysis and Outlook
8.4.7. Rest of Asia Pacific Land Based Salmon Regional Analysis and Outlook
8.5. South America Land Based Salmon Revenue (USD Million), by Country (2021-2032)
8.5.1. Brazil Land Based Salmon Regional Analysis and Outlook
8.5.2. Argentina Land Based Salmon Regional Analysis and Outlook
8.5.3. Rest of South America Land Based Salmon Regional Analysis and Outlook
8.6. Middle East and Africa Land Based Salmon Revenue (USD Million) by Country (2021-2032)
8.6.1. Middle East Land Based Salmon Regional Analysis and Outlook
8.6.2. Africa Land Based Salmon Regional Analysis and Outlook
Chapter 9. North America Land Based Salmon Analysis and Outlook
9.1. North America Land Based Salmon Revenue (USD Million) by Segments (2021-2032)
9.1.1. North America Land Based Salmon Revenue (USD Million) by Type (2021-2032)
9.1.2. North America Land Based Salmon Revenue (USD Million) by Application (2021-2032)
9.1.3. North America Land Based Salmon Revenue (USD Million) by Product (2021-2032)
By Type
Atlantic Salmon
Chinook (Spring/King) Salmon
Coho (Silver) Salmon
Others
By Application
Fresh Salmon
Frozen Salmon
Smoked Salmon
Canned Salmon
Chapter 10. Europe Land Based Salmon Analysis and Outlook
10.1. Europe Land Based Salmon Revenue (USD Million), by Segments (USD Million) (2021-2032)
10.1.1. Europe Land Based Salmon Revenue (USD Million) by Type (2021-2032)
10.1.2. Europe Land Based Salmon Revenue (USD Million) by Application (2021-2032)
10.1.3. Europe Land Based Salmon Revenue (USD Million) by Product (2021-2032)
By Type
Atlantic Salmon
Chinook (Spring/King) Salmon
Coho (Silver) Salmon
Others
By Application
Fresh Salmon
Frozen Salmon
Smoked Salmon
Canned Salmon
Chapter 11. Asia Pacific Land Based Salmon Analysis and Outlook
11.1. Asia Pacific Land Based Salmon Revenue (USD Million), and Revenue (USD Million) by Segments (2021-2032)
11.1.1. Asia Pacific Land Based Salmon Revenue (USD Million) by Type (2021-2032)
11.1.2. Asia Pacific Land Based Salmon Revenue (USD Million) by Application (2021-2032)
11.1.3. Asia Pacific Land Based Salmon Revenue (USD Million) by Product (2021-2032)
By Type
Atlantic Salmon
Chinook (Spring/King) Salmon
Coho (Silver) Salmon
Others
By Application
Fresh Salmon
Frozen Salmon
Smoked Salmon
Canned Salmon
Chapter 12. South America Land Based Salmon Analysis and Outlook
12.1. South America Land Based Salmon Revenue (USD Million), by Segments (2021-2032)
12.1.1. South America Land Based Salmon Revenue (USD Million) by Type (2021-2032)
12.1.2. South America Land Based Salmon Revenue (USD Million) by Application (2021-2032)
12.1.3. South America Land Based Salmon Revenue (USD Million) by Product (2021-2032)
By Type
Atlantic Salmon
Chinook (Spring/King) Salmon
Coho (Silver) Salmon
Others
By Application
Fresh Salmon
Frozen Salmon
Smoked Salmon
Canned Salmon
Chapter 13. Middle East and Africa Land Based Salmon Analysis and Outlook
13.1. Middle East and Africa Land Based Salmon Revenue (USD Million), by Segments (2021-2032)
13.1.1. Middle East and Africa Land Based Salmon Revenue (USD Million) by Type (2021-2032)
13.1.2. Middle East and Africa Land Based Salmon Revenue (USD Million) by Application (2021-2032)
13.1.3. Middle East and Africa Land Based Salmon Revenue (USD Million) by Product (2021-2032)
By Type
Atlantic Salmon
Chinook (Spring/King) Salmon
Coho (Silver) Salmon
Others
By Application
Fresh Salmon
Frozen Salmon
Smoked Salmon
Canned Salmon
Chapter 14. Land Based Salmon Company Profiles
14.1 Business Overview
14.2 Product Profiles
14.3 SWOT Profiles
14.5 Recent Developments
14.6 Financial Profile
List of Companies
Andfjord Salmon AS
Aquabanq Inc.
AquaBounty Technologies, Inc.
Atlantic Sapphire Group ASA
Cape Nordic Corp.
Danish Salmon A/S
Fish Farm LLC
FRD Japan Co., Ltd.
Jurassic Salmon Ltd.
Kuterra Ltd.
Matorka ehf
Nordic Aquafarms Inc.
Pure Salmon
Samherji hf
Shandong Ocean Oriental Sci-Tech Co., Ltd.
Superior Fresh LLC
Sustainable Blue Inc.
Swiss Lachs AG
West Creek Aquaculture LLC
Whole Oceans LLC
15. Methodology and Data Sources
15.1 Customization Offerings
15.2 Subscription Services
15.3 Related Reports
15.4 Publisher Expertise
LIST OF TABLES
Table 1 Market Segmentation Analysis
Table 2 Global Land Based Salmon Market Share of Leading Companies, 2023
Table 3 Product Offerings of Leading Companies
Table 4 Low Growth Scenario Forecasts
Table 5 Reference Case Growth Scenario
Table 6 High Growth Case Scenario
Table 7 Global Land Based Salmon Revenue (USD Million) And CAGR (%) By Type (2021-2032)
Table 8 Global Land Based Salmon Revenue (USD Million) And CAGR (%) By Application (2021-2032)
Table 9 Global Land Based Salmon Revenue (USD Million) And CAGR (%) By Product (2021-2032)
Table 10 Global Land Based Salmon Market Revenue (USD Million) By Regions (2021-2032)
Table 11 Global Land Based Salmon Market Share (%) By Regions (2021-2032)
Table 12 North America Land Based Salmon Revenue (USD Million) By Country (2021-2032)
Table 13 Europe Land Based Salmon Revenue (USD Million) By Country (2021-2032)
Table 14 Asia Pacific Land Based Salmon Revenue (USD Million) By Country (2021-2032)
Table 15 South America Land Based Salmon Revenue (USD Million) By Country (2021-2032)
Table 16 Middle East and Africa Land Based Salmon Revenue (USD Million) By Region (2021-2032)
Table 17 North America Land Based Salmon Revenue (USD Million) By Type (2021-2032)
Table 18 North America Land Based Salmon Revenue (USD Million) By Application (2021-2032)
Table 19 North America Land Based Salmon Revenue (USD Million) By Product (2021-2032)
Table 20 Europe Land Based Salmon Revenue (USD Million) By Type (2021-2032)
Table 21 Europe Land Based Salmon Revenue (USD Million) By Application (2021-2032)
Table 22 Europe Land Based Salmon Revenue (USD Million) By Product (2021-2032)
Table 23 Asia Pacific Land Based Salmon Revenue (USD Million) By Type (2021-2032)
Table 24 Asia Pacific Land Based Salmon Revenue (USD Million) By Application (2021-2032)
Table 25 Asia Pacific Land Based Salmon Revenue (USD Million) By Product (2021-2032)
Table 26 South America Land Based Salmon Revenue (USD Million) By Type (2021-2032)
Table 27 South America Land Based Salmon Revenue (USD Million) By Application (2021-2032)
Table 28 South America Land Based Salmon Revenue (USD Million) By Product (2021-2032)
Table 29 Middle East and Africa Land Based Salmon Revenue (USD Million) By Type (2021-2032)
Table 30 Middle East and Africa Land Based Salmon Revenue (USD Million) By Application (2021-2032)
Table 31 Middle East and Africa Land Based Salmon Revenue (USD Million) By Product (2021-2032)
LIST OF FIGURES
Figure 1. Market Scope
Figure 2. Pricing Forecasts Per Unit, 2023- 2032
Figure 3. Porter’s Five Forces
Figure 4. Global Land Based Salmon Market Revenue (USD Million) By Regions (2021-2032)
Figure 5. Global Land Based Salmon Market Share (%) By Regions (2023)
Figure 6. North America Land Based Salmon Revenue (USD Million) By Country (2021-2032)
Figure 7. United States Land Based Salmon Revenue (USD Million) By Country (2021-2032)
Figure 8. Canada Land Based Salmon Revenue (USD Million) By Country (2021-2032)
Figure 9. Mexico Land Based Salmon Revenue (USD Million) By Country (2021-2032)
Figure 10. Europe Land Based Salmon Revenue (USD Million) By Country (2021-2032)
Figure 11. Germany Land Based Salmon Revenue (USD Million) By Country (2021-2032)
Figure 12. France Land Based Salmon Revenue (USD Million) By Country (2021-2032)
Figure 13. United Kingdom Land Based Salmon Revenue (USD Million) By Country (2021-2032)
Figure 14. Spain Land Based Salmon Revenue (USD Million) By Country (2021-2032)
Figure 15. Italy Land Based Salmon Revenue (USD Million) By Country (2021-2032)
Figure 16. Russia Land Based Salmon Revenue (USD Million) By Country (2021-2032)
Figure 17. Rest of Europe Land Based Salmon Revenue (USD Million) By Country (2021-2032)
Figure 11. Asia Pacific Land Based Salmon Revenue (USD Million) By Country (2021-2032)
Figure 12. China Land Based Salmon Revenue (USD Million) By Country (2021-2032)
Figure 13. Japan Land Based Salmon Revenue (USD Million) By Country (2021-2032)
Figure 14. India Land Based Salmon Revenue (USD Million) By Country (2021-2032)
Figure 15. South Korea Land Based Salmon Revenue (USD Million) By Country (2021-2032)
Figure 16. Australia Land Based Salmon Revenue (USD Million) By Country (2021-2032)
Figure 17. South East Asia Land Based Salmon Revenue (USD Million) By Country (2021-2032)
Figure 18. South America Land Based Salmon Revenue (USD Million) By Country (2021-2032)
Figure 19. Brazil Land Based Salmon Revenue (USD Million) By Country (2021-2032)
Figure 20. Argentina Land Based Salmon Revenue (USD Million) By Country (2021-2032)
Figure 21. Rest of Asia Pacific Land Based Salmon Revenue (USD Million) By Country (2021-2032)
Figure 22. Middle East and Africa Land Based Salmon Revenue (USD Million) By Region (2021-2032)
Figure 23. Saudi Arabia Land Based Salmon Revenue (USD Million) By Region (2021-2032)
Figure 24. The UAE Land Based Salmon Revenue (USD Million) By Region (2021-2032)
Figure 25. Rest of Middle East Land Based Salmon Revenue (USD Million) By Region (2021-2032)
Figure 26. South Africa Land Based Salmon Revenue (USD Million) By Region (2021-2032)
Figure 27. Africa Land Based Salmon Revenue (USD Million) By Region (2021-2032)
Figure 28. North America Land Based Salmon Revenue (USD Million) By Type (2021-2032)
Figure 29. North America Land Based Salmon Revenue (USD Million) By Application (2021-2032)
Figure 30. North America Land Based Salmon Revenue (USD Million) By Product (2021-2032)
Figure 31. Europe Land Based Salmon Revenue (USD Million) By Type (2021-2032)
Figure 32. Europe Land Based Salmon Revenue (USD Million) By Application (2021-2032)
Figure 33. Europe Land Based Salmon Revenue (USD Million) By Product (2021-2032)
Figure 34. Asia Pacific Land Based Salmon Revenue (USD Million) By Type (2021-2032)
Figure 35. Asia Pacific Land Based Salmon Revenue (USD Million) By Application (2021-2032)
Figure 36. Asia Pacific Land Based Salmon Revenue (USD Million) By Product (2021-2032)
Figure 37. South America Land Based Salmon Revenue (USD Million) By Type (2021-2032)
Figure 38. South America Land Based Salmon Revenue (USD Million) By Application (2021-2032)
Figure 39. South America Land Based Salmon Revenue (USD Million) By Product (2021-2032)
Figure 40. Middle East and Africa Land Based Salmon Revenue (USD Million) By Type (2021-2032)
Figure 41. Middle East and Africa Land Based Salmon Revenue (USD Million) By Application (2021-2032)
Figure 42. Middle East and Africa Land Based Salmon Revenue (USD Million) By Product (2021-2032)
By Type
Atlantic Salmon
Chinook (Spring/King) Salmon
Coho (Silver) Salmon
Others
By Application
Fresh Salmon
Frozen Salmon
Smoked Salmon
Canned Salmon
Countries Analyzed
North America (US, Canada, Mexico)
Europe (Germany, UK, France, Spain, Italy, Russia, Rest of Europe)
Asia Pacific (China, India, Japan, South Korea, Australia, South East Asia, Rest of Asia)
South America (Brazil, Argentina, Rest of South America)
Middle East and Africa (Saudi Arabia, UAE, Rest of Middle East, South Africa, Egypt, Rest of Africa)
