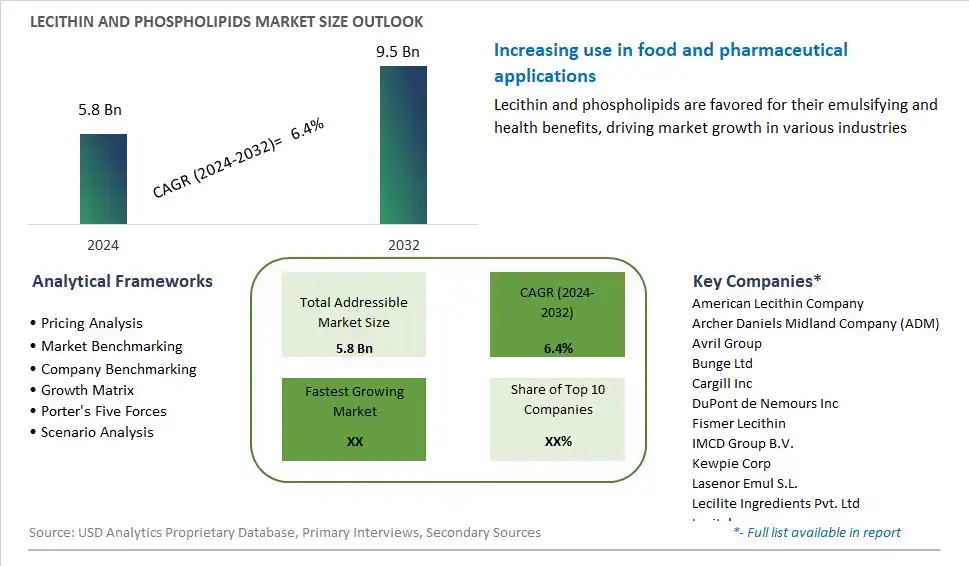
Global Lecithin and Phospholipids Market Size is valued at $5.8 Billion in 2024 and is forecast to register a growth rate (CAGR) of 6.4% to reach $9.5 Billion by 2032.
The global Lecithin and Phospholipids Market Comprehensive Study analyzes and forecasts the market size across 6 regions and 24 countries for diverse segments -By Source (Soy, Sunflower, Rapeseed & canola, Egg, Others), By Type (Fluid, De-oiled, Modified), By Nature (GMO, Non-GMO), By Application (Food & beverages, Feed, Industrial, Healthcare)
An Introduction to Lecithin and Phospholipids Market
Lecithin and phospholipids are naturally occurring compounds found in various plant and animal sources, used in the food and pharmaceutical industries as emulsifiers, stabilizers, and nutritional supplements in 2024. Lecithin is a complex mixture of phospholipids, glycolipids, and triglycerides extracted from sources such as soybeans, sunflower seeds, and egg yolks, while phospholipids are a class of lipids comprising a hydrophilic head and hydrophobic tail, found in cell membranes and biological fluids. These compounds play a crucial role in food formulation and processing, improving the stability, texture, and sensory properties of food products such as chocolate, baked goods, margarine, and salad dressings. In the pharmaceutical industry, lecithin and phospholipids are used as excipients in drug delivery systems, nutritional supplements, and cosmetic formulations due to their biocompatibility and emulsifying properties. With advancements in extraction technology, purification methods, and ingredient functionality, manufacturers can produce lecithin and phospholipids with enhanced performance, purity, and versatility, meeting the diverse needs of food, pharmaceutical, and cosmetic industries worldwide. As consumer demand for natural, clean-label ingredients and functional products grows, the market for lecithin and phospholipids is expected to expand, driven by innovations in sourcing, processing, and formulation that deliver safe, effective, and sustainable solutions to meet market demands and regulatory requirements.
Lecithin and Phospholipids Competitive Landscape
The market report analyses the leading companies in the industry including American Lecithin Company, Archer Daniels Midland Company (ADM), Avril Group, Bunge Ltd, Cargill Inc, DuPont de Nemours Inc, Fismer Lecithin, IMCD Group B.V., Kewpie Corp, Lasenor Emul S.L., Lecilite Ingredients Pvt. Ltd, Lecital, Lipoid GmbH, Sime DarBy Oils, Sodrugestvo Group, Sonic Biochem, STERN-WYWIOL GRUPPE, Sun Nutrafoods, VAV Life Sciences Pvt. Ltd, Wilmar International Ltd, and Others.
Lecithin and Phospholipids Market Dynamics
Lecithin and Phospholipids Market Trend: Rising Demand for Natural and Functional Ingredients
The market trend for lecithin and phospholipids is characterized by the rising demand for natural and functional ingredients in various industries, including food and beverage, pharmaceuticals, cosmetics, and dietary supplements. Lecithin and phospholipids, derived from sources such as soybeans, sunflower seeds, and eggs, are valued for their emulsifying, stabilizing, and texturizing properties, making them essential additives in numerous applications. This trend is driven by consumer preferences for clean label products and the growing awareness of the health benefits associated with natural ingredients. Additionally, the functional properties of lecithin and phospholipids, such as their role in supporting cognitive health, liver function, and cardiovascular health, further contribute to their increasing utilization across diverse sectors.
Market Driver: Growth in Processed Food Industry and Functional Nutrition
A key driver propelling the market for lecithin and phospholipids is the growth in the processed food industry and the rising demand for functional nutrition products. As the global population continues to urbanize and lead busy lifestyles, there's a growing reliance on convenient and processed foods that require emulsifiers and stabilizers to maintain quality and shelf life. Lecithin and phospholipids serve as versatile ingredients in processed foods, including baked goods, confectionery, dairy products, and convenience foods, contributing to texture enhancement, fat reduction, and flavor encapsulation. Furthermore, the expanding market for functional foods and dietary supplements targeting specific health concerns, such as brain health, heart health, and weight management, drives the demand for phospholipid-rich formulations with bioactive properties. As a result, manufacturers are increasingly incorporating lecithin and phospholipids into their product formulations to meet consumer demands for both convenience and health.
Market Opportunity: Innovation in Specialty Applications and Nutraceuticals
An opportunity within the lecithin and phospholipids market lies in innovation in specialty applications and nutraceutical formulations to address evolving consumer preferences and market trends. While lecithin is widely used as an emulsifier and surfactant in food and industrial applications, there's potential for diversification into niche sectors such as cosmetics, pharmaceuticals, and animal nutrition. Phospholipids, particularly those derived from marine sources such as krill oil, offer unique bioactive properties and health benefits, presenting opportunities for the development of premium nutraceutical products targeting specific health conditions. Additionally, technological advancements in extraction and purification processes enable the production of high-quality lecithin and phospholipid ingredients with enhanced functionality and bioavailability, paving the way for innovation in value-added formulations. By leveraging these opportunities for innovation and differentiation, stakeholders in the lecithin and phospholipids market can expand their product portfolios and capture new market segments, driving growth and competitiveness in the global marketplace.
Lecithin and Phospholipids Market Share Analysis: Soy held the dominant market share in 2024
Within the diverse range of sources in the lecithin and phospholipids market, soy is the largest segment, driven by its widespread availability, versatility, and cost-effectiveness. Soy-based lecithin and phospholipids are derived from soybeans, one of the most abundant and widely cultivated oilseed crops globally. The dominance of soy in the market is attributed to its high lecithin content and the efficiency of soybean processing methods, which yield substantial quantities of lecithin and phospholipids as co-products. Further, soy lecithin and phospholipids find extensive applications across various industries, including food and beverages, pharmaceuticals, cosmetics, and animal feed, owing to their emulsifying, stabilizing, and nutritional properties. Additionally, soy-derived lecithin is favored by manufacturers and consumers alike due to its non-GMO status and allergen-friendly profile, further bolstering its market dominance. As industries continue to seek natural and sustainable ingredients, the demand for soy-based lecithin and phospholipids is expected to remain robust, solidifying its position as the leading segment in the market.
Lecithin and Phospholipids Market Segmentation
By Source
Soy
Sunflower
Rapeseed & canola
Egg
Others
By Type
Fluid
De-oiled
Modified
By Nature
GMO
Non-GMO
By Application
Food & beverages
-Bakery products
-Convenience foods
-Confectioneries
-Others
Feed
Industrial
Healthcare
Countries Analyzed
North America (US, Canada, Mexico)
Europe (Germany, UK, France, Spain, Italy, Russia, Rest of Europe)
Asia Pacific (China, India, Japan, South Korea, Australia, South East Asia, Rest of Asia)
South America (Brazil, Argentina, Rest of South America)
Middle East and Africa (Saudi Arabia, UAE, Rest of Middle East, South Africa, Egypt, Rest of Africa)
Lecithin and Phospholipids Companies Profiled in the Study
American Lecithin Company
Archer Daniels Midland Company (ADM)
Avril Group
Bunge Ltd
Cargill Inc
DuPont de Nemours Inc
Fismer Lecithin
IMCD Group B.V.
Kewpie Corp
Lasenor Emul S.L.
Lecilite Ingredients Pvt. Ltd
Lecital
Lipoid GmbH
Sime DarBy Oils
Sodrugestvo Group
Sonic Biochem
STERN-WYWIOL GRUPPE
Sun Nutrafoods
VAV Life Sciences Pvt. Ltd
Wilmar International Ltd
*- List Not Exhaustive
Chapter 1. TABLE OF CONTENTS
Chapter 2. Introduction to Lecithin and Phospholipids Market
2.1. Market Overview
2.2. Key Statistics and Report Highlights
2.3. Scope of the Comprehensive Study
2.3.1. Market Definition
2.3.2 Countries and Regions Covered
2.3.3 Research Objective
2.3.4 Units, Currency, and Conversions
2.3.5 Industry Value Chain
2.4. Key Market Segments
2.5. Key Companies
2.6. Study Period
Chapter 3. Strategic Analysis Review
3.1. Lecithin and Phospholipids Pricing Analysis and Forecast
3.2. Porter’s Five Forces
3.3. Market Ecosystem
3.4. SWOT Analysis
3.5. Regulatory Scenario
3.3. Effects of Inflation, Russia-Ukraine War, moderating economic growth, and other macroeconomic factors
Chapter 4. Competitive Landscape
4.1. Market Share Analysis
4.1.1. Global Lecithin and Phospholipids Market Share by Company, 2023
4.1.2. Product Offerings of Leading Lecithin and Phospholipids Companies
4.2. Market Entropy
4.2.1. New Product Launches in the Industry
4.2.2. Mergers, Acquisitions, Joint ventures, and Partnerships
4.3. Key Strategies and Best Practices
Chapter 5. Global Market Projections: Best, Reference, and Low Case Scenarios
5.1. Growth Analysis- Case Scenario Definitions
5.2. Low Growth Case Scenario Forecasts
5.3. Reference Growth Case Scenario Forecasts
5.4. High Growth Case Scenario Forecasts
Chapter 6. Market Dynamics
6.1. Lecithin and Phospholipids Market Drivers
6.2. Lecithin and Phospholipids Market Challenges
6.6. Lecithin and Phospholipids Market Opportunities
6.4. Lecithin and Phospholipids Market Trends
Chapter 7. Global Lecithin and Phospholipids Market Outlook Trends
7.1. Global Lecithin and Phospholipids Revenue (USD Million) and CAGR (%) by Type (2021-2032)
7.2. Global Lecithin and Phospholipids Revenue (USD Million) and CAGR (%) by Application (2021-2032)
7.3. Global Lecithin and Phospholipids Revenue (USD Million) and CAGR (%) by Product (2021-2032)
By Source
Soy
Sunflower
Rapeseed & canola
Egg
Others
By Type
Fluid
De-oiled
Modified
By Nature
GMO
Non-GMO
By Application
Food & beverages
-Bakery products
-Convenience foods
-Confectioneries
-Others
Feed
Industrial
Healthcare
Chapter 8. Global Lecithin and Phospholipids Regional Analysis and Outlook
8.1. Global Lecithin and Phospholipids Revenue (USD Million) By Regions (2021- 2032)
8.2. North America Lecithin and Phospholipids Revenue (USD Million) by Country (2021-2032)
8.2.1. United States Lecithin and Phospholipids Regional Analysis and Outlook
8.2.2. Canada Lecithin and Phospholipids Regional Analysis and Outlook
8.2.3. Mexico Lecithin and Phospholipids Regional Analysis and Outlook
8.3. Europe Lecithin and Phospholipids Revenue (USD Million), by Country (2021-2032)
8.3.1. Germany Lecithin and Phospholipids Regional Analysis and Outlook
8.3.2. France Lecithin and Phospholipids Regional Analysis and Outlook
8.3.3. United Kingdom Lecithin and Phospholipids Regional Analysis and Outlook
8.3.4. Spain Lecithin and Phospholipids Regional Analysis and Outlook
8.3.5. Italy Lecithin and Phospholipids Regional Analysis and Outlook
8.3.6. Russia Lecithin and Phospholipids Regional Analysis and Outlook
8.3.7. Rest of Europe Lecithin and Phospholipids Regional Analysis and Outlook
8.4. Asia Pacific Lecithin and Phospholipids Revenue (USD Million) by Country (2021-2032)
8.4.1. China Lecithin and Phospholipids Regional Analysis and Outlook
8.4.2. Japan Lecithin and Phospholipids Regional Analysis and Outlook
8.4.3. India Lecithin and Phospholipids Regional Analysis and Outlook
8.4.4. South Korea Lecithin and Phospholipids Regional Analysis and Outlook
8.4.5. Australia Lecithin and Phospholipids Regional Analysis and Outlook
8.4.6. South East Asia Lecithin and Phospholipids Regional Analysis and Outlook
8.4.7. Rest of Asia Pacific Lecithin and Phospholipids Regional Analysis and Outlook
8.5. South America Lecithin and Phospholipids Revenue (USD Million), by Country (2021-2032)
8.5.1. Brazil Lecithin and Phospholipids Regional Analysis and Outlook
8.5.2. Argentina Lecithin and Phospholipids Regional Analysis and Outlook
8.5.3. Rest of South America Lecithin and Phospholipids Regional Analysis and Outlook
8.6. Middle East and Africa Lecithin and Phospholipids Revenue (USD Million) by Country (2021-2032)
8.6.1. Middle East Lecithin and Phospholipids Regional Analysis and Outlook
8.6.2. Africa Lecithin and Phospholipids Regional Analysis and Outlook
Chapter 9. North America Lecithin and Phospholipids Analysis and Outlook
9.1. North America Lecithin and Phospholipids Revenue (USD Million) by Segments (2021-2032)
9.1.1. North America Lecithin and Phospholipids Revenue (USD Million) by Type (2021-2032)
9.1.2. North America Lecithin and Phospholipids Revenue (USD Million) by Application (2021-2032)
9.1.3. North America Lecithin and Phospholipids Revenue (USD Million) by Product (2021-2032)
By Source
Soy
Sunflower
Rapeseed & canola
Egg
Others
By Type
Fluid
De-oiled
Modified
By Nature
GMO
Non-GMO
By Application
Food & beverages
-Bakery products
-Convenience foods
-Confectioneries
-Others
Feed
Industrial
Healthcare
Chapter 10. Europe Lecithin and Phospholipids Analysis and Outlook
10.1. Europe Lecithin and Phospholipids Revenue (USD Million), by Segments (USD Million) (2021-2032)
10.1.1. Europe Lecithin and Phospholipids Revenue (USD Million) by Type (2021-2032)
10.1.2. Europe Lecithin and Phospholipids Revenue (USD Million) by Application (2021-2032)
10.1.3. Europe Lecithin and Phospholipids Revenue (USD Million) by Product (2021-2032)
By Source
Soy
Sunflower
Rapeseed & canola
Egg
Others
By Type
Fluid
De-oiled
Modified
By Nature
GMO
Non-GMO
By Application
Food & beverages
-Bakery products
-Convenience foods
-Confectioneries
-Others
Feed
Industrial
Healthcare
Chapter 11. Asia Pacific Lecithin and Phospholipids Analysis and Outlook
11.1. Asia Pacific Lecithin and Phospholipids Revenue (USD Million), and Revenue (USD Million) by Segments (2021-2032)
11.1.1. Asia Pacific Lecithin and Phospholipids Revenue (USD Million) by Type (2021-2032)
11.1.2. Asia Pacific Lecithin and Phospholipids Revenue (USD Million) by Application (2021-2032)
11.1.3. Asia Pacific Lecithin and Phospholipids Revenue (USD Million) by Product (2021-2032)
By Source
Soy
Sunflower
Rapeseed & canola
Egg
Others
By Type
Fluid
De-oiled
Modified
By Nature
GMO
Non-GMO
By Application
Food & beverages
-Bakery products
-Convenience foods
-Confectioneries
-Others
Feed
Industrial
Healthcare
Chapter 12. South America Lecithin and Phospholipids Analysis and Outlook
12.1. South America Lecithin and Phospholipids Revenue (USD Million), by Segments (2021-2032)
12.1.1. South America Lecithin and Phospholipids Revenue (USD Million) by Type (2021-2032)
12.1.2. South America Lecithin and Phospholipids Revenue (USD Million) by Application (2021-2032)
12.1.3. South America Lecithin and Phospholipids Revenue (USD Million) by Product (2021-2032)
By Source
Soy
Sunflower
Rapeseed & canola
Egg
Others
By Type
Fluid
De-oiled
Modified
By Nature
GMO
Non-GMO
By Application
Food & beverages
-Bakery products
-Convenience foods
-Confectioneries
-Others
Feed
Industrial
Healthcare
Chapter 13. Middle East and Africa Lecithin and Phospholipids Analysis and Outlook
13.1. Middle East and Africa Lecithin and Phospholipids Revenue (USD Million), by Segments (2021-2032)
13.1.1. Middle East and Africa Lecithin and Phospholipids Revenue (USD Million) by Type (2021-2032)
13.1.2. Middle East and Africa Lecithin and Phospholipids Revenue (USD Million) by Application (2021-2032)
13.1.3. Middle East and Africa Lecithin and Phospholipids Revenue (USD Million) by Product (2021-2032)
By Source
Soy
Sunflower
Rapeseed & canola
Egg
Others
By Type
Fluid
De-oiled
Modified
By Nature
GMO
Non-GMO
By Application
Food & beverages
-Bakery products
-Convenience foods
-Confectioneries
-Others
Feed
Industrial
Healthcare
Chapter 14. Lecithin and Phospholipids Company Profiles
14.1 Business Overview
14.2 Product Profiles
14.3 SWOT Profiles
14.5 Recent Developments
14.6 Financial Profile
List of Companies
American Lecithin Company
Archer Daniels Midland Company (ADM)
Avril Group
Bunge Ltd
Cargill Inc
DuPont de Nemours Inc
Fismer Lecithin
IMCD Group B.V.
Kewpie Corp
Lasenor Emul S.L.
Lecilite Ingredients Pvt. Ltd
Lecital
Lipoid GmbH
Sime DarBy Oils
Sodrugestvo Group
Sonic Biochem
STERN-WYWIOL GRUPPE
Sun Nutrafoods
VAV Life Sciences Pvt. Ltd
Wilmar International Ltd
15. Methodology and Data Sources
15.1 Customization Offerings
15.2 Subscription Services
15.3 Related Reports
15.4 Publisher Expertise
LIST OF TABLES
Table 1 Market Segmentation Analysis
Table 2 Global Lecithin and Phospholipids Market Share of Leading Companies, 2023
Table 3 Product Offerings of Leading Companies
Table 4 Low Growth Scenario Forecasts
Table 5 Reference Case Growth Scenario
Table 6 High Growth Case Scenario
Table 7 Global Lecithin and Phospholipids Revenue (USD Million) And CAGR (%) By Type (2021-2032)
Table 8 Global Lecithin and Phospholipids Revenue (USD Million) And CAGR (%) By Application (2021-2032)
Table 9 Global Lecithin and Phospholipids Revenue (USD Million) And CAGR (%) By Product (2021-2032)
Table 10 Global Lecithin and Phospholipids Market Revenue (USD Million) By Regions (2021-2032)
Table 11 Global Lecithin and Phospholipids Market Share (%) By Regions (2021-2032)
Table 12 North America Lecithin and Phospholipids Revenue (USD Million) By Country (2021-2032)
Table 13 Europe Lecithin and Phospholipids Revenue (USD Million) By Country (2021-2032)
Table 14 Asia Pacific Lecithin and Phospholipids Revenue (USD Million) By Country (2021-2032)
Table 15 South America Lecithin and Phospholipids Revenue (USD Million) By Country (2021-2032)
Table 16 Middle East and Africa Lecithin and Phospholipids Revenue (USD Million) By Region (2021-2032)
Table 17 North America Lecithin and Phospholipids Revenue (USD Million) By Type (2021-2032)
Table 18 North America Lecithin and Phospholipids Revenue (USD Million) By Application (2021-2032)
Table 19 North America Lecithin and Phospholipids Revenue (USD Million) By Product (2021-2032)
Table 20 Europe Lecithin and Phospholipids Revenue (USD Million) By Type (2021-2032)
Table 21 Europe Lecithin and Phospholipids Revenue (USD Million) By Application (2021-2032)
Table 22 Europe Lecithin and Phospholipids Revenue (USD Million) By Product (2021-2032)
Table 23 Asia Pacific Lecithin and Phospholipids Revenue (USD Million) By Type (2021-2032)
Table 24 Asia Pacific Lecithin and Phospholipids Revenue (USD Million) By Application (2021-2032)
Table 25 Asia Pacific Lecithin and Phospholipids Revenue (USD Million) By Product (2021-2032)
Table 26 South America Lecithin and Phospholipids Revenue (USD Million) By Type (2021-2032)
Table 27 South America Lecithin and Phospholipids Revenue (USD Million) By Application (2021-2032)
Table 28 South America Lecithin and Phospholipids Revenue (USD Million) By Product (2021-2032)
Table 29 Middle East and Africa Lecithin and Phospholipids Revenue (USD Million) By Type (2021-2032)
Table 30 Middle East and Africa Lecithin and Phospholipids Revenue (USD Million) By Application (2021-2032)
Table 31 Middle East and Africa Lecithin and Phospholipids Revenue (USD Million) By Product (2021-2032)
LIST OF FIGURES
Figure 1. Market Scope
Figure 2. Pricing Forecasts Per Unit, 2023- 2032
Figure 3. Porter’s Five Forces
Figure 4. Global Lecithin and Phospholipids Market Revenue (USD Million) By Regions (2021-2032)
Figure 5. Global Lecithin and Phospholipids Market Share (%) By Regions (2023)
Figure 6. North America Lecithin and Phospholipids Revenue (USD Million) By Country (2021-2032)
Figure 7. United States Lecithin and Phospholipids Revenue (USD Million) By Country (2021-2032)
Figure 8. Canada Lecithin and Phospholipids Revenue (USD Million) By Country (2021-2032)
Figure 9. Mexico Lecithin and Phospholipids Revenue (USD Million) By Country (2021-2032)
Figure 10. Europe Lecithin and Phospholipids Revenue (USD Million) By Country (2021-2032)
Figure 11. Germany Lecithin and Phospholipids Revenue (USD Million) By Country (2021-2032)
Figure 12. France Lecithin and Phospholipids Revenue (USD Million) By Country (2021-2032)
Figure 13. United Kingdom Lecithin and Phospholipids Revenue (USD Million) By Country (2021-2032)
Figure 14. Spain Lecithin and Phospholipids Revenue (USD Million) By Country (2021-2032)
Figure 15. Italy Lecithin and Phospholipids Revenue (USD Million) By Country (2021-2032)
Figure 16. Russia Lecithin and Phospholipids Revenue (USD Million) By Country (2021-2032)
Figure 17. Rest of Europe Lecithin and Phospholipids Revenue (USD Million) By Country (2021-2032)
Figure 11. Asia Pacific Lecithin and Phospholipids Revenue (USD Million) By Country (2021-2032)
Figure 12. China Lecithin and Phospholipids Revenue (USD Million) By Country (2021-2032)
Figure 13. Japan Lecithin and Phospholipids Revenue (USD Million) By Country (2021-2032)
Figure 14. India Lecithin and Phospholipids Revenue (USD Million) By Country (2021-2032)
Figure 15. South Korea Lecithin and Phospholipids Revenue (USD Million) By Country (2021-2032)
Figure 16. Australia Lecithin and Phospholipids Revenue (USD Million) By Country (2021-2032)
Figure 17. South East Asia Lecithin and Phospholipids Revenue (USD Million) By Country (2021-2032)
Figure 18. South America Lecithin and Phospholipids Revenue (USD Million) By Country (2021-2032)
Figure 19. Brazil Lecithin and Phospholipids Revenue (USD Million) By Country (2021-2032)
Figure 20. Argentina Lecithin and Phospholipids Revenue (USD Million) By Country (2021-2032)
Figure 21. Rest of Asia Pacific Lecithin and Phospholipids Revenue (USD Million) By Country (2021-2032)
Figure 22. Middle East and Africa Lecithin and Phospholipids Revenue (USD Million) By Region (2021-2032)
Figure 23. Saudi Arabia Lecithin and Phospholipids Revenue (USD Million) By Region (2021-2032)
Figure 24. The UAE Lecithin and Phospholipids Revenue (USD Million) By Region (2021-2032)
Figure 25. Rest of Middle East Lecithin and Phospholipids Revenue (USD Million) By Region (2021-2032)
Figure 26. South Africa Lecithin and Phospholipids Revenue (USD Million) By Region (2021-2032)
Figure 27. Africa Lecithin and Phospholipids Revenue (USD Million) By Region (2021-2032)
Figure 28. North America Lecithin and Phospholipids Revenue (USD Million) By Type (2021-2032)
Figure 29. North America Lecithin and Phospholipids Revenue (USD Million) By Application (2021-2032)
Figure 30. North America Lecithin and Phospholipids Revenue (USD Million) By Product (2021-2032)
Figure 31. Europe Lecithin and Phospholipids Revenue (USD Million) By Type (2021-2032)
Figure 32. Europe Lecithin and Phospholipids Revenue (USD Million) By Application (2021-2032)
Figure 33. Europe Lecithin and Phospholipids Revenue (USD Million) By Product (2021-2032)
Figure 34. Asia Pacific Lecithin and Phospholipids Revenue (USD Million) By Type (2021-2032)
Figure 35. Asia Pacific Lecithin and Phospholipids Revenue (USD Million) By Application (2021-2032)
Figure 36. Asia Pacific Lecithin and Phospholipids Revenue (USD Million) By Product (2021-2032)
Figure 37. South America Lecithin and Phospholipids Revenue (USD Million) By Type (2021-2032)
Figure 38. South America Lecithin and Phospholipids Revenue (USD Million) By Application (2021-2032)
Figure 39. South America Lecithin and Phospholipids Revenue (USD Million) By Product (2021-2032)
Figure 40. Middle East and Africa Lecithin and Phospholipids Revenue (USD Million) By Type (2021-2032)
Figure 41. Middle East and Africa Lecithin and Phospholipids Revenue (USD Million) By Application (2021-2032)
Figure 42. Middle East and Africa Lecithin and Phospholipids Revenue (USD Million) By Product (2021-2032)
By Source
Soy
Sunflower
Rapeseed & canola
Egg
Others
By Type
Fluid
De-oiled
Modified
By Nature
GMO
Non-GMO
By Application
Food & beverages
-Bakery products
-Convenience foods
-Confectioneries
-Others
Feed
Industrial
Healthcare
Countries Analyzed
North America (US, Canada, Mexico)
Europe (Germany, UK, France, Spain, Italy, Russia, Rest of Europe)
Asia Pacific (China, India, Japan, South Korea, Australia, South East Asia, Rest of Asia)
South America (Brazil, Argentina, Rest of South America)
Middle East and Africa (Saudi Arabia, UAE, Rest of Middle East, South Africa, Egypt, Rest of Africa)
