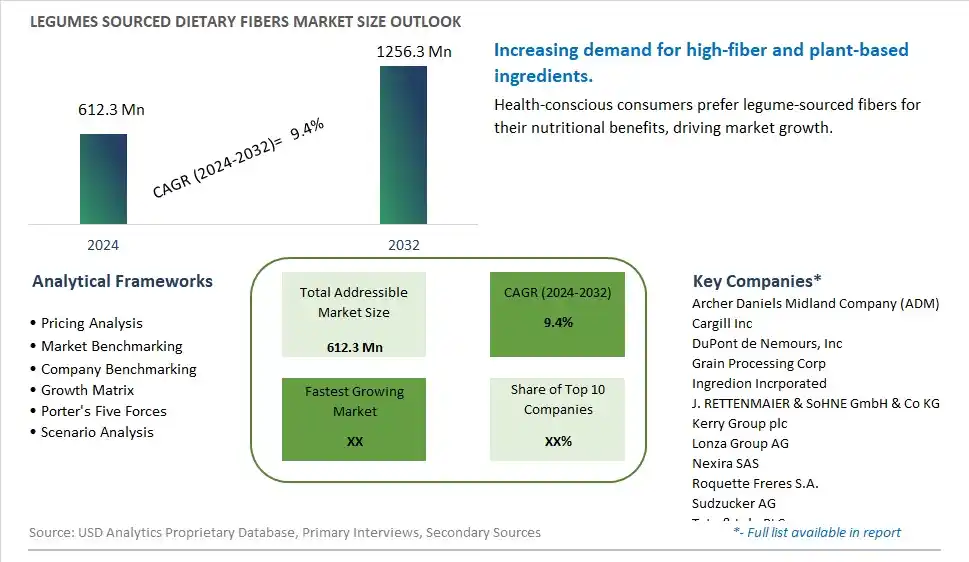
Global Legumes Sourced Dietary Fibers Market Size is valued at $612.3 Million in 2024 and is forecast to register a growth rate (CAGR) of 9.4% to reach $1256.3 Million by 2032.
The global Legumes Sourced Dietary Fibers Market Comprehensive Study analyzes and forecasts the market size across 6 regions and 24 countries for diverse segments -By Type (Soluble Dietary Fiber, Insoluble Dietary Fiber), By Application (Functional food & beverages, Pharmaceuticals, Animal feed, Others)
An Introduction to Legumes Sourced Dietary Fibers Market
The legumes sourced dietary fibers market in 2024 is growing steadily, driven by the increasing demand for high-fiber, plant-based ingredients in food and beverage products. Dietary fibers sourced from legumes, such as beans, lentils, and chickpeas, offer numerous health benefits, including improved digestion and heart health. The market benefits from innovations in fiber extraction and processing techniques that enhance the functionality and application of legume fibers. The trend towards clean label, natural ingredients, and the rise of plant-based diets are supporting market growth. Additionally, consumer interest in gut health and functional foods is further propelling demand for legume-sourced dietary fibers.
Legumes sourced Dietary Fibers Competitive Landscape
The market report analyses the leading companies in the industry including Archer Daniels Midland Company (ADM), Cargill Inc, DuPont de Nemours, Inc, Grain Processing Corp, Ingredion Incrporated, J. RETTENMAIER & SoHNE GmbH & Co KG, Kerry Group plc, Lonza Group AG, Nexira SAS, Roquette Freres S.A., Sudzucker AG, Tate & Lyle PLC, and Others.
Legumes sourced Dietary Fibers Market Dynamics
Legumes Sourced Dietary Fibers Market Trend: Rising Demand for Plant-Based Dietary Fibers
The most prominent trend in the Legumes Sourced Dietary Fibers Market is the rising demand for plant-based dietary fibers. Consumers are increasingly seeking natural and sustainable sources of dietary fiber, and legumes, such as beans, lentils, and peas, are recognized for their high fiber content and health benefits. This trend is driven by the growing interest in plant-based diets and the health advantages of dietary fibers.
Legumes Sourced Dietary Fibers Market Driver: Health Benefits and Functional Properties
A key driver in the Legumes Sourced Dietary Fibers Market is the health benefits and functional properties of legume-based fibers. Dietary fibers from legumes are known to improve digestive health, lower cholesterol levels, and regulate blood sugar. As more consumers become aware of these benefits, the demand for legume-sourced dietary fibers in food products, supplements, and functional foods increases.
Legumes Sourced Dietary Fibers Market Opportunity: Innovation in Food and Beverage Applications
One significant opportunity in the Legumes Sourced Dietary Fibers Market lies in innovation in food and beverage applications. Companies can develop new products that incorporate legume-based dietary fibers, such as high-fiber snacks, beverages, and meal replacements. By creating appealing and convenient products that emphasize the health benefits of dietary fibers, manufacturers can attract a broader consumer base and drive market growth.
Legumes sourced Dietary Fibers Market Share Analysis: Soluble Dietary Fiber segment generated the highest revenue share in the industry
In the Legumes sourced Dietary Fibers market, the Soluble Dietary Fiber segment emerges as the largest segment. Soluble dietary fibers, derived from legumes such as beans, peas, and lentils, are characterized by their ability to dissolve in water, forming a gel-like substance in the digestive tract. This property enables them to effectively lower cholesterol levels and regulate blood sugar levels, making them highly sought after in the food and beverage industry. Soluble dietary fibers are commonly used as functional ingredients in various food products like bread, cereals, and beverages, as they contribute to improved digestive health and overall well-being. The increasing consumer awareness of the health benefits associated with soluble dietary fibers has driven their demand across the globe. Further, their versatile application in both processed and natural food products underscores their significance in the market. As consumer preferences continue to favor healthier food choices, the Soluble Dietary Fiber segment is expected to experience robust growth, driven by innovations in food formulations and increasing adoption in functional food categories. This trend positions it as a pivotal segment within the legumes sourced dietary fibers market, poised for continued expansion in the coming years.
Legumes sourced Dietary Fibers Market Share Analysis: Functional Food & Beverages is the fastest growing segment over the forecast period to 2032
Within the Legumes sourced Dietary Fibers market, the Functional Food & Beverages segment stands out as the fastest-growing segment projected up to 2032. This segment encompasses a wide range of food and beverage products fortified with legume-derived dietary fibers to enhance their nutritional profile and health benefits. Functional foods and beverages are increasingly popular among health-conscious consumers seeking products that offer added health benefits beyond basic nutrition. Legumes sourced dietary fibers are valued in this segment for their ability to improve digestive health, promote satiety, and regulate blood sugar levels. The rising prevalence of lifestyle diseases such as obesity and diabetes has fueled the demand for functional food and beverages fortified with dietary fibers derived from legumes. Manufacturers are responding to this trend by developing innovative products that cater to consumer preferences for healthier eating habits. The integration of legume-sourced dietary fibers into functional food formulations not only enhances product appeal but also aligns with growing consumer awareness of the importance of dietary fiber in maintaining overall well-being. As a result, the Functional Food & Beverages segment is expected to experience substantial growth, driven by ongoing product innovation and increasing consumer demand for health-enhancing food options.
Legumes sourced Dietary Fibers Market Segmentation
By Type
Soluble Dietary Fiber
Insoluble Dietary Fiber
By Application
Functional food & beverages
Pharmaceuticals
Animal feed
Others
Countries Analyzed
North America (US, Canada, Mexico)
Europe (Germany, UK, France, Spain, Italy, Russia, Rest of Europe)
Asia Pacific (China, India, Japan, South Korea, Australia, South East Asia, Rest of Asia)
South America (Brazil, Argentina, Rest of South America)
Middle East and Africa (Saudi Arabia, UAE, Rest of Middle East, South Africa, Egypt, Rest of Africa)
Legumes sourced Dietary Fibers Companies Profiled in the Study
Archer Daniels Midland Company (ADM)
Cargill Inc
DuPont de Nemours, Inc
Grain Processing Corp
Ingredion Incrporated
J. RETTENMAIER & SoHNE GmbH & Co KG
Kerry Group plc
Lonza Group AG
Nexira SAS
Roquette Freres S.A.
Sudzucker AG
Tate & Lyle PLC
*- List Not Exhaustive
Chapter 1. TABLE OF CONTENTS
Chapter 2. Introduction to Legumes sourced Dietary Fibers Market
2.1. Market Overview
2.2. Key Statistics and Report Highlights
2.3. Scope of the Comprehensive Study
2.3.1. Market Definition
2.3.2 Countries and Regions Covered
2.3.3 Research Objective
2.3.4 Units, Currency, and Conversions
2.3.5 Industry Value Chain
2.4. Key Market Segments
2.5. Key Companies
2.6. Study Period
Chapter 3. Strategic Analysis Review
3.1. Legumes sourced Dietary Fibers Pricing Analysis and Forecast
3.2. Porter’s Five Forces
3.3. Market Ecosystem
3.4. SWOT Analysis
3.5. Regulatory Scenario
3.3. Effects of Inflation, Russia-Ukraine War, moderating economic growth, and other macroeconomic factors
Chapter 4. Competitive Landscape
4.1. Market Share Analysis
4.1.1. Global Legumes sourced Dietary Fibers Market Share by Company, 2023
4.1.2. Product Offerings of Leading Legumes sourced Dietary Fibers Companies
4.2. Market Entropy
4.2.1. New Product Launches in the Industry
4.2.2. Mergers, Acquisitions, Joint ventures, and Partnerships
4.3. Key Strategies and Best Practices
Chapter 5. Global Market Projections: Best, Reference, and Low Case Scenarios
5.1. Growth Analysis- Case Scenario Definitions
5.2. Low Growth Case Scenario Forecasts
5.3. Reference Growth Case Scenario Forecasts
5.4. High Growth Case Scenario Forecasts
Chapter 6. Market Dynamics
6.1. Legumes sourced Dietary Fibers Market Drivers
6.2. Legumes sourced Dietary Fibers Market Challenges
6.6. Legumes sourced Dietary Fibers Market Opportunities
6.4. Legumes sourced Dietary Fibers Market Trends
Chapter 7. Global Legumes sourced Dietary Fibers Market Outlook Trends
7.1. Global Legumes sourced Dietary Fibers Revenue (USD Million) and CAGR (%) by Type (2021-2032)
7.2. Global Legumes sourced Dietary Fibers Revenue (USD Million) and CAGR (%) by Application (2021-2032)
7.3. Global Legumes sourced Dietary Fibers Revenue (USD Million) and CAGR (%) by Product (2021-2032)
By Type
Soluble Dietary Fiber
Insoluble Dietary Fiber
By Application
Functional food & beverages
Pharmaceuticals
Animal feed
Others
Chapter 8. Global Legumes sourced Dietary Fibers Regional Analysis and Outlook
8.1. Global Legumes sourced Dietary Fibers Revenue (USD Million) By Regions (2021- 2032)
8.2. North America Legumes sourced Dietary Fibers Revenue (USD Million) by Country (2021-2032)
8.2.1. United States Legumes sourced Dietary Fibers Regional Analysis and Outlook
8.2.2. Canada Legumes sourced Dietary Fibers Regional Analysis and Outlook
8.2.3. Mexico Legumes sourced Dietary Fibers Regional Analysis and Outlook
8.3. Europe Legumes sourced Dietary Fibers Revenue (USD Million), by Country (2021-2032)
8.3.1. Germany Legumes sourced Dietary Fibers Regional Analysis and Outlook
8.3.2. France Legumes sourced Dietary Fibers Regional Analysis and Outlook
8.3.3. United Kingdom Legumes sourced Dietary Fibers Regional Analysis and Outlook
8.3.4. Spain Legumes sourced Dietary Fibers Regional Analysis and Outlook
8.3.5. Italy Legumes sourced Dietary Fibers Regional Analysis and Outlook
8.3.6. Russia Legumes sourced Dietary Fibers Regional Analysis and Outlook
8.3.7. Rest of Europe Legumes sourced Dietary Fibers Regional Analysis and Outlook
8.4. Asia Pacific Legumes sourced Dietary Fibers Revenue (USD Million) by Country (2021-2032)
8.4.1. China Legumes sourced Dietary Fibers Regional Analysis and Outlook
8.4.2. Japan Legumes sourced Dietary Fibers Regional Analysis and Outlook
8.4.3. India Legumes sourced Dietary Fibers Regional Analysis and Outlook
8.4.4. South Korea Legumes sourced Dietary Fibers Regional Analysis and Outlook
8.4.5. Australia Legumes sourced Dietary Fibers Regional Analysis and Outlook
8.4.6. South East Asia Legumes sourced Dietary Fibers Regional Analysis and Outlook
8.4.7. Rest of Asia Pacific Legumes sourced Dietary Fibers Regional Analysis and Outlook
8.5. South America Legumes sourced Dietary Fibers Revenue (USD Million), by Country (2021-2032)
8.5.1. Brazil Legumes sourced Dietary Fibers Regional Analysis and Outlook
8.5.2. Argentina Legumes sourced Dietary Fibers Regional Analysis and Outlook
8.5.3. Rest of South America Legumes sourced Dietary Fibers Regional Analysis and Outlook
8.6. Middle East and Africa Legumes sourced Dietary Fibers Revenue (USD Million) by Country (2021-2032)
8.6.1. Middle East Legumes sourced Dietary Fibers Regional Analysis and Outlook
8.6.2. Africa Legumes sourced Dietary Fibers Regional Analysis and Outlook
Chapter 9. North America Legumes sourced Dietary Fibers Analysis and Outlook
9.1. North America Legumes sourced Dietary Fibers Revenue (USD Million) by Segments (2021-2032)
9.1.1. North America Legumes sourced Dietary Fibers Revenue (USD Million) by Type (2021-2032)
9.1.2. North America Legumes sourced Dietary Fibers Revenue (USD Million) by Application (2021-2032)
9.1.3. North America Legumes sourced Dietary Fibers Revenue (USD Million) by Product (2021-2032)
By Type
Soluble Dietary Fiber
Insoluble Dietary Fiber
By Application
Functional food & beverages
Pharmaceuticals
Animal feed
Others
Chapter 10. Europe Legumes sourced Dietary Fibers Analysis and Outlook
10.1. Europe Legumes sourced Dietary Fibers Revenue (USD Million), by Segments (USD Million) (2021-2032)
10.1.1. Europe Legumes sourced Dietary Fibers Revenue (USD Million) by Type (2021-2032)
10.1.2. Europe Legumes sourced Dietary Fibers Revenue (USD Million) by Application (2021-2032)
10.1.3. Europe Legumes sourced Dietary Fibers Revenue (USD Million) by Product (2021-2032)
By Type
Soluble Dietary Fiber
Insoluble Dietary Fiber
By Application
Functional food & beverages
Pharmaceuticals
Animal feed
Others
Chapter 11. Asia Pacific Legumes sourced Dietary Fibers Analysis and Outlook
11.1. Asia Pacific Legumes sourced Dietary Fibers Revenue (USD Million), and Revenue (USD Million) by Segments (2021-2032)
11.1.1. Asia Pacific Legumes sourced Dietary Fibers Revenue (USD Million) by Type (2021-2032)
11.1.2. Asia Pacific Legumes sourced Dietary Fibers Revenue (USD Million) by Application (2021-2032)
11.1.3. Asia Pacific Legumes sourced Dietary Fibers Revenue (USD Million) by Product (2021-2032)
By Type
Soluble Dietary Fiber
Insoluble Dietary Fiber
By Application
Functional food & beverages
Pharmaceuticals
Animal feed
Others
Chapter 12. South America Legumes sourced Dietary Fibers Analysis and Outlook
12.1. South America Legumes sourced Dietary Fibers Revenue (USD Million), by Segments (2021-2032)
12.1.1. South America Legumes sourced Dietary Fibers Revenue (USD Million) by Type (2021-2032)
12.1.2. South America Legumes sourced Dietary Fibers Revenue (USD Million) by Application (2021-2032)
12.1.3. South America Legumes sourced Dietary Fibers Revenue (USD Million) by Product (2021-2032)
By Type
Soluble Dietary Fiber
Insoluble Dietary Fiber
By Application
Functional food & beverages
Pharmaceuticals
Animal feed
Others
Chapter 13. Middle East and Africa Legumes sourced Dietary Fibers Analysis and Outlook
13.1. Middle East and Africa Legumes sourced Dietary Fibers Revenue (USD Million), by Segments (2021-2032)
13.1.1. Middle East and Africa Legumes sourced Dietary Fibers Revenue (USD Million) by Type (2021-2032)
13.1.2. Middle East and Africa Legumes sourced Dietary Fibers Revenue (USD Million) by Application (2021-2032)
13.1.3. Middle East and Africa Legumes sourced Dietary Fibers Revenue (USD Million) by Product (2021-2032)
By Type
Soluble Dietary Fiber
Insoluble Dietary Fiber
By Application
Functional food & beverages
Pharmaceuticals
Animal feed
Others
Chapter 14. Legumes sourced Dietary Fibers Company Profiles
14.1 Business Overview
14.2 Product Profiles
14.3 SWOT Profiles
14.5 Recent Developments
14.6 Financial Profile
List of Companies
Archer Daniels Midland Company (ADM)
Cargill Inc
DuPont de Nemours, Inc
Grain Processing Corp
Ingredion Incrporated
J. RETTENMAIER & SoHNE GmbH & Co KG
Kerry Group plc
Lonza Group AG
Nexira SAS
Roquette Freres S.A.
Sudzucker AG
Tate & Lyle PLC
15. Methodology and Data Sources
15.1 Customization Offerings
15.2 Subscription Services
15.3 Related Reports
15.4 Publisher Expertise
LIST OF TABLES
Table 1 Market Segmentation Analysis
Table 2 Global Legumes sourced Dietary Fibers Market Share of Leading Companies, 2023
Table 3 Product Offerings of Leading Companies
Table 4 Low Growth Scenario Forecasts
Table 5 Reference Case Growth Scenario
Table 6 High Growth Case Scenario
Table 7 Global Legumes sourced Dietary Fibers Revenue (USD Million) And CAGR (%) By Type (2021-2032)
Table 8 Global Legumes sourced Dietary Fibers Revenue (USD Million) And CAGR (%) By Application (2021-2032)
Table 9 Global Legumes sourced Dietary Fibers Revenue (USD Million) And CAGR (%) By Product (2021-2032)
Table 10 Global Legumes sourced Dietary Fibers Market Revenue (USD Million) By Regions (2021-2032)
Table 11 Global Legumes sourced Dietary Fibers Market Share (%) By Regions (2021-2032)
Table 12 North America Legumes sourced Dietary Fibers Revenue (USD Million) By Country (2021-2032)
Table 13 Europe Legumes sourced Dietary Fibers Revenue (USD Million) By Country (2021-2032)
Table 14 Asia Pacific Legumes sourced Dietary Fibers Revenue (USD Million) By Country (2021-2032)
Table 15 South America Legumes sourced Dietary Fibers Revenue (USD Million) By Country (2021-2032)
Table 16 Middle East and Africa Legumes sourced Dietary Fibers Revenue (USD Million) By Region (2021-2032)
Table 17 North America Legumes sourced Dietary Fibers Revenue (USD Million) By Type (2021-2032)
Table 18 North America Legumes sourced Dietary Fibers Revenue (USD Million) By Application (2021-2032)
Table 19 North America Legumes sourced Dietary Fibers Revenue (USD Million) By Product (2021-2032)
Table 20 Europe Legumes sourced Dietary Fibers Revenue (USD Million) By Type (2021-2032)
Table 21 Europe Legumes sourced Dietary Fibers Revenue (USD Million) By Application (2021-2032)
Table 22 Europe Legumes sourced Dietary Fibers Revenue (USD Million) By Product (2021-2032)
Table 23 Asia Pacific Legumes sourced Dietary Fibers Revenue (USD Million) By Type (2021-2032)
Table 24 Asia Pacific Legumes sourced Dietary Fibers Revenue (USD Million) By Application (2021-2032)
Table 25 Asia Pacific Legumes sourced Dietary Fibers Revenue (USD Million) By Product (2021-2032)
Table 26 South America Legumes sourced Dietary Fibers Revenue (USD Million) By Type (2021-2032)
Table 27 South America Legumes sourced Dietary Fibers Revenue (USD Million) By Application (2021-2032)
Table 28 South America Legumes sourced Dietary Fibers Revenue (USD Million) By Product (2021-2032)
Table 29 Middle East and Africa Legumes sourced Dietary Fibers Revenue (USD Million) By Type (2021-2032)
Table 30 Middle East and Africa Legumes sourced Dietary Fibers Revenue (USD Million) By Application (2021-2032)
Table 31 Middle East and Africa Legumes sourced Dietary Fibers Revenue (USD Million) By Product (2021-2032)
LIST OF FIGURES
Figure 1. Market Scope
Figure 2. Pricing Forecasts Per Unit, 2023- 2032
Figure 3. Porter’s Five Forces
Figure 4. Global Legumes sourced Dietary Fibers Market Revenue (USD Million) By Regions (2021-2032)
Figure 5. Global Legumes sourced Dietary Fibers Market Share (%) By Regions (2023)
Figure 6. North America Legumes sourced Dietary Fibers Revenue (USD Million) By Country (2021-2032)
Figure 7. United States Legumes sourced Dietary Fibers Revenue (USD Million) By Country (2021-2032)
Figure 8. Canada Legumes sourced Dietary Fibers Revenue (USD Million) By Country (2021-2032)
Figure 9. Mexico Legumes sourced Dietary Fibers Revenue (USD Million) By Country (2021-2032)
Figure 10. Europe Legumes sourced Dietary Fibers Revenue (USD Million) By Country (2021-2032)
Figure 11. Germany Legumes sourced Dietary Fibers Revenue (USD Million) By Country (2021-2032)
Figure 12. France Legumes sourced Dietary Fibers Revenue (USD Million) By Country (2021-2032)
Figure 13. United Kingdom Legumes sourced Dietary Fibers Revenue (USD Million) By Country (2021-2032)
Figure 14. Spain Legumes sourced Dietary Fibers Revenue (USD Million) By Country (2021-2032)
Figure 15. Italy Legumes sourced Dietary Fibers Revenue (USD Million) By Country (2021-2032)
Figure 16. Russia Legumes sourced Dietary Fibers Revenue (USD Million) By Country (2021-2032)
Figure 17. Rest of Europe Legumes sourced Dietary Fibers Revenue (USD Million) By Country (2021-2032)
Figure 11. Asia Pacific Legumes sourced Dietary Fibers Revenue (USD Million) By Country (2021-2032)
Figure 12. China Legumes sourced Dietary Fibers Revenue (USD Million) By Country (2021-2032)
Figure 13. Japan Legumes sourced Dietary Fibers Revenue (USD Million) By Country (2021-2032)
Figure 14. India Legumes sourced Dietary Fibers Revenue (USD Million) By Country (2021-2032)
Figure 15. South Korea Legumes sourced Dietary Fibers Revenue (USD Million) By Country (2021-2032)
Figure 16. Australia Legumes sourced Dietary Fibers Revenue (USD Million) By Country (2021-2032)
Figure 17. South East Asia Legumes sourced Dietary Fibers Revenue (USD Million) By Country (2021-2032)
Figure 18. South America Legumes sourced Dietary Fibers Revenue (USD Million) By Country (2021-2032)
Figure 19. Brazil Legumes sourced Dietary Fibers Revenue (USD Million) By Country (2021-2032)
Figure 20. Argentina Legumes sourced Dietary Fibers Revenue (USD Million) By Country (2021-2032)
Figure 21. Rest of Asia Pacific Legumes sourced Dietary Fibers Revenue (USD Million) By Country (2021-2032)
Figure 22. Middle East and Africa Legumes sourced Dietary Fibers Revenue (USD Million) By Region (2021-2032)
Figure 23. Saudi Arabia Legumes sourced Dietary Fibers Revenue (USD Million) By Region (2021-2032)
Figure 24. The UAE Legumes sourced Dietary Fibers Revenue (USD Million) By Region (2021-2032)
Figure 25. Rest of Middle East Legumes sourced Dietary Fibers Revenue (USD Million) By Region (2021-2032)
Figure 26. South Africa Legumes sourced Dietary Fibers Revenue (USD Million) By Region (2021-2032)
Figure 27. Africa Legumes sourced Dietary Fibers Revenue (USD Million) By Region (2021-2032)
Figure 28. North America Legumes sourced Dietary Fibers Revenue (USD Million) By Type (2021-2032)
Figure 29. North America Legumes sourced Dietary Fibers Revenue (USD Million) By Application (2021-2032)
Figure 30. North America Legumes sourced Dietary Fibers Revenue (USD Million) By Product (2021-2032)
Figure 31. Europe Legumes sourced Dietary Fibers Revenue (USD Million) By Type (2021-2032)
Figure 32. Europe Legumes sourced Dietary Fibers Revenue (USD Million) By Application (2021-2032)
Figure 33. Europe Legumes sourced Dietary Fibers Revenue (USD Million) By Product (2021-2032)
Figure 34. Asia Pacific Legumes sourced Dietary Fibers Revenue (USD Million) By Type (2021-2032)
Figure 35. Asia Pacific Legumes sourced Dietary Fibers Revenue (USD Million) By Application (2021-2032)
Figure 36. Asia Pacific Legumes sourced Dietary Fibers Revenue (USD Million) By Product (2021-2032)
Figure 37. South America Legumes sourced Dietary Fibers Revenue (USD Million) By Type (2021-2032)
Figure 38. South America Legumes sourced Dietary Fibers Revenue (USD Million) By Application (2021-2032)
Figure 39. South America Legumes sourced Dietary Fibers Revenue (USD Million) By Product (2021-2032)
Figure 40. Middle East and Africa Legumes sourced Dietary Fibers Revenue (USD Million) By Type (2021-2032)
Figure 41. Middle East and Africa Legumes sourced Dietary Fibers Revenue (USD Million) By Application (2021-2032)
Figure 42. Middle East and Africa Legumes sourced Dietary Fibers Revenue (USD Million) By Product (2021-2032)
By Type
Soluble Dietary Fiber
Insoluble Dietary Fiber
By Application
Functional food & beverages
Pharmaceuticals
Animal feed
Others
Countries Analyzed
North America (US, Canada, Mexico)
Europe (Germany, UK, France, Spain, Italy, Russia, Rest of Europe)
Asia Pacific (China, India, Japan, South Korea, Australia, South East Asia, Rest of Asia)
South America (Brazil, Argentina, Rest of South America)
Middle East and Africa (Saudi Arabia, UAE, Rest of Middle East, South Africa, Egypt, Rest of Africa)
