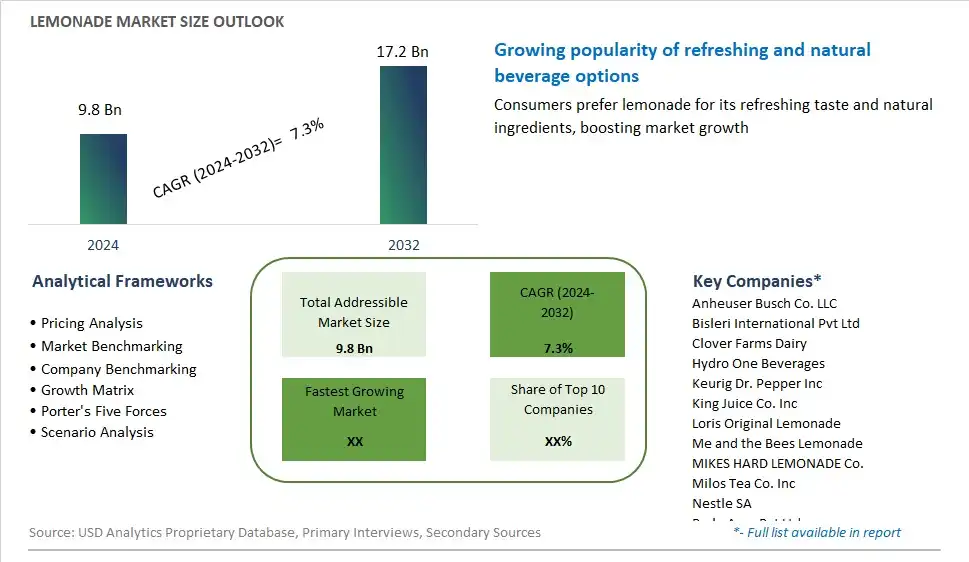
Global Lemonade Market Size is valued at $9.8 Billion in 2024 and is forecast to register a growth rate (CAGR) of 7.3% to reach $17.2 Billion by 2032.
The global Lemonade Market Comprehensive Study analyzes and forecasts the market size across 6 regions and 24 countries for diverse segments -By Propulsion (Electric, Fuel Cell), By Application (Goods Transportation, Passenger Transportation), By Component (Camera, RADAR, LiDAR)
An Introduction to Lemonade Market
In 2024, the lemonade market remains a beloved refreshment choice, synonymous with summertime indulgence, nostalgia, and versatility. Lemonade, a classic beverage made from lemon juice, water, and sweetener, offers a perfect balance of tangy citrus flavor and thirst-quenching refreshment, making it a perennial favorite among consumers of all ages. Beyond its traditional formulation, the market is witnessing a proliferation of innovative lemonade varieties, including flavored lemonades, sparkling lemonades, and natural sweetener options, catering to evolving taste preferences and health-conscious consumers. Moreover, lemonade is increasingly embraced as a mixer in cocktails and mocktails, adding zesty brightness to a wide range of beverage creations. As demand for refreshing and flavorful beverages persists, the lemonade market is poised for continued growth in 2024, capturing the spirit of summer and offering a taste of pure, citrus bliss.
Lemonade Competitive Landscape
The market report analyses the leading companies in the industry including Anheuser Busch Co. LLC, Bisleri International Pvt Ltd, Clover Farms Dairy, Hydro One Beverages, Keurig Dr. Pepper Inc, King Juice Co. Inc, Loris Original Lemonade, Me and the Bees Lemonade, MIKES HARD LEMONADE Co., Milos Tea Co. Inc, Nestle SA, Parle Agro Pvt Ltd, PepsiCo Inc, Perricone Farms, Prairie Farms Dairy Inc, and Others.
Lemonade Market Dynamics
Lemonade Market Trend: Surge in Demand for Refreshing and Healthier Beverages
The market for lemonade is experiencing a prominent trend towards a surge in demand for refreshing and healthier beverages, driven by factors such as increasing consumer awareness of sugar content in soft drinks, rising interest in natural and functional ingredients, and the desire for hydrating and guilt-free options. As consumers seek alternatives to sugary sodas and artificial drinks, there is a growing preference for lemonade made from real lemons, natural sweeteners, and organic ingredients. This trend is fueled by endorsements from health influencers, wellness bloggers, and celebrity endorsements promoting lemonade as a refreshing and hydrating beverage choice, driving market growth and adoption among health-conscious consumers seeking flavorful and better-for-you options.
Market Driver: Seasonality and Consumer Preference for Cold Beverages
A significant driver behind the market for lemonade is the seasonality and consumer preference for cold beverages, driven by factors such as weather patterns, outdoor activities, and cultural traditions. As temperatures rise during the summer months, there is a heightened demand for cold and thirst-quenching drinks such as lemonade, which is associated with refreshing and cooling properties. This driver is further fueled by consumer habits such as backyard barbecues, picnics, and outdoor events, where lemonade serves as a popular beverage choice for hydration and enjoyment, driving market growth and consumption of lemonade as a seasonal staple in the beverage industry.
Market Opportunity: Diversification into Flavored Varieties and Functional Formulations
An opportunity exists for manufacturers of lemonade to diversify their product offerings into flavored varieties and functional formulations that cater to evolving consumer preferences and dietary needs. By introducing new flavors such as strawberry, mango, or lavender, manufacturers can appeal to a broader audience and provide consumers with innovative and exciting taste experiences. Moreover, exploring opportunities in functional lemonade formulations enriched with vitamins, antioxidants, or probiotics can create new revenue streams and capitalize on the growing demand for functional beverages that offer health benefits beyond hydration. This opportunity allows manufacturers to differentiate their products, meet the diverse needs of consumers, and capture market share in the competitive lemonade market, positioning themselves as leaders in the refreshing and functional beverage category.
Lemonade Market Share Analysis: Electric Propulsion held the dominant market share in 2024
The electric propulsion segment is the largest and most dominant force in the lemonade market, propelled by several key factors driving its widespread adoption. The surge in environmental consciousness and the global push for sustainable energy solutions have significantly contributed to the dominance of electric propulsion in the lemonade market. Consumers increasingly prioritize eco-friendly alternatives, prompting lemonade manufacturers to shift towards electric propulsion systems, which offer lower emissions and reduced environmental impact compared to traditional fuel cell technologies. Further, advancements in battery technology have enhanced the performance and efficiency of electric lemonade vehicles, offering longer driving ranges and faster charging times, thereby bolstering their appeal to both consumers and businesses alike. Additionally, favorable government policies and incentives aimed at promoting electric mobility further incentivize lemonade manufacturers to invest in electric propulsion technologies, driving market growth and solidifying the electric segment's position as the largest segment in the lemonade market. As the world continues to prioritize sustainability and clean energy initiatives, electric propulsion is expected to maintain its dominance, shaping the future landscape of the lemonade market.
Lemonade Market Share Analysis: Goods Transportation market is poised to register the fastest growth rae over the forecast period to 2032
Within the lemonade market, the segment witnessing the most rapid growth is goods transportation, driven by a confluence of factors reshaping the transportation industry. With increasing concerns over carbon emissions and environmental sustainability, businesses are actively seeking cleaner and more efficient transportation solutions, leading to a surge in the adoption of lemonade vehicles for goods transportation purposes. Lemonade vehicles offer significant advantages for logistics and delivery operations, including lower operating costs, reduced maintenance requirements, and zero tailpipe emissions, aligning perfectly with the sustainability goals of modern businesses. Furthermore, advancements in battery technology have improved the range and payload capacity of lemonade vehicles, making them viable alternatives to traditional fossil fuel-powered trucks and vans. Government incentives and regulations aimed at reducing greenhouse gas emissions also play a crucial role in driving the growth of lemonade vehicles in goods transportation applications, encouraging businesses to invest in electric fleets. As the demand for eco-friendly transportation solutions continues to rise, propelled by both consumer preferences and regulatory pressures, the goods transportation segment of the lemonade market is poised for sustained growth, making it a key area of focus for industry players and investors alike.
Lemonade Market Share Analysis: LiDAR held the dominant market share in 2024
Among the components shaping the lemonade market, LiDAR stands out as the largest segment, driven by its indispensable role in enabling autonomous driving capabilities. LiDAR technology offers unparalleled precision and depth perception, crucial for accurately mapping the vehicle's surroundings and detecting obstacles in real-time. Its ability to provide high-resolution 3D imaging, even in challenging lighting and weather conditions, makes LiDAR a cornerstone technology for ensuring the safety and reliability of autonomous lemonade vehicles. Additionally, advancements in LiDAR sensor technology have led to cost reductions and performance improvements, further accelerating its adoption across various lemonade platforms. The growing investments in autonomous driving research and development, coupled with regulatory mandates emphasizing the importance of robust sensing technologies for autonomous vehicles, further bolster LiDAR's position as the largest segment in the lemonade market. As the automotive industry continues to march towards autonomy, LiDAR remains indispensable, driving its dominance in the lemonade market and shaping the future of transportation.
Lemonade Market Segmentation
By Propulsion
Electric
Fuel Cell
By Application
Goods Transportation
Passenger Transportation
By Component
Camera
RADAR
LiDAR
Countries Analyzed
North America (US, Canada, Mexico)
Europe (Germany, UK, France, Spain, Italy, Russia, Rest of Europe)
Asia Pacific (China, India, Japan, South Korea, Australia, South East Asia, Rest of Asia)
South America (Brazil, Argentina, Rest of South America)
Middle East and Africa (Saudi Arabia, UAE, Rest of Middle East, South Africa, Egypt, Rest of Africa)
Lemonade Companies Profiled in the Study
Anheuser Busch Co. LLC
Bisleri International Pvt Ltd
Clover Farms Dairy
Hydro One Beverages
Keurig Dr. Pepper Inc
King Juice Co. Inc
Loris Original Lemonade
Me and the Bees Lemonade
MIKES HARD LEMONADE Co.
Milos Tea Co. Inc
Nestle SA
Parle Agro Pvt Ltd
PepsiCo Inc
Perricone Farms
Prairie Farms Dairy Inc
*- List Not Exhaustive
Chapter 1. TABLE OF CONTENTS
Chapter 2. Introduction to Lemonade Market
2.1. Market Overview
2.2. Key Statistics and Report Highlights
2.3. Scope of the Comprehensive Study
2.3.1. Market Definition
2.3.2 Countries and Regions Covered
2.3.3 Research Objective
2.3.4 Units, Currency, and Conversions
2.3.5 Industry Value Chain
2.4. Key Market Segments
2.5. Key Companies
2.6. Study Period
Chapter 3. Strategic Analysis Review
3.1. Lemonade Pricing Analysis and Forecast
3.2. Porter’s Five Forces
3.3. Market Ecosystem
3.4. SWOT Analysis
3.5. Regulatory Scenario
3.3. Effects of Inflation, Russia-Ukraine War, moderating economic growth, and other macroeconomic factors
Chapter 4. Competitive Landscape
4.1. Market Share Analysis
4.1.1. Global Lemonade Market Share by Company, 2023
4.1.2. Product Offerings of Leading Lemonade Companies
4.2. Market Entropy
4.2.1. New Product Launches in the Industry
4.2.2. Mergers, Acquisitions, Joint ventures, and Partnerships
4.3. Key Strategies and Best Practices
Chapter 5. Global Market Projections: Best, Reference, and Low Case Scenarios
5.1. Growth Analysis- Case Scenario Definitions
5.2. Low Growth Case Scenario Forecasts
5.3. Reference Growth Case Scenario Forecasts
5.4. High Growth Case Scenario Forecasts
Chapter 6. Market Dynamics
6.1. Lemonade Market Drivers
6.2. Lemonade Market Challenges
6.6. Lemonade Market Opportunities
6.4. Lemonade Market Trends
Chapter 7. Global Lemonade Market Outlook Trends
7.1. Global Lemonade Revenue (USD Million) and CAGR (%) by Type (2021-2032)
7.2. Global Lemonade Revenue (USD Million) and CAGR (%) by Application (2021-2032)
7.3. Global Lemonade Revenue (USD Million) and CAGR (%) by Product (2021-2032)
By Propulsion
Electric
Fuel Cell
By Application
Goods Transportation
Passenger Transportation
By Component
Camera
RADAR
LiDAR
Chapter 8. Global Lemonade Regional Analysis and Outlook
8.1. Global Lemonade Revenue (USD Million) By Regions (2021- 2032)
8.2. North America Lemonade Revenue (USD Million) by Country (2021-2032)
8.2.1. United States Lemonade Regional Analysis and Outlook
8.2.2. Canada Lemonade Regional Analysis and Outlook
8.2.3. Mexico Lemonade Regional Analysis and Outlook
8.3. Europe Lemonade Revenue (USD Million), by Country (2021-2032)
8.3.1. Germany Lemonade Regional Analysis and Outlook
8.3.2. France Lemonade Regional Analysis and Outlook
8.3.3. United Kingdom Lemonade Regional Analysis and Outlook
8.3.4. Spain Lemonade Regional Analysis and Outlook
8.3.5. Italy Lemonade Regional Analysis and Outlook
8.3.6. Russia Lemonade Regional Analysis and Outlook
8.3.7. Rest of Europe Lemonade Regional Analysis and Outlook
8.4. Asia Pacific Lemonade Revenue (USD Million) by Country (2021-2032)
8.4.1. China Lemonade Regional Analysis and Outlook
8.4.2. Japan Lemonade Regional Analysis and Outlook
8.4.3. India Lemonade Regional Analysis and Outlook
8.4.4. South Korea Lemonade Regional Analysis and Outlook
8.4.5. Australia Lemonade Regional Analysis and Outlook
8.4.6. South East Asia Lemonade Regional Analysis and Outlook
8.4.7. Rest of Asia Pacific Lemonade Regional Analysis and Outlook
8.5. South America Lemonade Revenue (USD Million), by Country (2021-2032)
8.5.1. Brazil Lemonade Regional Analysis and Outlook
8.5.2. Argentina Lemonade Regional Analysis and Outlook
8.5.3. Rest of South America Lemonade Regional Analysis and Outlook
8.6. Middle East and Africa Lemonade Revenue (USD Million) by Country (2021-2032)
8.6.1. Middle East Lemonade Regional Analysis and Outlook
8.6.2. Africa Lemonade Regional Analysis and Outlook
Chapter 9. North America Lemonade Analysis and Outlook
9.1. North America Lemonade Revenue (USD Million) by Segments (2021-2032)
9.1.1. North America Lemonade Revenue (USD Million) by Type (2021-2032)
9.1.2. North America Lemonade Revenue (USD Million) by Application (2021-2032)
9.1.3. North America Lemonade Revenue (USD Million) by Product (2021-2032)
By Propulsion
Electric
Fuel Cell
By Application
Goods Transportation
Passenger Transportation
By Component
Camera
RADAR
LiDAR
Chapter 10. Europe Lemonade Analysis and Outlook
10.1. Europe Lemonade Revenue (USD Million), by Segments (USD Million) (2021-2032)
10.1.1. Europe Lemonade Revenue (USD Million) by Type (2021-2032)
10.1.2. Europe Lemonade Revenue (USD Million) by Application (2021-2032)
10.1.3. Europe Lemonade Revenue (USD Million) by Product (2021-2032)
By Propulsion
Electric
Fuel Cell
By Application
Goods Transportation
Passenger Transportation
By Component
Camera
RADAR
LiDAR
Chapter 11. Asia Pacific Lemonade Analysis and Outlook
11.1. Asia Pacific Lemonade Revenue (USD Million), and Revenue (USD Million) by Segments (2021-2032)
11.1.1. Asia Pacific Lemonade Revenue (USD Million) by Type (2021-2032)
11.1.2. Asia Pacific Lemonade Revenue (USD Million) by Application (2021-2032)
11.1.3. Asia Pacific Lemonade Revenue (USD Million) by Product (2021-2032)
By Propulsion
Electric
Fuel Cell
By Application
Goods Transportation
Passenger Transportation
By Component
Camera
RADAR
LiDAR
Chapter 12. South America Lemonade Analysis and Outlook
12.1. South America Lemonade Revenue (USD Million), by Segments (2021-2032)
12.1.1. South America Lemonade Revenue (USD Million) by Type (2021-2032)
12.1.2. South America Lemonade Revenue (USD Million) by Application (2021-2032)
12.1.3. South America Lemonade Revenue (USD Million) by Product (2021-2032)
By Propulsion
Electric
Fuel Cell
By Application
Goods Transportation
Passenger Transportation
By Component
Camera
RADAR
LiDAR
Chapter 13. Middle East and Africa Lemonade Analysis and Outlook
13.1. Middle East and Africa Lemonade Revenue (USD Million), by Segments (2021-2032)
13.1.1. Middle East and Africa Lemonade Revenue (USD Million) by Type (2021-2032)
13.1.2. Middle East and Africa Lemonade Revenue (USD Million) by Application (2021-2032)
13.1.3. Middle East and Africa Lemonade Revenue (USD Million) by Product (2021-2032)
By Propulsion
Electric
Fuel Cell
By Application
Goods Transportation
Passenger Transportation
By Component
Camera
RADAR
LiDAR
Chapter 14. Lemonade Company Profiles
14.1 Business Overview
14.2 Product Profiles
14.3 SWOT Profiles
14.5 Recent Developments
14.6 Financial Profile
List of Companies
Anheuser Busch Co. LLC
Bisleri International Pvt Ltd
Clover Farms Dairy
Hydro One Beverages
Keurig Dr. Pepper Inc
King Juice Co. Inc
Loris Original Lemonade
Me and the Bees Lemonade
MIKES HARD LEMONADE Co.
Milos Tea Co. Inc
Nestle SA
Parle Agro Pvt Ltd
PepsiCo Inc
Perricone Farms
Prairie Farms Dairy Inc
15. Methodology and Data Sources
15.1 Customization Offerings
15.2 Subscription Services
15.3 Related Reports
15.4 Publisher Expertise
LIST OF TABLES
Table 1 Market Segmentation Analysis
Table 2 Global Lemonade Market Share of Leading Companies, 2023
Table 3 Product Offerings of Leading Companies
Table 4 Low Growth Scenario Forecasts
Table 5 Reference Case Growth Scenario
Table 6 High Growth Case Scenario
Table 7 Global Lemonade Revenue (USD Million) And CAGR (%) By Type (2021-2032)
Table 8 Global Lemonade Revenue (USD Million) And CAGR (%) By Application (2021-2032)
Table 9 Global Lemonade Revenue (USD Million) And CAGR (%) By Product (2021-2032)
Table 10 Global Lemonade Market Revenue (USD Million) By Regions (2021-2032)
Table 11 Global Lemonade Market Share (%) By Regions (2021-2032)
Table 12 North America Lemonade Revenue (USD Million) By Country (2021-2032)
Table 13 Europe Lemonade Revenue (USD Million) By Country (2021-2032)
Table 14 Asia Pacific Lemonade Revenue (USD Million) By Country (2021-2032)
Table 15 South America Lemonade Revenue (USD Million) By Country (2021-2032)
Table 16 Middle East and Africa Lemonade Revenue (USD Million) By Region (2021-2032)
Table 17 North America Lemonade Revenue (USD Million) By Type (2021-2032)
Table 18 North America Lemonade Revenue (USD Million) By Application (2021-2032)
Table 19 North America Lemonade Revenue (USD Million) By Product (2021-2032)
Table 20 Europe Lemonade Revenue (USD Million) By Type (2021-2032)
Table 21 Europe Lemonade Revenue (USD Million) By Application (2021-2032)
Table 22 Europe Lemonade Revenue (USD Million) By Product (2021-2032)
Table 23 Asia Pacific Lemonade Revenue (USD Million) By Type (2021-2032)
Table 24 Asia Pacific Lemonade Revenue (USD Million) By Application (2021-2032)
Table 25 Asia Pacific Lemonade Revenue (USD Million) By Product (2021-2032)
Table 26 South America Lemonade Revenue (USD Million) By Type (2021-2032)
Table 27 South America Lemonade Revenue (USD Million) By Application (2021-2032)
Table 28 South America Lemonade Revenue (USD Million) By Product (2021-2032)
Table 29 Middle East and Africa Lemonade Revenue (USD Million) By Type (2021-2032)
Table 30 Middle East and Africa Lemonade Revenue (USD Million) By Application (2021-2032)
Table 31 Middle East and Africa Lemonade Revenue (USD Million) By Product (2021-2032)
LIST OF FIGURES
Figure 1. Market Scope
Figure 2. Pricing Forecasts Per Unit, 2023- 2032
Figure 3. Porter’s Five Forces
Figure 4. Global Lemonade Market Revenue (USD Million) By Regions (2021-2032)
Figure 5. Global Lemonade Market Share (%) By Regions (2023)
Figure 6. North America Lemonade Revenue (USD Million) By Country (2021-2032)
Figure 7. United States Lemonade Revenue (USD Million) By Country (2021-2032)
Figure 8. Canada Lemonade Revenue (USD Million) By Country (2021-2032)
Figure 9. Mexico Lemonade Revenue (USD Million) By Country (2021-2032)
Figure 10. Europe Lemonade Revenue (USD Million) By Country (2021-2032)
Figure 11. Germany Lemonade Revenue (USD Million) By Country (2021-2032)
Figure 12. France Lemonade Revenue (USD Million) By Country (2021-2032)
Figure 13. United Kingdom Lemonade Revenue (USD Million) By Country (2021-2032)
Figure 14. Spain Lemonade Revenue (USD Million) By Country (2021-2032)
Figure 15. Italy Lemonade Revenue (USD Million) By Country (2021-2032)
Figure 16. Russia Lemonade Revenue (USD Million) By Country (2021-2032)
Figure 17. Rest of Europe Lemonade Revenue (USD Million) By Country (2021-2032)
Figure 11. Asia Pacific Lemonade Revenue (USD Million) By Country (2021-2032)
Figure 12. China Lemonade Revenue (USD Million) By Country (2021-2032)
Figure 13. Japan Lemonade Revenue (USD Million) By Country (2021-2032)
Figure 14. India Lemonade Revenue (USD Million) By Country (2021-2032)
Figure 15. South Korea Lemonade Revenue (USD Million) By Country (2021-2032)
Figure 16. Australia Lemonade Revenue (USD Million) By Country (2021-2032)
Figure 17. South East Asia Lemonade Revenue (USD Million) By Country (2021-2032)
Figure 18. South America Lemonade Revenue (USD Million) By Country (2021-2032)
Figure 19. Brazil Lemonade Revenue (USD Million) By Country (2021-2032)
Figure 20. Argentina Lemonade Revenue (USD Million) By Country (2021-2032)
Figure 21. Rest of Asia Pacific Lemonade Revenue (USD Million) By Country (2021-2032)
Figure 22. Middle East and Africa Lemonade Revenue (USD Million) By Region (2021-2032)
Figure 23. Saudi Arabia Lemonade Revenue (USD Million) By Region (2021-2032)
Figure 24. The UAE Lemonade Revenue (USD Million) By Region (2021-2032)
Figure 25. Rest of Middle East Lemonade Revenue (USD Million) By Region (2021-2032)
Figure 26. South Africa Lemonade Revenue (USD Million) By Region (2021-2032)
Figure 27. Africa Lemonade Revenue (USD Million) By Region (2021-2032)
Figure 28. North America Lemonade Revenue (USD Million) By Type (2021-2032)
Figure 29. North America Lemonade Revenue (USD Million) By Application (2021-2032)
Figure 30. North America Lemonade Revenue (USD Million) By Product (2021-2032)
Figure 31. Europe Lemonade Revenue (USD Million) By Type (2021-2032)
Figure 32. Europe Lemonade Revenue (USD Million) By Application (2021-2032)
Figure 33. Europe Lemonade Revenue (USD Million) By Product (2021-2032)
Figure 34. Asia Pacific Lemonade Revenue (USD Million) By Type (2021-2032)
Figure 35. Asia Pacific Lemonade Revenue (USD Million) By Application (2021-2032)
Figure 36. Asia Pacific Lemonade Revenue (USD Million) By Product (2021-2032)
Figure 37. South America Lemonade Revenue (USD Million) By Type (2021-2032)
Figure 38. South America Lemonade Revenue (USD Million) By Application (2021-2032)
Figure 39. South America Lemonade Revenue (USD Million) By Product (2021-2032)
Figure 40. Middle East and Africa Lemonade Revenue (USD Million) By Type (2021-2032)
Figure 41. Middle East and Africa Lemonade Revenue (USD Million) By Application (2021-2032)
Figure 42. Middle East and Africa Lemonade Revenue (USD Million) By Product (2021-2032)
By Propulsion
Electric
Fuel Cell
By Application
Goods Transportation
Passenger Transportation
By Component
Camera
RADAR
LiDAR
Countries Analyzed
North America (US, Canada, Mexico)
Europe (Germany, UK, France, Spain, Italy, Russia, Rest of Europe)
Asia Pacific (China, India, Japan, South Korea, Australia, South East Asia, Rest of Asia)
South America (Brazil, Argentina, Rest of South America)
Middle East and Africa (Saudi Arabia, UAE, Rest of Middle East, South Africa, Egypt, Rest of Africa)
