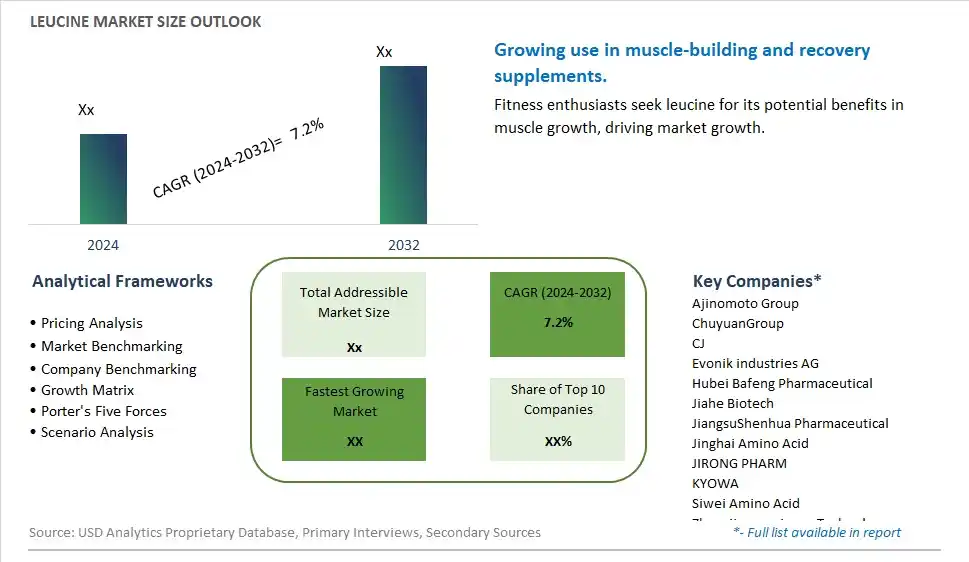
Global Leucine Market Size is valued at $XX Million in 2024 and is forecast to register a growth rate (CAGR) of 7.2% to reach $XX Million by 2032.
The global Leucine Market Comprehensive Study analyzes and forecasts the market size across 6 regions and 24 countries for diverse segments -By Type (Food Grade, Feed Grade, Pharmaceutical Grade), By Application (Food, Feed, Pharmaceuticals)
An Introduction to Leucine Market
In 2024, the leucine market is experiencing significant growth, driven by the increasing demand for amino acid supplements that support muscle growth and recovery. Leucine, a branched-chain amino acid (BCAA), is widely used in sports nutrition and dietary supplements. The market benefits from ongoing research highlighting the benefits of leucine in muscle protein synthesis and innovations in supplement formulations, including BCAA blends and plant-based options. The trend towards fitness and active lifestyles is supporting demand for leucine supplements. Additionally, the rise of personalized nutrition and the popularity of high-protein diets are further propelling market growth.
Leucine Competitive Landscape
The market report analyses the leading companies in the industry including Ajinomoto Group, ChuyuanGroup, CJ, Evonik industries AG, Hubei Bafeng Pharmaceutical, Jiahe Biotech, JiangsuShenhua Pharmaceutical, Jinghai Amino Acid, JIRONG PHARM, KYOWA, Siwei Amino Acid, Zhangjiagangxingyu Technology, and Others.
Leucine Market Dynamics
Leucine Market Trend: Increasing Use in Sports Nutrition and Dietary Supplements
The most prominent trend in the Leucine Market is the increasing use in sports nutrition and dietary supplements. Leucine, a branched-chain amino acid (BCAA), is essential for muscle protein synthesis and is widely used in supplements aimed at enhancing athletic performance and muscle recovery. This trend is driven by the growing interest in fitness and bodybuilding.
Leucine Market Driver: Rising Demand for Muscle-Building Supplements
A key driver in the Leucine Market is the rising demand for muscle-building supplements. As more individuals engage in regular physical activity and seek to improve their muscle mass and strength, there is a growing demand for supplements that support muscle growth and recovery. Leucine, known for its role in stimulating muscle protein synthesis, is a key ingredient in many sports nutrition products.
Leucine Market Opportunity: Development of Specialized Amino Acid Formulations
One significant opportunity in the Leucine Market lies in the development of specialized amino acid formulations. Companies can innovate by creating leucine-based supplements that target specific fitness goals, such as pre-workout energy, post-workout recovery, or intra-workout endurance. By offering tailored solutions for different athletic needs, manufacturers can attract a broader consumer base and drive market growth.
Leucine Market Share Analysis: Food Grade segment generated the highest revenue share in the industry
The Food Grade segment stands out as the largest in the Leucine market. This segment primarily caters to the food industry, where leucine is utilized as a flavor enhancer, nutritional supplement, and ingredient in various food products. The demand for leucine in food-grade applications is driven by its essential role in protein synthesis and its ability to support muscle growth and repair. It is widely incorporated into sports nutrition products, functional foods, and dietary supplements aimed at promoting muscle health and overall well-being. The growth of this segment is also supported by increasing consumer awareness of health and wellness, driving the demand for products enriched with amino acids like leucine. Manufacturers are focusing on developing innovative food formulations that highlight the benefits of leucine, such as improved muscle recovery and maintenance, which further boosts its popularity in the food industry. As dietary trends continue to emphasize protein-rich diets and nutritional fortification, the Food Grade leucine segment is expected to maintain its leading position in the market, driven by ongoing product innovation and consumer demand for healthier food options.
Leucine Market Share Analysis: Pharmaceuticals is the fastest growing segment over the forecast period to 2032
The Pharmaceuticals segment is poised for significant growth in the Leucine market up to 2032. Leucine's pharmaceutical applications are gaining traction due to its role as a branched-chain amino acid crucial for protein synthesis and muscle tissue repair. In pharmaceutical formulations, leucine serves as an essential component in medications aimed at treating muscle wasting disorders, metabolic disorders, and promoting wound healing. The segment's growth is driven by ongoing research and development efforts to explore leucine's therapeutic benefits beyond its traditional uses in sports nutrition and dietary supplements. Pharmaceutical companies are increasingly incorporating leucine into new drug formulations, leveraging its properties to enhance drug efficacy and patient outcomes. Further, the aging population and rising prevalence of chronic diseases globally are further propelling demand for pharmaceutical products containing leucine. Regulatory approvals and clinical trials focusing on leucine's efficacy in various therapeutic applications are expected to accelerate market growth in this segment, making it a key area of investment and innovation within the broader leucine market landscape.
Leucine Market Segmentation
By Type
Food Grade
Feed Grade
Pharmaceutical Grade
By Application
Food
Feed
Pharmaceuticals
Countries Analyzed
North America (US, Canada, Mexico)
Europe (Germany, UK, France, Spain, Italy, Russia, Rest of Europe)
Asia Pacific (China, India, Japan, South Korea, Australia, South East Asia, Rest of Asia)
South America (Brazil, Argentina, Rest of South America)
Middle East and Africa (Saudi Arabia, UAE, Rest of Middle East, South Africa, Egypt, Rest of Africa)
Leucine Companies Profiled in the Study
Ajinomoto Group
ChuyuanGroup
CJ
Evonik industries AG
Hubei Bafeng Pharmaceutical
Jiahe Biotech
JiangsuShenhua Pharmaceutical
Jinghai Amino Acid
JIRONG PHARM
KYOWA
Siwei Amino Acid
Zhangjiagangxingyu Technology
*- List Not Exhaustive
Chapter 1. TABLE OF CONTENTS
Chapter 2. Introduction to Leucine Market
2.1. Market Overview
2.2. Key Statistics and Report Highlights
2.3. Scope of the Comprehensive Study
2.3.1. Market Definition
2.3.2 Countries and Regions Covered
2.3.3 Research Objective
2.3.4 Units, Currency, and Conversions
2.3.5 Industry Value Chain
2.4. Key Market Segments
2.5. Key Companies
2.6. Study Period
Chapter 3. Strategic Analysis Review
3.1. Leucine Pricing Analysis and Forecast
3.2. Porter’s Five Forces
3.3. Market Ecosystem
3.4. SWOT Analysis
3.5. Regulatory Scenario
3.3. Effects of Inflation, Russia-Ukraine War, moderating economic growth, and other macroeconomic factors
Chapter 4. Competitive Landscape
4.1. Market Share Analysis
4.1.1. Global Leucine Market Share by Company, 2023
4.1.2. Product Offerings of Leading Leucine Companies
4.2. Market Entropy
4.2.1. New Product Launches in the Industry
4.2.2. Mergers, Acquisitions, Joint ventures, and Partnerships
4.3. Key Strategies and Best Practices
Chapter 5. Global Market Projections: Best, Reference, and Low Case Scenarios
5.1. Growth Analysis- Case Scenario Definitions
5.2. Low Growth Case Scenario Forecasts
5.3. Reference Growth Case Scenario Forecasts
5.4. High Growth Case Scenario Forecasts
Chapter 6. Market Dynamics
6.1. Leucine Market Drivers
6.2. Leucine Market Challenges
6.6. Leucine Market Opportunities
6.4. Leucine Market Trends
Chapter 7. Global Leucine Market Outlook Trends
7.1. Global Leucine Revenue (USD Million) and CAGR (%) by Type (2021-2032)
7.2. Global Leucine Revenue (USD Million) and CAGR (%) by Application (2021-2032)
7.3. Global Leucine Revenue (USD Million) and CAGR (%) by Product (2021-2032)
By Type
Food Grade
Feed Grade
Pharmaceutical Grade
By Application
Food
Feed
Pharmaceuticals
Chapter 8. Global Leucine Regional Analysis and Outlook
8.1. Global Leucine Revenue (USD Million) By Regions (2021- 2032)
8.2. North America Leucine Revenue (USD Million) by Country (2021-2032)
8.2.1. United States Leucine Regional Analysis and Outlook
8.2.2. Canada Leucine Regional Analysis and Outlook
8.2.3. Mexico Leucine Regional Analysis and Outlook
8.3. Europe Leucine Revenue (USD Million), by Country (2021-2032)
8.3.1. Germany Leucine Regional Analysis and Outlook
8.3.2. France Leucine Regional Analysis and Outlook
8.3.3. United Kingdom Leucine Regional Analysis and Outlook
8.3.4. Spain Leucine Regional Analysis and Outlook
8.3.5. Italy Leucine Regional Analysis and Outlook
8.3.6. Russia Leucine Regional Analysis and Outlook
8.3.7. Rest of Europe Leucine Regional Analysis and Outlook
8.4. Asia Pacific Leucine Revenue (USD Million) by Country (2021-2032)
8.4.1. China Leucine Regional Analysis and Outlook
8.4.2. Japan Leucine Regional Analysis and Outlook
8.4.3. India Leucine Regional Analysis and Outlook
8.4.4. South Korea Leucine Regional Analysis and Outlook
8.4.5. Australia Leucine Regional Analysis and Outlook
8.4.6. South East Asia Leucine Regional Analysis and Outlook
8.4.7. Rest of Asia Pacific Leucine Regional Analysis and Outlook
8.5. South America Leucine Revenue (USD Million), by Country (2021-2032)
8.5.1. Brazil Leucine Regional Analysis and Outlook
8.5.2. Argentina Leucine Regional Analysis and Outlook
8.5.3. Rest of South America Leucine Regional Analysis and Outlook
8.6. Middle East and Africa Leucine Revenue (USD Million) by Country (2021-2032)
8.6.1. Middle East Leucine Regional Analysis and Outlook
8.6.2. Africa Leucine Regional Analysis and Outlook
Chapter 9. North America Leucine Analysis and Outlook
9.1. North America Leucine Revenue (USD Million) by Segments (2021-2032)
9.1.1. North America Leucine Revenue (USD Million) by Type (2021-2032)
9.1.2. North America Leucine Revenue (USD Million) by Application (2021-2032)
9.1.3. North America Leucine Revenue (USD Million) by Product (2021-2032)
By Type
Food Grade
Feed Grade
Pharmaceutical Grade
By Application
Food
Feed
Pharmaceuticals
Chapter 10. Europe Leucine Analysis and Outlook
10.1. Europe Leucine Revenue (USD Million), by Segments (USD Million) (2021-2032)
10.1.1. Europe Leucine Revenue (USD Million) by Type (2021-2032)
10.1.2. Europe Leucine Revenue (USD Million) by Application (2021-2032)
10.1.3. Europe Leucine Revenue (USD Million) by Product (2021-2032)
By Type
Food Grade
Feed Grade
Pharmaceutical Grade
By Application
Food
Feed
Pharmaceuticals
Chapter 11. Asia Pacific Leucine Analysis and Outlook
11.1. Asia Pacific Leucine Revenue (USD Million), and Revenue (USD Million) by Segments (2021-2032)
11.1.1. Asia Pacific Leucine Revenue (USD Million) by Type (2021-2032)
11.1.2. Asia Pacific Leucine Revenue (USD Million) by Application (2021-2032)
11.1.3. Asia Pacific Leucine Revenue (USD Million) by Product (2021-2032)
By Type
Food Grade
Feed Grade
Pharmaceutical Grade
By Application
Food
Feed
Pharmaceuticals
Chapter 12. South America Leucine Analysis and Outlook
12.1. South America Leucine Revenue (USD Million), by Segments (2021-2032)
12.1.1. South America Leucine Revenue (USD Million) by Type (2021-2032)
12.1.2. South America Leucine Revenue (USD Million) by Application (2021-2032)
12.1.3. South America Leucine Revenue (USD Million) by Product (2021-2032)
By Type
Food Grade
Feed Grade
Pharmaceutical Grade
By Application
Food
Feed
Pharmaceuticals
Chapter 13. Middle East and Africa Leucine Analysis and Outlook
13.1. Middle East and Africa Leucine Revenue (USD Million), by Segments (2021-2032)
13.1.1. Middle East and Africa Leucine Revenue (USD Million) by Type (2021-2032)
13.1.2. Middle East and Africa Leucine Revenue (USD Million) by Application (2021-2032)
13.1.3. Middle East and Africa Leucine Revenue (USD Million) by Product (2021-2032)
By Type
Food Grade
Feed Grade
Pharmaceutical Grade
By Application
Food
Feed
Pharmaceuticals
Chapter 14. Leucine Company Profiles
14.1 Business Overview
14.2 Product Profiles
14.3 SWOT Profiles
14.5 Recent Developments
14.6 Financial Profile
List of Companies
Ajinomoto Group
ChuyuanGroup
CJ
Evonik industries AG
Hubei Bafeng Pharmaceutical
Jiahe Biotech
JiangsuShenhua Pharmaceutical
Jinghai Amino Acid
JIRONG PHARM
KYOWA
Siwei Amino Acid
Zhangjiagangxingyu Technology
15. Methodology and Data Sources
15.1 Customization Offerings
15.2 Subscription Services
15.3 Related Reports
15.4 Publisher Expertise
LIST OF TABLES
Table 1 Market Segmentation Analysis
Table 2 Global Leucine Market Share of Leading Companies, 2023
Table 3 Product Offerings of Leading Companies
Table 4 Low Growth Scenario Forecasts
Table 5 Reference Case Growth Scenario
Table 6 High Growth Case Scenario
Table 7 Global Leucine Revenue (USD Million) And CAGR (%) By Type (2021-2032)
Table 8 Global Leucine Revenue (USD Million) And CAGR (%) By Application (2021-2032)
Table 9 Global Leucine Revenue (USD Million) And CAGR (%) By Product (2021-2032)
Table 10 Global Leucine Market Revenue (USD Million) By Regions (2021-2032)
Table 11 Global Leucine Market Share (%) By Regions (2021-2032)
Table 12 North America Leucine Revenue (USD Million) By Country (2021-2032)
Table 13 Europe Leucine Revenue (USD Million) By Country (2021-2032)
Table 14 Asia Pacific Leucine Revenue (USD Million) By Country (2021-2032)
Table 15 South America Leucine Revenue (USD Million) By Country (2021-2032)
Table 16 Middle East and Africa Leucine Revenue (USD Million) By Region (2021-2032)
Table 17 North America Leucine Revenue (USD Million) By Type (2021-2032)
Table 18 North America Leucine Revenue (USD Million) By Application (2021-2032)
Table 19 North America Leucine Revenue (USD Million) By Product (2021-2032)
Table 20 Europe Leucine Revenue (USD Million) By Type (2021-2032)
Table 21 Europe Leucine Revenue (USD Million) By Application (2021-2032)
Table 22 Europe Leucine Revenue (USD Million) By Product (2021-2032)
Table 23 Asia Pacific Leucine Revenue (USD Million) By Type (2021-2032)
Table 24 Asia Pacific Leucine Revenue (USD Million) By Application (2021-2032)
Table 25 Asia Pacific Leucine Revenue (USD Million) By Product (2021-2032)
Table 26 South America Leucine Revenue (USD Million) By Type (2021-2032)
Table 27 South America Leucine Revenue (USD Million) By Application (2021-2032)
Table 28 South America Leucine Revenue (USD Million) By Product (2021-2032)
Table 29 Middle East and Africa Leucine Revenue (USD Million) By Type (2021-2032)
Table 30 Middle East and Africa Leucine Revenue (USD Million) By Application (2021-2032)
Table 31 Middle East and Africa Leucine Revenue (USD Million) By Product (2021-2032)
LIST OF FIGURES
Figure 1. Market Scope
Figure 2. Pricing Forecasts Per Unit, 2023- 2032
Figure 3. Porter’s Five Forces
Figure 4. Global Leucine Market Revenue (USD Million) By Regions (2021-2032)
Figure 5. Global Leucine Market Share (%) By Regions (2023)
Figure 6. North America Leucine Revenue (USD Million) By Country (2021-2032)
Figure 7. United States Leucine Revenue (USD Million) By Country (2021-2032)
Figure 8. Canada Leucine Revenue (USD Million) By Country (2021-2032)
Figure 9. Mexico Leucine Revenue (USD Million) By Country (2021-2032)
Figure 10. Europe Leucine Revenue (USD Million) By Country (2021-2032)
Figure 11. Germany Leucine Revenue (USD Million) By Country (2021-2032)
Figure 12. France Leucine Revenue (USD Million) By Country (2021-2032)
Figure 13. United Kingdom Leucine Revenue (USD Million) By Country (2021-2032)
Figure 14. Spain Leucine Revenue (USD Million) By Country (2021-2032)
Figure 15. Italy Leucine Revenue (USD Million) By Country (2021-2032)
Figure 16. Russia Leucine Revenue (USD Million) By Country (2021-2032)
Figure 17. Rest of Europe Leucine Revenue (USD Million) By Country (2021-2032)
Figure 11. Asia Pacific Leucine Revenue (USD Million) By Country (2021-2032)
Figure 12. China Leucine Revenue (USD Million) By Country (2021-2032)
Figure 13. Japan Leucine Revenue (USD Million) By Country (2021-2032)
Figure 14. India Leucine Revenue (USD Million) By Country (2021-2032)
Figure 15. South Korea Leucine Revenue (USD Million) By Country (2021-2032)
Figure 16. Australia Leucine Revenue (USD Million) By Country (2021-2032)
Figure 17. South East Asia Leucine Revenue (USD Million) By Country (2021-2032)
Figure 18. South America Leucine Revenue (USD Million) By Country (2021-2032)
Figure 19. Brazil Leucine Revenue (USD Million) By Country (2021-2032)
Figure 20. Argentina Leucine Revenue (USD Million) By Country (2021-2032)
Figure 21. Rest of Asia Pacific Leucine Revenue (USD Million) By Country (2021-2032)
Figure 22. Middle East and Africa Leucine Revenue (USD Million) By Region (2021-2032)
Figure 23. Saudi Arabia Leucine Revenue (USD Million) By Region (2021-2032)
Figure 24. The UAE Leucine Revenue (USD Million) By Region (2021-2032)
Figure 25. Rest of Middle East Leucine Revenue (USD Million) By Region (2021-2032)
Figure 26. South Africa Leucine Revenue (USD Million) By Region (2021-2032)
Figure 27. Africa Leucine Revenue (USD Million) By Region (2021-2032)
Figure 28. North America Leucine Revenue (USD Million) By Type (2021-2032)
Figure 29. North America Leucine Revenue (USD Million) By Application (2021-2032)
Figure 30. North America Leucine Revenue (USD Million) By Product (2021-2032)
Figure 31. Europe Leucine Revenue (USD Million) By Type (2021-2032)
Figure 32. Europe Leucine Revenue (USD Million) By Application (2021-2032)
Figure 33. Europe Leucine Revenue (USD Million) By Product (2021-2032)
Figure 34. Asia Pacific Leucine Revenue (USD Million) By Type (2021-2032)
Figure 35. Asia Pacific Leucine Revenue (USD Million) By Application (2021-2032)
Figure 36. Asia Pacific Leucine Revenue (USD Million) By Product (2021-2032)
Figure 37. South America Leucine Revenue (USD Million) By Type (2021-2032)
Figure 38. South America Leucine Revenue (USD Million) By Application (2021-2032)
Figure 39. South America Leucine Revenue (USD Million) By Product (2021-2032)
Figure 40. Middle East and Africa Leucine Revenue (USD Million) By Type (2021-2032)
Figure 41. Middle East and Africa Leucine Revenue (USD Million) By Application (2021-2032)
Figure 42. Middle East and Africa Leucine Revenue (USD Million) By Product (2021-2032)
By Type
Food Grade
Feed Grade
Pharmaceutical Grade
By Application
Food
Feed
Pharmaceuticals
Countries Analyzed
North America (US, Canada, Mexico)
Europe (Germany, UK, France, Spain, Italy, Russia, Rest of Europe)
Asia Pacific (China, India, Japan, South Korea, Australia, South East Asia, Rest of Asia)
South America (Brazil, Argentina, Rest of South America)
Middle East and Africa (Saudi Arabia, UAE, Rest of Middle East, South Africa, Egypt, Rest of Africa)
