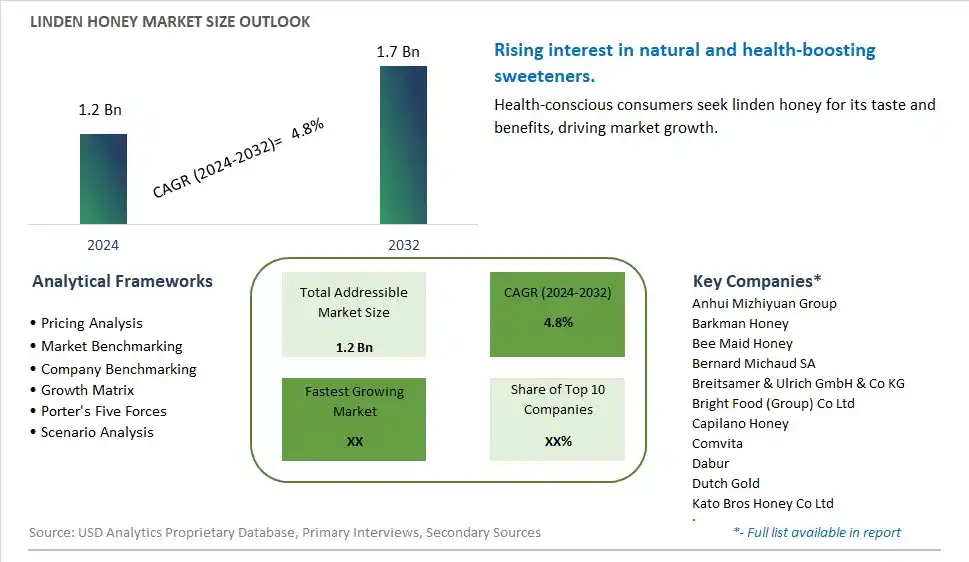
Global Linden Honey Market Size is valued at $1.2 Billion in 2024 and is forecast to register a growth rate (CAGR) of 4.8% to reach $1.7 Billion by 2032.
The global Linden Honey Market Comprehensive Study analyzes and forecasts the market size across 6 regions and 24 countries for diverse segments -By Type (Bottle Packaging, Jar Packaging, Others), By Application (Supermarkets/Hypermarkets, Convenience Stores, Specialty Stores, Online, Others)
An Introduction to Linden Honey Market
In 2024, the linden honey market is expanding, driven by the rising demand for natural and specialty honey products. Linden honey, known for its light color and delicate flavor, is prized for its medicinal properties and use in gourmet foods. The market benefits from increasing consumer awareness of the health benefits associated with honey and the trend towards natural and clean label products. Innovations in sustainable beekeeping and honey production are enhancing product quality and supply. The popularity of functional foods and the rise of health-conscious lifestyles are further propelling demand for linden honey.
Linden Honey Competitive Landscape
The market report analyses the leading companies in the industry including Anhui Mizhiyuan Group, Barkman Honey, Bee Maid Honey, Bernard Michaud SA, Breitsamer & Ulrich GmbH & Co KG, Bright Food (Group) Co Ltd, Capilano Honey, Comvita, Dabur, Dutch Gold, Kato Bros Honey Co Ltd, Langnese, Manuka Health, Nature Nate's, New Zealand Honey Co., Rowse, Sioux Honey Association, Sunbulah Group, Wellness Foods Ltd, and Others.
Linden Honey Market Dynamics
Linden Honey Market Trend: Increasing Demand for Premium and Organic Honey
The most prominent trend in the Linden Honey Market is the increasing demand for premium and organic honey. Linden honey, known for its delicate flavor and potential health benefits, is gaining popularity among consumers seeking high-quality and natural sweeteners. This trend is driven by the growing appreciation for artisanal food products and the preference for organic and sustainably sourced ingredients.
Linden Honey Market Driver: Health Benefits and Natural Sweeteners
A key driver in the Linden Honey Market is the health benefits and demand for natural sweeteners. Linden honey is rich in antioxidants, vitamins, and minerals, making it a healthier alternative to refined sugar. As consumers become more health-conscious, the demand for natural and nutritious sweeteners like linden honey continues to rise.
Linden Honey Market Opportunity: Development of Value-Added Honey Products
One significant opportunity in the Linden Honey Market lies in the development of value-added honey products. Companies can innovate by creating new linden honey-based products, such as infused honey, honey spreads, and honey-based skincare items. By offering a variety of value-added products, manufacturers can attract health-conscious consumers and expand their market presence.
Linden Honey Market Share Analysis: Jar Packaging segment generated the highest revenue share in the industry
The largest segment in the Linden Honey market, categorized by packaging type, is Jar Packaging. This segment encompasses honey packaged in jars of various sizes, catering to consumer preferences for convenience, visibility, and preservation of honey's natural qualities. Jar packaging is favored for its transparency, allowing consumers to inspect the honey's color and texture before purchase, which is especially important for premium and specialty honey varieties like Linden honey. Further, jars offer a secure and airtight seal, preserving the honey's freshness and preventing contamination, thereby maintaining its nutritional and medicinal properties. The growth of jar packaging in the Linden Honey market is driven by increasing consumer awareness of honey's health benefits, rising demand for natural sweeteners, and preferences for products with minimal processing and additives. Furthermore, the appeal of jar packaging extends to its recyclability and eco-friendliness, aligning with growing consumer concerns about sustainability and environmental impact. As the market continues to evolve, innovations in jar design and materials contribute to enhancing shelf appeal and product differentiation, further fueling the segment's growth within the global honey market landscape.
Linden Honey Market Share Analysis: Online is the fastest growing segment over the forecast period to 2032
Among the segments in the Linden Honey market categorized by application, Online sales show the fastest growth trajectory leading up to 2032. The shift towards online platforms for purchasing Linden honey reflects broader consumer trends favoring convenience, accessibility, and a diverse product selection. Online channels provide consumers with the ability to research, compare prices, and read reviews easily, which enhances transparency and trust in product quality, particularly for premium honey varieties like Linden honey. Further, the convenience of doorstep delivery and the expanding reach of e-commerce platforms enable honey producers and retailers to tap into global markets, reaching a wider audience beyond traditional retail boundaries. The growth in online sales is bolstered by increasing internet penetration, smartphone usage, and the growing preference for shopping from home, especially in the wake of global events that have accelerated digital adoption. As online retail continues to evolve with improved logistics and customer service, it is poised to significantly contribute to the expansion of the Linden honey market, offering both consumers and producers new opportunities for growth and engagement.
Linden Honey Market Segmentation
By Type
Bottle Packaging
Jar Packaging
Others
By Application
Supermarkets/Hypermarkets
Convenience Stores
Specialty Stores
Online
Others
Countries Analyzed
North America (US, Canada, Mexico)
Europe (Germany, UK, France, Spain, Italy, Russia, Rest of Europe)
Asia Pacific (China, India, Japan, South Korea, Australia, South East Asia, Rest of Asia)
South America (Brazil, Argentina, Rest of South America)
Middle East and Africa (Saudi Arabia, UAE, Rest of Middle East, South Africa, Egypt, Rest of Africa)
Linden Honey Companies Profiled in the Study
Anhui Mizhiyuan Group
Barkman Honey
Bee Maid Honey
Bernard Michaud SA
Breitsamer & Ulrich GmbH & Co KG
Bright Food (Group) Co Ltd
Capilano Honey
Comvita
Dabur
Dutch Gold
Kato Bros Honey Co Ltd
Langnese
Manuka Health
Nature Nate's
New Zealand Honey Co.
Rowse
Sioux Honey Association
Sunbulah Group
Wellness Foods Ltd
*- List Not Exhaustive
Chapter 1. TABLE OF CONTENTS
Chapter 2. Introduction to Linden Honey Market
2.1. Market Overview
2.2. Key Statistics and Report Highlights
2.3. Scope of the Comprehensive Study
2.3.1. Market Definition
2.3.2 Countries and Regions Covered
2.3.3 Research Objective
2.3.4 Units, Currency, and Conversions
2.3.5 Industry Value Chain
2.4. Key Market Segments
2.5. Key Companies
2.6. Study Period
Chapter 3. Strategic Analysis Review
3.1. Linden Honey Pricing Analysis and Forecast
3.2. Porter’s Five Forces
3.3. Market Ecosystem
3.4. SWOT Analysis
3.5. Regulatory Scenario
3.3. Effects of Inflation, Russia-Ukraine War, moderating economic growth, and other macroeconomic factors
Chapter 4. Competitive Landscape
4.1. Market Share Analysis
4.1.1. Global Linden Honey Market Share by Company, 2023
4.1.2. Product Offerings of Leading Linden Honey Companies
4.2. Market Entropy
4.2.1. New Product Launches in the Industry
4.2.2. Mergers, Acquisitions, Joint ventures, and Partnerships
4.3. Key Strategies and Best Practices
Chapter 5. Global Market Projections: Best, Reference, and Low Case Scenarios
5.1. Growth Analysis- Case Scenario Definitions
5.2. Low Growth Case Scenario Forecasts
5.3. Reference Growth Case Scenario Forecasts
5.4. High Growth Case Scenario Forecasts
Chapter 6. Market Dynamics
6.1. Linden Honey Market Drivers
6.2. Linden Honey Market Challenges
6.6. Linden Honey Market Opportunities
6.4. Linden Honey Market Trends
Chapter 7. Global Linden Honey Market Outlook Trends
7.1. Global Linden Honey Revenue (USD Million) and CAGR (%) by Type (2021-2032)
7.2. Global Linden Honey Revenue (USD Million) and CAGR (%) by Application (2021-2032)
7.3. Global Linden Honey Revenue (USD Million) and CAGR (%) by Product (2021-2032)
By Type
Bottle Packaging
Jar Packaging
Others
By Application
Supermarkets/Hypermarkets
Convenience Stores
Specialty Stores
Online
Others
Chapter 8. Global Linden Honey Regional Analysis and Outlook
8.1. Global Linden Honey Revenue (USD Million) By Regions (2021- 2032)
8.2. North America Linden Honey Revenue (USD Million) by Country (2021-2032)
8.2.1. United States Linden Honey Regional Analysis and Outlook
8.2.2. Canada Linden Honey Regional Analysis and Outlook
8.2.3. Mexico Linden Honey Regional Analysis and Outlook
8.3. Europe Linden Honey Revenue (USD Million), by Country (2021-2032)
8.3.1. Germany Linden Honey Regional Analysis and Outlook
8.3.2. France Linden Honey Regional Analysis and Outlook
8.3.3. United Kingdom Linden Honey Regional Analysis and Outlook
8.3.4. Spain Linden Honey Regional Analysis and Outlook
8.3.5. Italy Linden Honey Regional Analysis and Outlook
8.3.6. Russia Linden Honey Regional Analysis and Outlook
8.3.7. Rest of Europe Linden Honey Regional Analysis and Outlook
8.4. Asia Pacific Linden Honey Revenue (USD Million) by Country (2021-2032)
8.4.1. China Linden Honey Regional Analysis and Outlook
8.4.2. Japan Linden Honey Regional Analysis and Outlook
8.4.3. India Linden Honey Regional Analysis and Outlook
8.4.4. South Korea Linden Honey Regional Analysis and Outlook
8.4.5. Australia Linden Honey Regional Analysis and Outlook
8.4.6. South East Asia Linden Honey Regional Analysis and Outlook
8.4.7. Rest of Asia Pacific Linden Honey Regional Analysis and Outlook
8.5. South America Linden Honey Revenue (USD Million), by Country (2021-2032)
8.5.1. Brazil Linden Honey Regional Analysis and Outlook
8.5.2. Argentina Linden Honey Regional Analysis and Outlook
8.5.3. Rest of South America Linden Honey Regional Analysis and Outlook
8.6. Middle East and Africa Linden Honey Revenue (USD Million) by Country (2021-2032)
8.6.1. Middle East Linden Honey Regional Analysis and Outlook
8.6.2. Africa Linden Honey Regional Analysis and Outlook
Chapter 9. North America Linden Honey Analysis and Outlook
9.1. North America Linden Honey Revenue (USD Million) by Segments (2021-2032)
9.1.1. North America Linden Honey Revenue (USD Million) by Type (2021-2032)
9.1.2. North America Linden Honey Revenue (USD Million) by Application (2021-2032)
9.1.3. North America Linden Honey Revenue (USD Million) by Product (2021-2032)
By Type
Bottle Packaging
Jar Packaging
Others
By Application
Supermarkets/Hypermarkets
Convenience Stores
Specialty Stores
Online
Others
Chapter 10. Europe Linden Honey Analysis and Outlook
10.1. Europe Linden Honey Revenue (USD Million), by Segments (USD Million) (2021-2032)
10.1.1. Europe Linden Honey Revenue (USD Million) by Type (2021-2032)
10.1.2. Europe Linden Honey Revenue (USD Million) by Application (2021-2032)
10.1.3. Europe Linden Honey Revenue (USD Million) by Product (2021-2032)
By Type
Bottle Packaging
Jar Packaging
Others
By Application
Supermarkets/Hypermarkets
Convenience Stores
Specialty Stores
Online
Others
Chapter 11. Asia Pacific Linden Honey Analysis and Outlook
11.1. Asia Pacific Linden Honey Revenue (USD Million), and Revenue (USD Million) by Segments (2021-2032)
11.1.1. Asia Pacific Linden Honey Revenue (USD Million) by Type (2021-2032)
11.1.2. Asia Pacific Linden Honey Revenue (USD Million) by Application (2021-2032)
11.1.3. Asia Pacific Linden Honey Revenue (USD Million) by Product (2021-2032)
By Type
Bottle Packaging
Jar Packaging
Others
By Application
Supermarkets/Hypermarkets
Convenience Stores
Specialty Stores
Online
Others
Chapter 12. South America Linden Honey Analysis and Outlook
12.1. South America Linden Honey Revenue (USD Million), by Segments (2021-2032)
12.1.1. South America Linden Honey Revenue (USD Million) by Type (2021-2032)
12.1.2. South America Linden Honey Revenue (USD Million) by Application (2021-2032)
12.1.3. South America Linden Honey Revenue (USD Million) by Product (2021-2032)
By Type
Bottle Packaging
Jar Packaging
Others
By Application
Supermarkets/Hypermarkets
Convenience Stores
Specialty Stores
Online
Others
Chapter 13. Middle East and Africa Linden Honey Analysis and Outlook
13.1. Middle East and Africa Linden Honey Revenue (USD Million), by Segments (2021-2032)
13.1.1. Middle East and Africa Linden Honey Revenue (USD Million) by Type (2021-2032)
13.1.2. Middle East and Africa Linden Honey Revenue (USD Million) by Application (2021-2032)
13.1.3. Middle East and Africa Linden Honey Revenue (USD Million) by Product (2021-2032)
By Type
Bottle Packaging
Jar Packaging
Others
By Application
Supermarkets/Hypermarkets
Convenience Stores
Specialty Stores
Online
Others
Chapter 14. Linden Honey Company Profiles
14.1 Business Overview
14.2 Product Profiles
14.3 SWOT Profiles
14.5 Recent Developments
14.6 Financial Profile
List of Companies
Anhui Mizhiyuan Group
Barkman Honey
Bee Maid Honey
Bernard Michaud SA
Breitsamer & Ulrich GmbH & Co KG
Bright Food (Group) Co Ltd
Capilano Honey
Comvita
Dabur
Dutch Gold
Kato Bros Honey Co Ltd
Langnese
Manuka Health
Nature Nate's
New Zealand Honey Co.
Rowse
Sioux Honey Association
Sunbulah Group
Wellness Foods Ltd
15. Methodology and Data Sources
15.1 Customization Offerings
15.2 Subscription Services
15.3 Related Reports
15.4 Publisher Expertise
LIST OF TABLES
Table 1 Market Segmentation Analysis
Table 2 Global Linden Honey Market Share of Leading Companies, 2023
Table 3 Product Offerings of Leading Companies
Table 4 Low Growth Scenario Forecasts
Table 5 Reference Case Growth Scenario
Table 6 High Growth Case Scenario
Table 7 Global Linden Honey Revenue (USD Million) And CAGR (%) By Type (2021-2032)
Table 8 Global Linden Honey Revenue (USD Million) And CAGR (%) By Application (2021-2032)
Table 9 Global Linden Honey Revenue (USD Million) And CAGR (%) By Product (2021-2032)
Table 10 Global Linden Honey Market Revenue (USD Million) By Regions (2021-2032)
Table 11 Global Linden Honey Market Share (%) By Regions (2021-2032)
Table 12 North America Linden Honey Revenue (USD Million) By Country (2021-2032)
Table 13 Europe Linden Honey Revenue (USD Million) By Country (2021-2032)
Table 14 Asia Pacific Linden Honey Revenue (USD Million) By Country (2021-2032)
Table 15 South America Linden Honey Revenue (USD Million) By Country (2021-2032)
Table 16 Middle East and Africa Linden Honey Revenue (USD Million) By Region (2021-2032)
Table 17 North America Linden Honey Revenue (USD Million) By Type (2021-2032)
Table 18 North America Linden Honey Revenue (USD Million) By Application (2021-2032)
Table 19 North America Linden Honey Revenue (USD Million) By Product (2021-2032)
Table 20 Europe Linden Honey Revenue (USD Million) By Type (2021-2032)
Table 21 Europe Linden Honey Revenue (USD Million) By Application (2021-2032)
Table 22 Europe Linden Honey Revenue (USD Million) By Product (2021-2032)
Table 23 Asia Pacific Linden Honey Revenue (USD Million) By Type (2021-2032)
Table 24 Asia Pacific Linden Honey Revenue (USD Million) By Application (2021-2032)
Table 25 Asia Pacific Linden Honey Revenue (USD Million) By Product (2021-2032)
Table 26 South America Linden Honey Revenue (USD Million) By Type (2021-2032)
Table 27 South America Linden Honey Revenue (USD Million) By Application (2021-2032)
Table 28 South America Linden Honey Revenue (USD Million) By Product (2021-2032)
Table 29 Middle East and Africa Linden Honey Revenue (USD Million) By Type (2021-2032)
Table 30 Middle East and Africa Linden Honey Revenue (USD Million) By Application (2021-2032)
Table 31 Middle East and Africa Linden Honey Revenue (USD Million) By Product (2021-2032)
LIST OF FIGURES
Figure 1. Market Scope
Figure 2. Pricing Forecasts Per Unit, 2023- 2032
Figure 3. Porter’s Five Forces
Figure 4. Global Linden Honey Market Revenue (USD Million) By Regions (2021-2032)
Figure 5. Global Linden Honey Market Share (%) By Regions (2023)
Figure 6. North America Linden Honey Revenue (USD Million) By Country (2021-2032)
Figure 7. United States Linden Honey Revenue (USD Million) By Country (2021-2032)
Figure 8. Canada Linden Honey Revenue (USD Million) By Country (2021-2032)
Figure 9. Mexico Linden Honey Revenue (USD Million) By Country (2021-2032)
Figure 10. Europe Linden Honey Revenue (USD Million) By Country (2021-2032)
Figure 11. Germany Linden Honey Revenue (USD Million) By Country (2021-2032)
Figure 12. France Linden Honey Revenue (USD Million) By Country (2021-2032)
Figure 13. United Kingdom Linden Honey Revenue (USD Million) By Country (2021-2032)
Figure 14. Spain Linden Honey Revenue (USD Million) By Country (2021-2032)
Figure 15. Italy Linden Honey Revenue (USD Million) By Country (2021-2032)
Figure 16. Russia Linden Honey Revenue (USD Million) By Country (2021-2032)
Figure 17. Rest of Europe Linden Honey Revenue (USD Million) By Country (2021-2032)
Figure 11. Asia Pacific Linden Honey Revenue (USD Million) By Country (2021-2032)
Figure 12. China Linden Honey Revenue (USD Million) By Country (2021-2032)
Figure 13. Japan Linden Honey Revenue (USD Million) By Country (2021-2032)
Figure 14. India Linden Honey Revenue (USD Million) By Country (2021-2032)
Figure 15. South Korea Linden Honey Revenue (USD Million) By Country (2021-2032)
Figure 16. Australia Linden Honey Revenue (USD Million) By Country (2021-2032)
Figure 17. South East Asia Linden Honey Revenue (USD Million) By Country (2021-2032)
Figure 18. South America Linden Honey Revenue (USD Million) By Country (2021-2032)
Figure 19. Brazil Linden Honey Revenue (USD Million) By Country (2021-2032)
Figure 20. Argentina Linden Honey Revenue (USD Million) By Country (2021-2032)
Figure 21. Rest of Asia Pacific Linden Honey Revenue (USD Million) By Country (2021-2032)
Figure 22. Middle East and Africa Linden Honey Revenue (USD Million) By Region (2021-2032)
Figure 23. Saudi Arabia Linden Honey Revenue (USD Million) By Region (2021-2032)
Figure 24. The UAE Linden Honey Revenue (USD Million) By Region (2021-2032)
Figure 25. Rest of Middle East Linden Honey Revenue (USD Million) By Region (2021-2032)
Figure 26. South Africa Linden Honey Revenue (USD Million) By Region (2021-2032)
Figure 27. Africa Linden Honey Revenue (USD Million) By Region (2021-2032)
Figure 28. North America Linden Honey Revenue (USD Million) By Type (2021-2032)
Figure 29. North America Linden Honey Revenue (USD Million) By Application (2021-2032)
Figure 30. North America Linden Honey Revenue (USD Million) By Product (2021-2032)
Figure 31. Europe Linden Honey Revenue (USD Million) By Type (2021-2032)
Figure 32. Europe Linden Honey Revenue (USD Million) By Application (2021-2032)
Figure 33. Europe Linden Honey Revenue (USD Million) By Product (2021-2032)
Figure 34. Asia Pacific Linden Honey Revenue (USD Million) By Type (2021-2032)
Figure 35. Asia Pacific Linden Honey Revenue (USD Million) By Application (2021-2032)
Figure 36. Asia Pacific Linden Honey Revenue (USD Million) By Product (2021-2032)
Figure 37. South America Linden Honey Revenue (USD Million) By Type (2021-2032)
Figure 38. South America Linden Honey Revenue (USD Million) By Application (2021-2032)
Figure 39. South America Linden Honey Revenue (USD Million) By Product (2021-2032)
Figure 40. Middle East and Africa Linden Honey Revenue (USD Million) By Type (2021-2032)
Figure 41. Middle East and Africa Linden Honey Revenue (USD Million) By Application (2021-2032)
Figure 42. Middle East and Africa Linden Honey Revenue (USD Million) By Product (2021-2032)
By Type
Bottle Packaging
Jar Packaging
Others
By Application
Supermarkets/Hypermarkets
Convenience Stores
Specialty Stores
Online
Others
Countries Analyzed
North America (US, Canada, Mexico)
Europe (Germany, UK, France, Spain, Italy, Russia, Rest of Europe)
Asia Pacific (China, India, Japan, South Korea, Australia, South East Asia, Rest of Asia)
South America (Brazil, Argentina, Rest of South America)
Middle East and Africa (Saudi Arabia, UAE, Rest of Middle East, South Africa, Egypt, Rest of Africa)
