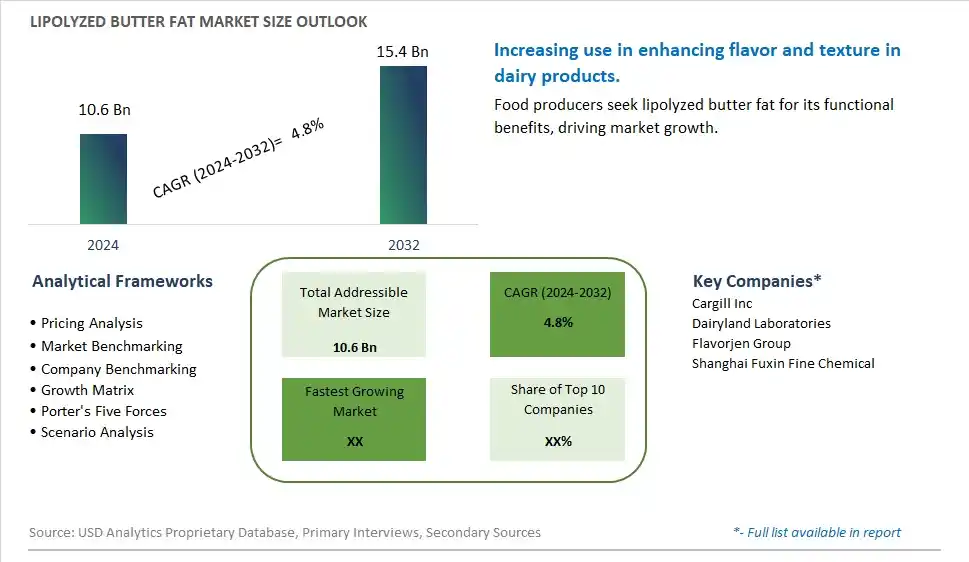
Global Lipolyzed Butter Fat Market Size is valued at $10.6 Billion in 2024 and is forecast to register a growth rate (CAGR) of 4.8% to reach $15.4 Billion by 2032.
The global Lipolyzed Butter Fat Market Comprehensive Study analyzes and forecasts the market size across 6 regions and 24 countries for diverse segments -By Type (Raw Butter, Ultrafine Butter), By Application (Dairy, Confectionaries, Bakery, Others)
An Introduction to Lipolyzed Butter Fat Market
In 2024, the lipolyzed butter fat market is expanding, driven by its extensive use in the food industry for flavor enhancement and texture improvement. Lipolyzed butter fat, produced through the enzymatic hydrolysis of butter fat, offers a rich, buttery flavor and is used in a variety of applications, including baked goods, sauces, and snack foods. The market benefits from innovations in enzyme technology and processing techniques that enhance product quality and consistency. The trend towards clean label and natural ingredients is influencing product development. Increasing demand for premium and gourmet food products is further propelling market growth.
Lipolyzed Butter Fat Competitive Landscape
The market report analyses the leading companies in the industry including Cargill Inc, Dairyland Laboratories, Flavorjen Group, Shanghai Fuxin Fine Chemical, and Others.
Lipolyzed Butter Fat Market Dynamics
Lipolyzed Butter Fat Market Trend: Increasing Use in Food and Beverage Industry
The most prominent trend in the Lipolyzed Butter Fat Market is the increasing use in the food and beverage industry. Lipolyzed butter fat, known for its rich flavor and functional properties, is widely used in a variety of products, including bakery items, confectionery, and dairy products. This trend is driven by the demand for ingredients that enhance flavor and texture in processed foods.
Lipolyzed Butter Fat Market Driver: Growth of the Bakery and Confectionery Sectors
A key driver in the Lipolyzed Butter Fat Market is the growth of the bakery and confectionery sectors. As the consumption of baked goods and sweets continues to rise, there is an increasing need for high-quality ingredients that improve product quality. Lipolyzed butter fat offers benefits such as improved flavor release, mouthfeel, and stability, making it a preferred choice in these industries.
Lipolyzed Butter Fat Market Opportunity: Innovation in Reduced-Fat and Functional Formulations
One significant opportunity in the Lipolyzed Butter Fat Market lies in innovation in reduced-fat and functional formulations. Companies can develop new products that use lipolyzed butter fat to create reduced-fat versions of traditional foods without compromising on taste and texture. Additionally, exploring functional applications, such as incorporating lipolyzed butter fat in health-oriented products, can attract health-conscious consumers and drive market growth.
Lipolyzed Butter Fat Market Share Analysis: Ultrafine Butter segment generated the highest revenue share in the industry
In the Lipolyzed Butter Fat market, the Ultrafine Butter segment emerges as the largest category. Ultrafine butter is a specialized form of butter where the fat particles are finely dispersed, enhancing its ability to blend seamlessly into various food products such as chocolates, baked goods, and confectioneries. This type of butter undergoes a specific manufacturing process to achieve a smoother texture and improved spreadability compared to raw butter. Its popularity in the food industry stems from its ability to impart a rich, creamy flavor while also enhancing the mouthfeel and texture of finished products. The demand for ultrafine butter is driven by the rising consumption of premium and artisanal food items globally, where quality and consistency in taste and texture are paramount. Additionally, as consumer preferences continue to evolve towards indulgent and high-quality food experiences, the ultrafine butter segment is expected to maintain steady growth. Manufacturers are also innovating with new formulations and applications, further expanding the market potential for ultrafine butter across diverse culinary and industrial applications.
Lipolyzed Butter Fat Market Share Analysis: Confectioneries is the fastest growing segment over the forecast period to 2032
Within the Lipolyzed Butter Fat market, the Confectioneries segment stands out as one of the fastest-growing applications to 2032. This segment encompasses a wide range of products such as chocolates, candies, and other sweet treats where lipolyzed butter fat is used to enhance flavor, texture, and shelf-life. Lipolyzed butter fat, due to its unique properties and ability to improve the mouthfeel and creaminess of confectionery products, is increasingly preferred by manufacturers aiming to create premium offerings that appeal to discerning consumers. The growth in this segment is driven by rising consumer demand for indulgent and high-quality confectioneries, especially in emerging markets where disposable incomes are increasing. Additionally, innovations in confectionery formulations that focus on natural ingredients and improved sensory experiences are boosting the adoption of lipolyzed butter fat. As manufacturers continue to innovate and expand their product portfolios to meet evolving consumer preferences, the confectioneries segment is expected to experience robust growth in the coming years, contributing significantly to the overall expansion of the lipolyzed butter fat market.
Lipolyzed Butter Fat Market Segmentation
By Type
Raw Butter
Ultrafine Butter
By Application
Dairy
Confectionaries
Bakery
Others
Countries Analyzed
North America (US, Canada, Mexico)
Europe (Germany, UK, France, Spain, Italy, Russia, Rest of Europe)
Asia Pacific (China, India, Japan, South Korea, Australia, South East Asia, Rest of Asia)
South America (Brazil, Argentina, Rest of South America)
Middle East and Africa (Saudi Arabia, UAE, Rest of Middle East, South Africa, Egypt, Rest of Africa)
Lipolyzed Butter Fat Companies Profiled in the Study
Cargill Inc
Dairyland Laboratories
Flavorjen Group
Shanghai Fuxin Fine Chemical
*- List Not Exhaustive
Chapter 1. TABLE OF CONTENTS
Chapter 2. Introduction to Lipolyzed Butter Fat Market
2.1. Market Overview
2.2. Key Statistics and Report Highlights
2.3. Scope of the Comprehensive Study
2.3.1. Market Definition
2.3.2 Countries and Regions Covered
2.3.3 Research Objective
2.3.4 Units, Currency, and Conversions
2.3.5 Industry Value Chain
2.4. Key Market Segments
2.5. Key Companies
2.6. Study Period
Chapter 3. Strategic Analysis Review
3.1. Lipolyzed Butter Fat Pricing Analysis and Forecast
3.2. Porter’s Five Forces
3.3. Market Ecosystem
3.4. SWOT Analysis
3.5. Regulatory Scenario
3.3. Effects of Inflation, Russia-Ukraine War, moderating economic growth, and other macroeconomic factors
Chapter 4. Competitive Landscape
4.1. Market Share Analysis
4.1.1. Global Lipolyzed Butter Fat Market Share by Company, 2023
4.1.2. Product Offerings of Leading Lipolyzed Butter Fat Companies
4.2. Market Entropy
4.2.1. New Product Launches in the Industry
4.2.2. Mergers, Acquisitions, Joint ventures, and Partnerships
4.3. Key Strategies and Best Practices
Chapter 5. Global Market Projections: Best, Reference, and Low Case Scenarios
5.1. Growth Analysis- Case Scenario Definitions
5.2. Low Growth Case Scenario Forecasts
5.3. Reference Growth Case Scenario Forecasts
5.4. High Growth Case Scenario Forecasts
Chapter 6. Market Dynamics
6.1. Lipolyzed Butter Fat Market Drivers
6.2. Lipolyzed Butter Fat Market Challenges
6.6. Lipolyzed Butter Fat Market Opportunities
6.4. Lipolyzed Butter Fat Market Trends
Chapter 7. Global Lipolyzed Butter Fat Market Outlook Trends
7.1. Global Lipolyzed Butter Fat Revenue (USD Million) and CAGR (%) by Type (2021-2032)
7.2. Global Lipolyzed Butter Fat Revenue (USD Million) and CAGR (%) by Application (2021-2032)
7.3. Global Lipolyzed Butter Fat Revenue (USD Million) and CAGR (%) by Product (2021-2032)
By Type
Raw Butter
Ultrafine Butter
By Application
Dairy
Confectionaries
Bakery
Others
Chapter 8. Global Lipolyzed Butter Fat Regional Analysis and Outlook
8.1. Global Lipolyzed Butter Fat Revenue (USD Million) By Regions (2021- 2032)
8.2. North America Lipolyzed Butter Fat Revenue (USD Million) by Country (2021-2032)
8.2.1. United States Lipolyzed Butter Fat Regional Analysis and Outlook
8.2.2. Canada Lipolyzed Butter Fat Regional Analysis and Outlook
8.2.3. Mexico Lipolyzed Butter Fat Regional Analysis and Outlook
8.3. Europe Lipolyzed Butter Fat Revenue (USD Million), by Country (2021-2032)
8.3.1. Germany Lipolyzed Butter Fat Regional Analysis and Outlook
8.3.2. France Lipolyzed Butter Fat Regional Analysis and Outlook
8.3.3. United Kingdom Lipolyzed Butter Fat Regional Analysis and Outlook
8.3.4. Spain Lipolyzed Butter Fat Regional Analysis and Outlook
8.3.5. Italy Lipolyzed Butter Fat Regional Analysis and Outlook
8.3.6. Russia Lipolyzed Butter Fat Regional Analysis and Outlook
8.3.7. Rest of Europe Lipolyzed Butter Fat Regional Analysis and Outlook
8.4. Asia Pacific Lipolyzed Butter Fat Revenue (USD Million) by Country (2021-2032)
8.4.1. China Lipolyzed Butter Fat Regional Analysis and Outlook
8.4.2. Japan Lipolyzed Butter Fat Regional Analysis and Outlook
8.4.3. India Lipolyzed Butter Fat Regional Analysis and Outlook
8.4.4. South Korea Lipolyzed Butter Fat Regional Analysis and Outlook
8.4.5. Australia Lipolyzed Butter Fat Regional Analysis and Outlook
8.4.6. South East Asia Lipolyzed Butter Fat Regional Analysis and Outlook
8.4.7. Rest of Asia Pacific Lipolyzed Butter Fat Regional Analysis and Outlook
8.5. South America Lipolyzed Butter Fat Revenue (USD Million), by Country (2021-2032)
8.5.1. Brazil Lipolyzed Butter Fat Regional Analysis and Outlook
8.5.2. Argentina Lipolyzed Butter Fat Regional Analysis and Outlook
8.5.3. Rest of South America Lipolyzed Butter Fat Regional Analysis and Outlook
8.6. Middle East and Africa Lipolyzed Butter Fat Revenue (USD Million) by Country (2021-2032)
8.6.1. Middle East Lipolyzed Butter Fat Regional Analysis and Outlook
8.6.2. Africa Lipolyzed Butter Fat Regional Analysis and Outlook
Chapter 9. North America Lipolyzed Butter Fat Analysis and Outlook
9.1. North America Lipolyzed Butter Fat Revenue (USD Million) by Segments (2021-2032)
9.1.1. North America Lipolyzed Butter Fat Revenue (USD Million) by Type (2021-2032)
9.1.2. North America Lipolyzed Butter Fat Revenue (USD Million) by Application (2021-2032)
9.1.3. North America Lipolyzed Butter Fat Revenue (USD Million) by Product (2021-2032)
By Type
Raw Butter
Ultrafine Butter
By Application
Dairy
Confectionaries
Bakery
Others
Chapter 10. Europe Lipolyzed Butter Fat Analysis and Outlook
10.1. Europe Lipolyzed Butter Fat Revenue (USD Million), by Segments (USD Million) (2021-2032)
10.1.1. Europe Lipolyzed Butter Fat Revenue (USD Million) by Type (2021-2032)
10.1.2. Europe Lipolyzed Butter Fat Revenue (USD Million) by Application (2021-2032)
10.1.3. Europe Lipolyzed Butter Fat Revenue (USD Million) by Product (2021-2032)
By Type
Raw Butter
Ultrafine Butter
By Application
Dairy
Confectionaries
Bakery
Others
Chapter 11. Asia Pacific Lipolyzed Butter Fat Analysis and Outlook
11.1. Asia Pacific Lipolyzed Butter Fat Revenue (USD Million), and Revenue (USD Million) by Segments (2021-2032)
11.1.1. Asia Pacific Lipolyzed Butter Fat Revenue (USD Million) by Type (2021-2032)
11.1.2. Asia Pacific Lipolyzed Butter Fat Revenue (USD Million) by Application (2021-2032)
11.1.3. Asia Pacific Lipolyzed Butter Fat Revenue (USD Million) by Product (2021-2032)
By Type
Raw Butter
Ultrafine Butter
By Application
Dairy
Confectionaries
Bakery
Others
Chapter 12. South America Lipolyzed Butter Fat Analysis and Outlook
12.1. South America Lipolyzed Butter Fat Revenue (USD Million), by Segments (2021-2032)
12.1.1. South America Lipolyzed Butter Fat Revenue (USD Million) by Type (2021-2032)
12.1.2. South America Lipolyzed Butter Fat Revenue (USD Million) by Application (2021-2032)
12.1.3. South America Lipolyzed Butter Fat Revenue (USD Million) by Product (2021-2032)
By Type
Raw Butter
Ultrafine Butter
By Application
Dairy
Confectionaries
Bakery
Others
Chapter 13. Middle East and Africa Lipolyzed Butter Fat Analysis and Outlook
13.1. Middle East and Africa Lipolyzed Butter Fat Revenue (USD Million), by Segments (2021-2032)
13.1.1. Middle East and Africa Lipolyzed Butter Fat Revenue (USD Million) by Type (2021-2032)
13.1.2. Middle East and Africa Lipolyzed Butter Fat Revenue (USD Million) by Application (2021-2032)
13.1.3. Middle East and Africa Lipolyzed Butter Fat Revenue (USD Million) by Product (2021-2032)
By Type
Raw Butter
Ultrafine Butter
By Application
Dairy
Confectionaries
Bakery
Others
Chapter 14. Lipolyzed Butter Fat Company Profiles
14.1 Business Overview
14.2 Product Profiles
14.3 SWOT Profiles
14.5 Recent Developments
14.6 Financial Profile
List of Companies
Cargill Inc
Dairyland Laboratories
Flavorjen Group
Shanghai Fuxin Fine Chemical
15. Methodology and Data Sources
15.1 Customization Offerings
15.2 Subscription Services
15.3 Related Reports
15.4 Publisher Expertise
LIST OF TABLES
Table 1 Market Segmentation Analysis
Table 2 Global Lipolyzed Butter Fat Market Share of Leading Companies, 2023
Table 3 Product Offerings of Leading Companies
Table 4 Low Growth Scenario Forecasts
Table 5 Reference Case Growth Scenario
Table 6 High Growth Case Scenario
Table 7 Global Lipolyzed Butter Fat Revenue (USD Million) And CAGR (%) By Type (2021-2032)
Table 8 Global Lipolyzed Butter Fat Revenue (USD Million) And CAGR (%) By Application (2021-2032)
Table 9 Global Lipolyzed Butter Fat Revenue (USD Million) And CAGR (%) By Product (2021-2032)
Table 10 Global Lipolyzed Butter Fat Market Revenue (USD Million) By Regions (2021-2032)
Table 11 Global Lipolyzed Butter Fat Market Share (%) By Regions (2021-2032)
Table 12 North America Lipolyzed Butter Fat Revenue (USD Million) By Country (2021-2032)
Table 13 Europe Lipolyzed Butter Fat Revenue (USD Million) By Country (2021-2032)
Table 14 Asia Pacific Lipolyzed Butter Fat Revenue (USD Million) By Country (2021-2032)
Table 15 South America Lipolyzed Butter Fat Revenue (USD Million) By Country (2021-2032)
Table 16 Middle East and Africa Lipolyzed Butter Fat Revenue (USD Million) By Region (2021-2032)
Table 17 North America Lipolyzed Butter Fat Revenue (USD Million) By Type (2021-2032)
Table 18 North America Lipolyzed Butter Fat Revenue (USD Million) By Application (2021-2032)
Table 19 North America Lipolyzed Butter Fat Revenue (USD Million) By Product (2021-2032)
Table 20 Europe Lipolyzed Butter Fat Revenue (USD Million) By Type (2021-2032)
Table 21 Europe Lipolyzed Butter Fat Revenue (USD Million) By Application (2021-2032)
Table 22 Europe Lipolyzed Butter Fat Revenue (USD Million) By Product (2021-2032)
Table 23 Asia Pacific Lipolyzed Butter Fat Revenue (USD Million) By Type (2021-2032)
Table 24 Asia Pacific Lipolyzed Butter Fat Revenue (USD Million) By Application (2021-2032)
Table 25 Asia Pacific Lipolyzed Butter Fat Revenue (USD Million) By Product (2021-2032)
Table 26 South America Lipolyzed Butter Fat Revenue (USD Million) By Type (2021-2032)
Table 27 South America Lipolyzed Butter Fat Revenue (USD Million) By Application (2021-2032)
Table 28 South America Lipolyzed Butter Fat Revenue (USD Million) By Product (2021-2032)
Table 29 Middle East and Africa Lipolyzed Butter Fat Revenue (USD Million) By Type (2021-2032)
Table 30 Middle East and Africa Lipolyzed Butter Fat Revenue (USD Million) By Application (2021-2032)
Table 31 Middle East and Africa Lipolyzed Butter Fat Revenue (USD Million) By Product (2021-2032)
LIST OF FIGURES
Figure 1. Market Scope
Figure 2. Pricing Forecasts Per Unit, 2023- 2032
Figure 3. Porter’s Five Forces
Figure 4. Global Lipolyzed Butter Fat Market Revenue (USD Million) By Regions (2021-2032)
Figure 5. Global Lipolyzed Butter Fat Market Share (%) By Regions (2023)
Figure 6. North America Lipolyzed Butter Fat Revenue (USD Million) By Country (2021-2032)
Figure 7. United States Lipolyzed Butter Fat Revenue (USD Million) By Country (2021-2032)
Figure 8. Canada Lipolyzed Butter Fat Revenue (USD Million) By Country (2021-2032)
Figure 9. Mexico Lipolyzed Butter Fat Revenue (USD Million) By Country (2021-2032)
Figure 10. Europe Lipolyzed Butter Fat Revenue (USD Million) By Country (2021-2032)
Figure 11. Germany Lipolyzed Butter Fat Revenue (USD Million) By Country (2021-2032)
Figure 12. France Lipolyzed Butter Fat Revenue (USD Million) By Country (2021-2032)
Figure 13. United Kingdom Lipolyzed Butter Fat Revenue (USD Million) By Country (2021-2032)
Figure 14. Spain Lipolyzed Butter Fat Revenue (USD Million) By Country (2021-2032)
Figure 15. Italy Lipolyzed Butter Fat Revenue (USD Million) By Country (2021-2032)
Figure 16. Russia Lipolyzed Butter Fat Revenue (USD Million) By Country (2021-2032)
Figure 17. Rest of Europe Lipolyzed Butter Fat Revenue (USD Million) By Country (2021-2032)
Figure 11. Asia Pacific Lipolyzed Butter Fat Revenue (USD Million) By Country (2021-2032)
Figure 12. China Lipolyzed Butter Fat Revenue (USD Million) By Country (2021-2032)
Figure 13. Japan Lipolyzed Butter Fat Revenue (USD Million) By Country (2021-2032)
Figure 14. India Lipolyzed Butter Fat Revenue (USD Million) By Country (2021-2032)
Figure 15. South Korea Lipolyzed Butter Fat Revenue (USD Million) By Country (2021-2032)
Figure 16. Australia Lipolyzed Butter Fat Revenue (USD Million) By Country (2021-2032)
Figure 17. South East Asia Lipolyzed Butter Fat Revenue (USD Million) By Country (2021-2032)
Figure 18. South America Lipolyzed Butter Fat Revenue (USD Million) By Country (2021-2032)
Figure 19. Brazil Lipolyzed Butter Fat Revenue (USD Million) By Country (2021-2032)
Figure 20. Argentina Lipolyzed Butter Fat Revenue (USD Million) By Country (2021-2032)
Figure 21. Rest of Asia Pacific Lipolyzed Butter Fat Revenue (USD Million) By Country (2021-2032)
Figure 22. Middle East and Africa Lipolyzed Butter Fat Revenue (USD Million) By Region (2021-2032)
Figure 23. Saudi Arabia Lipolyzed Butter Fat Revenue (USD Million) By Region (2021-2032)
Figure 24. The UAE Lipolyzed Butter Fat Revenue (USD Million) By Region (2021-2032)
Figure 25. Rest of Middle East Lipolyzed Butter Fat Revenue (USD Million) By Region (2021-2032)
Figure 26. South Africa Lipolyzed Butter Fat Revenue (USD Million) By Region (2021-2032)
Figure 27. Africa Lipolyzed Butter Fat Revenue (USD Million) By Region (2021-2032)
Figure 28. North America Lipolyzed Butter Fat Revenue (USD Million) By Type (2021-2032)
Figure 29. North America Lipolyzed Butter Fat Revenue (USD Million) By Application (2021-2032)
Figure 30. North America Lipolyzed Butter Fat Revenue (USD Million) By Product (2021-2032)
Figure 31. Europe Lipolyzed Butter Fat Revenue (USD Million) By Type (2021-2032)
Figure 32. Europe Lipolyzed Butter Fat Revenue (USD Million) By Application (2021-2032)
Figure 33. Europe Lipolyzed Butter Fat Revenue (USD Million) By Product (2021-2032)
Figure 34. Asia Pacific Lipolyzed Butter Fat Revenue (USD Million) By Type (2021-2032)
Figure 35. Asia Pacific Lipolyzed Butter Fat Revenue (USD Million) By Application (2021-2032)
Figure 36. Asia Pacific Lipolyzed Butter Fat Revenue (USD Million) By Product (2021-2032)
Figure 37. South America Lipolyzed Butter Fat Revenue (USD Million) By Type (2021-2032)
Figure 38. South America Lipolyzed Butter Fat Revenue (USD Million) By Application (2021-2032)
Figure 39. South America Lipolyzed Butter Fat Revenue (USD Million) By Product (2021-2032)
Figure 40. Middle East and Africa Lipolyzed Butter Fat Revenue (USD Million) By Type (2021-2032)
Figure 41. Middle East and Africa Lipolyzed Butter Fat Revenue (USD Million) By Application (2021-2032)
Figure 42. Middle East and Africa Lipolyzed Butter Fat Revenue (USD Million) By Product (2021-2032)
By Type
Raw Butter
Ultrafine Butter
By Application
Dairy
Confectionaries
Bakery
Others
Countries Analyzed
North America (US, Canada, Mexico)
Europe (Germany, UK, France, Spain, Italy, Russia, Rest of Europe)
Asia Pacific (China, India, Japan, South Korea, Australia, South East Asia, Rest of Asia)
South America (Brazil, Argentina, Rest of South America)
Middle East and Africa (Saudi Arabia, UAE, Rest of Middle East, South Africa, Egypt, Rest of Africa)
