
The market growth is driven by an increasing Highview Power specializing in Liquid Air Energy Storage (LAES) systems, offering CRYO Battery technology. This involves the liquefaction of air during periods of low demand and subsequent energy release during peak demand. Leading Companies focusing on Grid-Scale Integration and Renewables Synergy, Advancements in Efficiency and Cost Reduction, Decentralized and Microgrid Applications, and others to boost market shares in the industry.
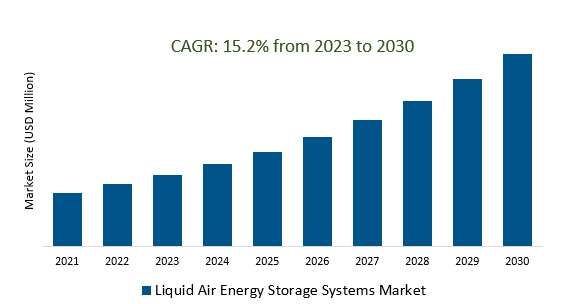
Liquid Air Energy Storage (LAES) involves liquefying air during periods of low electricity demand and releasing it to generate power during high-demand periods. LAES systems offer long-duration storage and scalability, making them suitable for renewable energy integration. However, challenges include lower energy conversion efficiency and infrastructure requirements. Key market players, such as Highview Power, are driving development, with ongoing efforts focused on improving efficiency and reducing costs. Future trends may include deeper integration with power systems and continued technological advancements to address efficiency concerns and expand applications.
Highview Power leads the charge in advancing liquid air energy storage technology with its innovative CRYO Battery. This technology addresses the critical need for long-duration energy storage, supporting the integration of renewable sources into the grid. Highview Power's commitment to scalability aligns with the demand for versatile storage systems, contributing to grid stability and a sustainable energy future. Ongoing research and development efforts demonstrate a dedication to overcoming efficiency challenges and expanding the reach of liquid air energy storage, marking Highview Power as a key player in shaping a cleaner and more resilient energy landscape.
The rising popularity of cryogenic energy storage, facilitated by advanced liquid air technology, is driving demand for liquid air energy storage systems. As industries and power grids seek efficient long-duration energy storage solutions, the unique properties of cryogenic substances, such as liquid air, are gaining prominence. Liquid air energy storage systems are increasingly recognized for their reliability and scalability, playing a pivotal role in balancing energy supply and demand, particularly with the integration of renewable sources. This trend positions liquid air technology as a significant player in the evolving landscape of advanced energy storage solutions.
Customized Energy Solutions specializes in providing personalized liquid air energy storage solutions, catering to diverse energy needs and contributing to a sustainable future. Their tailored approach aligns with the specific requirements of clients and industries, showcasing the versatility and potential applications of liquid air technology. Through their expertise, Customized Energy Solutions plays a pivotal role in advancing the transition towards environmentally conscious energy solutions and empowering a more sustainable energy landscape
The Global Liquid Air Energy Storage Systems Market is analyzed across Electro-chemical, Pumped Hydro Storage, Thermal Storage, Electro-mechanical, Hydrogen Storage, Liquid Air Energy Storage, and others. The electrochemical Liquid Air Energy Storage Systems Market is poised to register significant growth. Electrochemical Liquid Air Energy Storage Systems" suggests a potential fusion of electrochemical energy storage and liquid air technology. While not widely recognized, this concept could involve combining these technologies to enhance energy storage efficiency.
The Global Liquid Air Energy Storage Systems Market is analyzed across various applications including Home Energy Storage, Grid Electricity and Power Stations, Air Conditioning, and others. Of these, Grid Electricity and Power Stations held a significant market share in 2023. The merging of "Grid Electricity" and "Power Stations" with "Liquid Air Energy Storage Systems" signifies a focus on incorporating liquid air technology into power station infrastructure for improved grid stability and energy management. This integration holds the potential to enhance efficiency in energy storage solutions, benefiting overall grid reliability.
By Type
By Application
By Capacity
By Component
By Technology
By Region
*List not exhaustive
Liquid Air Energy Storage Systems Market Outlook 2023
1 Market Overview
1.1 Introduction to the Liquid Air Energy Storage Systems Market
1.2 Scope of the Study
1.3 Research Objective
1.3.1 Key Market Scope and Segments
1.3.2 Players Covered
1.3.3 Years Considered
2 Executive Summary
2.1 2023 Liquid Air Energy Storage Systems Industry- Market Statistics
3 Market Dynamics
3.1 Market Drivers
3.2 Market Challenges
3.3 Market Opportunities
3.4 Market Trends
4 Market Factor Analysis
4.1 Porter’s Five Forces
4.2 Market Entropy
4.2.1 Global Liquid Air Energy Storage Systems Market Companies with Area Served
4.2.2 Products Offerings Global Liquid Air Energy Storage Systems Market
5 COVID-19 Impact Analysis and Outlook Scenarios
5.1.1 Covid-19 Impact Analysis
5.1.2 post-COVID-19 Scenario- Low Growth Case
5.1.3 post-COVID-19 Scenario- Reference Growth Case
5.1.4 post-COVID-19 Scenario- Low Growth Case
6 Global Liquid Air Energy Storage Systems Market Trends
6.1 Global Liquid Air Energy Storage Systems Revenue (USD Million) and CAGR (%) by Type (2018-2030)
6.2 Global Liquid Air Energy Storage Systems Revenue (USD Million) and CAGR (%) by Applications (2018-2030)
6.3 Global Liquid Air Energy Storage Systems Revenue (USD Million) and CAGR (%) by regions (2018-2030)
7 Global Liquid Air Energy Storage Systems Market Revenue (USD Million) by Type, and Applications (2018-2022)
7.1 Global Liquid Air Energy Storage Systems Revenue (USD Million) by Type (2018-2022)
7.1.1 Global Liquid Air Energy Storage Systems Revenue (USD Million), Market Share (%) by Type (2018-2022)
7.2 Global Liquid Air Energy Storage Systems Revenue (USD Million) by Applications (2018-2022)
7.2.1 Global Liquid Air Energy Storage Systems Revenue (USD Million), Market Share (%) by Applications (2018-2022)
8 Global Liquid Air Energy Storage Systems Development Regional Status and Outlook
8.1 Global Liquid Air Energy Storage Systems Revenue (USD Million) By Regions (2018-2022)
8.2 North America Liquid Air Energy Storage Systems Revenue (USD Million) by Type, and Application (2018-2022)
8.2.1 North America Liquid Air Energy Storage Systems Revenue (USD Million) by Country (2018-2022)
8.2.2 North America Liquid Air Energy Storage Systems Revenue (USD Million) by Type (2018-2022)
8.2.3 North America Liquid Air Energy Storage Systems Revenue (USD Million) by Applications (2018-2022)
8.3 Europe Liquid Air Energy Storage Systems Revenue (USD Million), by Type, and Applications (USD Million) (2018-2022)
8.3.1 Europe Liquid Air Energy Storage Systems Revenue (USD Million), by Country (2018-2022)
8.3.2 Europe Liquid Air Energy Storage Systems Revenue (USD Million) by Type (2018-2022)
8.3.3 Europe Liquid Air Energy Storage Systems Revenue (USD Million) by Applications (2018-2022)
8.4 Asia Pacific Liquid Air Energy Storage Systems Revenue (USD Million), and Revenue (USD Million) by Type, and Applications (2018-2022)
8.4.1 Asia Pacific Liquid Air Energy Storage Systems Revenue (USD Million) by Country (2018-2022)
8.4.2 Asia Pacific Liquid Air Energy Storage Systems Revenue (USD Million) by Type (2018-2022)
8.4.3 Asia Pacific Liquid Air Energy Storage Systems Revenue (USD Million) by Applications (2018-2022)
8.5 South America Liquid Air Energy Storage Systems Revenue (USD Million), by Type, and Applications (2018-2022)
8.5.1 South America Liquid Air Energy Storage Systems Revenue (USD Million), by Country (2018-2022)
8.5.2 South America Liquid Air Energy Storage Systems Revenue (USD Million) by Type (2018-2022)
8.5.3 South America Liquid Air Energy Storage Systems Revenue (USD Million) by Applications (2018-2022)
8.6 Middle East and Africa Liquid Air Energy Storage Systems Revenue (USD Million), by Type, Technology, Application, Thickness (2018-2022)
8.6.1 Middle East and Africa Liquid Air Energy Storage Systems Revenue (USD Million) by Country (2018-2022)
8.6.2 Middle East and Africa Liquid Air Energy Storage Systems Revenue (USD Million) by Type (2018-2022)
8.6.3 Middle East and Africa Liquid Air Energy Storage Systems Revenue (USD Million) by Applications (2018-2022)
9 Company Profiles
10 Global Liquid Air Energy Storage Systems Market Revenue (USD Million), by Type, and Applications (2023-2030)
10.1 Global Liquid Air Energy Storage Systems Revenue (USD Million) and Market Share (%) by Type (2023-2030)
10.1.1 Global Liquid Air Energy Storage Systems Revenue (USD Million), and Market Share (%) by Type (2023-2030)
10.2 Global Liquid Air Energy Storage Systems Revenue (USD Million) and Market Share (%) by Applications (2023-2030)
10.2.1 Global Liquid Air Energy Storage Systems Revenue (USD Million), and Market Share (%) by Applications (2023-2030)
11 Global Liquid Air Energy Storage Systems Development Regional Status and Outlook Forecast
11.1 Global Liquid Air Energy Storage Systems Revenue (USD Million) By Regions (2023-2030)
11.2 North America Liquid Air Energy Storage Systems Revenue (USD Million) by Type, and Applications (2023-2030)
11.2.1 North America Liquid Air Energy Storage Systems Revenue (USD) Million by Country (2023-2030)
11.2.2 North America Liquid Air Energy Storage Systems Revenue (USD Million), by Type (2023-2030)
11.2.3 North America Liquid Air Energy Storage Systems Revenue (USD Million), Market Share (%) by Applications (2023-2030)
11.3 Europe Liquid Air Energy Storage Systems Revenue (USD Million), by Type, and Applications (2023-2030)
11.3.1 Europe Liquid Air Energy Storage Systems Revenue (USD Million), by Country (2023-2030)
11.3.2 Europe Liquid Air Energy Storage Systems Revenue (USD Million), by Type (2023-2030)
11.3.3 Europe Liquid Air Energy Storage Systems Revenue (USD Million), by Applications (2023-2030)
11.4 Asia Pacific Liquid Air Energy Storage Systems Revenue (USD Million) by Type, and Applications (2023-2030)
11.4.1 Asia Pacific Liquid Air Energy Storage Systems Revenue (USD Million), by Country (2023-2030)
11.4.2 Asia Pacific Liquid Air Energy Storage Systems Revenue (USD Million), by Type (2023-2030)
11.4.3 Asia Pacific Liquid Air Energy Storage Systems Revenue (USD Million), by Applications (2023-2030)
11.5 South America Liquid Air Energy Storage Systems Revenue (USD Million), by Type, and Applications (2023-2030)
11.5.1 South America Liquid Air Energy Storage Systems Revenue (USD Million), by Country (2023-2030)
11.5.2 South America Liquid Air Energy Storage Systems Revenue (USD Million), by Type (2023-2030)
11.5.3 South America Liquid Air Energy Storage Systems Revenue (USD Million), by Applications (2023-2030)
11.6 Middle East and Africa Liquid Air Energy Storage Systems Revenue (USD Million), by Type, and Applications (2023-2030)
11.6.1 Middle East and Africa Liquid Air Energy Storage Systems Revenue (USD Million), by region (2023-2030)
11.6.2 Middle East and Africa Liquid Air Energy Storage Systems Revenue (USD Million), by Type (2023-2030)
11.6.3 Middle East and Africa Liquid Air Energy Storage Systems Revenue (USD Million), by Applications (2023-2030)
12 Methodology and Data Sources
12.1 Methodology/Research Approach
12.1.1 Research Programs/Design
12.1.2 Market Size Estimation
12.1.3 Market Breakdown and Data Triangulation
12.2 Data Sources
12.2.1 Secondary Sources
12.2.2 Primary Sources
12.3 Disclaimer
List of Tables
Table 1 Market Segmentation Analysis
Table 2 Global Liquid Air Energy Storage Systems Market Companies with Areas Served
Table 3 Products Offerings Global Liquid Air Energy Storage Systems Market
Table 4 Low Growth Scenario Forecasts
Table 5 Reference Case Growth Scenario
Table 6 High Growth Case Scenario
Table 7 Global Liquid Air Energy Storage Systems Revenue (USD Million) And CAGR (%) By Type (2018-2030)
Table 8 Global Liquid Air Energy Storage Systems Revenue (USD Million) And CAGR (%) By Applications (2018-2030)
Table 9 Global Liquid Air Energy Storage Systems Revenue (USD Million) And CAGR (%) By Regions (2018-2030)
Table 10 Global Liquid Air Energy Storage Systems Revenue (USD Million) By Type (2018-2022)
Table 11 Global Liquid Air Energy Storage Systems Revenue Market Share (%) By Type (2018-2022)
Table 12 Global Liquid Air Energy Storage Systems Revenue (USD Million) By Applications (2018-2022)
Table 13 Global Liquid Air Energy Storage Systems Revenue Market Share (%) By Applications (2018-2022)
Table 14 Global Liquid Air Energy Storage Systems Market Revenue (USD Million) By Regions (2018-2022)
Table 15 Global Liquid Air Energy Storage Systems Market Share (%) By Regions (2018-2022)
Table 16 North America Liquid Air Energy Storage Systems Revenue (USD Million) By Country (2018-2022)
Table 17 North America Liquid Air Energy Storage Systems Revenue (USD Million) By Type (2018-2022)
Table 18 North America Liquid Air Energy Storage Systems Revenue (USD Million) By Applications (2018-2022)
Table 19 Europe Liquid Air Energy Storage Systems Revenue (USD Million) By Country (2018-2022)
Table 20 Europe Liquid Air Energy Storage Systems Revenue (USD Million) By Type (2018-2022)
Table 21 Europe Liquid Air Energy Storage Systems Revenue (USD Million) By Applications (2018-2022)
Table 22 Asia Pacific Liquid Air Energy Storage Systems Revenue (USD Million) By Country (2018-2022)
Table 23 Asia Pacific Liquid Air Energy Storage Systems Revenue (USD Million) By Type (2018-2022)
Table 24 Asia Pacific Liquid Air Energy Storage Systems Revenue (USD Million) By Applications (2018-2022)
Table 25 South America Liquid Air Energy Storage Systems Revenue (USD Million) By Country (2018-2022)
Table 26 South America Liquid Air Energy Storage Systems Revenue (USD Million) By Type (2018-2022)
Table 27 South America Liquid Air Energy Storage Systems Revenue (USD Million) By Applications (2018-2022)
Table 28 Middle East and Africa Liquid Air Energy Storage Systems Revenue (USD Million) By Region (2018-2022)
Table 29 Middle East and Africa Liquid Air Energy Storage Systems Revenue (USD Million) By Type (2018-2022)
Table 30 Middle East and Africa Liquid Air Energy Storage Systems Revenue (USD Million) By Applications (2018-2022)
Table 31 Financial Analysis
Table 32 Global Liquid Air Energy Storage Systems Revenue (USD Million) By Type (2023-2030)
Table 33 Global Liquid Air Energy Storage Systems Revenue Market Share (%) By Type (2023-2030)
Table 34 Global Liquid Air Energy Storage Systems Revenue (USD Million) By Applications (2023-2030)
Table 35 Global Liquid Air Energy Storage Systems Revenue Market Share (%) By Applications (2023-2030)
Table 36 Global Liquid Air Energy Storage Systems Market Revenue (USD Million), And Revenue (USD Million) By Regions (2023-2030)
Table 37 North America Liquid Air Energy Storage Systems Revenue (USD)By Country (2023-2030)
Table 38 North America Liquid Air Energy Storage Systems Revenue (USD Million) By Type (2023-2030)
Table 39 North America Liquid Air Energy Storage Systems Revenue (USD Million) By Applications (2023-2030)
Table 40 Europe Liquid Air Energy Storage Systems Revenue (USD Million) By Country (2023-2030)
Table 41 Europe Liquid Air Energy Storage Systems Revenue (USD Million) By Type (2023-2030)
Table 42 Europe Liquid Air Energy Storage Systems Revenue (USD Million) By Applications (2023-2030)
Table 43 Asia Pacific Liquid Air Energy Storage Systems Revenue (USD Million) By Country (2023-2030)
Table 44 Asia Pacific Liquid Air Energy Storage Systems Revenue (USD Million) By Type (2023-2030)
Table 45 Asia Pacific Liquid Air Energy Storage Systems Revenue (USD Million) By Applications (2023-2030)
Table 46 South America Liquid Air Energy Storage Systems Revenue (USD Million) By Country (2023-2030)
Table 47 South America Liquid Air Energy Storage Systems Revenue (USD Million) By Type (2023-2030)
Table 48 South America Liquid Air Energy Storage Systems Revenue (USD Million) By Applications (2023-2030)
Table 49 Middle East and Africa Liquid Air Energy Storage Systems Revenue (USD Million) By Region (2023-2030)
Table 50 Middle East and Africa Liquid Air Energy Storage Systems Revenue (USD Million) By Region (2023-2030)
Table 51 Middle East and Africa Liquid Air Energy Storage Systems Revenue (USD Million) By Type (2023-2030)
Table 52 Middle East and Africa Liquid Air Energy Storage Systems Revenue (USD Million) By Applications (2023-2030)
Table 53 Research Programs/Design for This Report
Table 54 Key Data Information from Secondary Sources
Table 55 Key Data Information from Primary Sources
List of Figures
Figure 1 Market Scope
Figure 2 Porter’s Five Forces
Figure 3 Global Liquid Air Energy Storage Systems Revenue (USD Million) By Type (2018-2022)
Figure 4 Global Liquid Air Energy Storage Systems Revenue Market Share (%) By Type (2022)
Figure 5 Global Liquid Air Energy Storage Systems Revenue (USD Million) By Applications (2018-2022)
Figure 6 Global Liquid Air Energy Storage Systems Revenue Market Share (%) By Applications (2022)
Figure 7 Global Liquid Air Energy Storage Systems Market Revenue (USD Million) By Regions (2018-2022)
Figure 8 Global Liquid Air Energy Storage Systems Market Share (%) By Regions (2022)
Figure 9 North America Liquid Air Energy Storage Systems Revenue (USD Million) By Country (2018-2022)
Figure 10 North America Liquid Air Energy Storage Systems Revenue (USD Million) By Type (2018-2022)
Figure 11 North America Liquid Air Energy Storage Systems Revenue (USD Million) By Applications (2018-2022)
Figure 12 Europe Liquid Air Energy Storage Systems Revenue (USD Million) By Country (2018-2022)
Figure 13 Europe Liquid Air Energy Storage Systems Revenue (USD Million) By Type (2018-2022)
Figure 14 Europe Liquid Air Energy Storage Systems Revenue (USD Million) By Applications (2018-2022)
Figure 15 Asia Pacific Liquid Air Energy Storage Systems Revenue (USD Million) By Country (2018-2022)
Figure 16 Asia Pacific Liquid Air Energy Storage Systems Revenue (USD Million) By Type (2018-2022)
Figure 17 Asia Pacific Liquid Air Energy Storage Systems Revenue (USD Million) By Applications (2018-2022)
Figure 18 South America Liquid Air Energy Storage Systems Revenue (USD Million) By Country (2018-2022)
Figure 19 South America Liquid Air Energy Storage Systems Revenue (USD Million) By Type (2018-2022)
Figure 20 South America Liquid Air Energy Storage Systems Revenue (USD Million) By Applications (2018-2022)
Figure 21 Middle East and Africa Liquid Air Energy Storage Systems Revenue (USD Million) By Region (2018-2022)
Figure 22 Middle East and Africa Liquid Air Energy Storage Systems Revenue (USD Million) By Type (2018-2022)
Figure 23 Middle East and Africa Liquid Air Energy Storage Systems Revenue (USD Million) By Applications (2018-2022)
Figure 24 Global Liquid Air Energy Storage Systems Revenue (USD Million) By Type (2023-2030)
Figure 25 Global Liquid Air Energy Storage Systems Revenue Market Share (%) By Type (2030)
Figure 26 Global Liquid Air Energy Storage Systems Revenue (USD Million) By Applications (2023-2030)
Figure 27 Global Liquid Air Energy Storage Systems Revenue Market Share (%) By Applications (2030)
Figure 28 Global Liquid Air Energy Storage Systems Market Revenue (USD Million) By Regions (2023-2030)
Figure 29 North America Liquid Air Energy Storage Systems Revenue (USD Million) By Country (2023-2030)
Figure 30 North America Liquid Air Energy Storage Systems Revenue (USD Million) By Type (2023-2030)
Figure 31 North America Liquid Air Energy Storage Systems Revenue (USD Million) By Applications (2023-2030)
Figure 32 Europe Liquid Air Energy Storage Systems Revenue (USD Million) By Country (2023-2030)
Figure 33 Europe Liquid Air Energy Storage Systems Revenue (USD Million) By Type (2023-2030)
Figure 34 Europe Liquid Air Energy Storage Systems Revenue (USD Million) By Applications (2023-2030)
Figure 35 Asia Pacific Liquid Air Energy Storage Systems Revenue (USD Million) By Country (2023-2030)
Figure 36 Asia Pacific Liquid Air Energy Storage Systems Revenue (USD Million) By Type (2023-2030)
Figure 37 Asia Pacific Liquid Air Energy Storage Systems Revenue (USD Million) By Applications (2023-2030)
Figure 38 South America Liquid Air Energy Storage Systems Revenue (USD Million) By Country (2023-2030)
Figure 39 South America Liquid Air Energy Storage Systems Revenue (USD Million) By Type (2023-2030)
Figure 40 South America Liquid Air Energy Storage Systems Revenue (USD Million) By Applications (2023-2030)
Figure 41 Middle East and Africa Liquid Air Energy Storage Systems Revenue (USD Million) By Region (2023-2030)
Figure 42 Middle East and Africa Liquid Air Energy Storage Systems Revenue (USD Million) By Region (2023-2030)
Figure 43 Middle East and Africa Liquid Air Energy Storage Systems Revenue (USD Million) By Type (2023-2030)
Figure 44 Middle East and Africa Liquid Air Energy Storage Systems Revenue (USD Million) By Applications (2023-2030)
Figure 45 Bottom-Up and Top-Down Approaches for This Report
Figure 46 Data Triangulation
By Type
By Application
By Capacity
By Component
By Technology
By Region