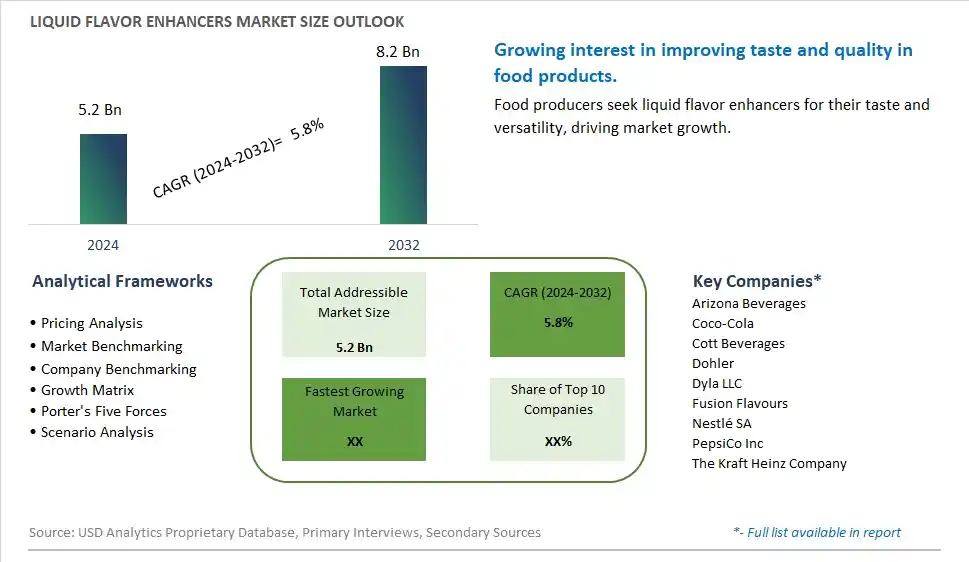
Global Liquid Flavor Enhancers Market Size is valued at $5.2 Billion in 2024 and is forecast to register a growth rate (CAGR) of 5.8% to reach $8.2 Billion by 2032.
The global Liquid Flavor Enhancers Market Comprehensive Study analyzes and forecasts the market size across 6 regions and 24 countries for diverse segments -By Type (Fruits and Concentrate based Flavor Enhancers, Synthetic Flavor Enhancers), By Application (Water Enhancers, Tea and Coffee Enhancers, Beer Enhancers, Dairy Enhancers, Others)
An Introduction to Liquid Flavor Enhancers Market
In 2024, the liquid flavor enhancers market is thriving, driven by the demand for versatile, high-quality ingredients that enhance the taste and aroma of various food and beverage products. Liquid flavor enhancers, including natural extracts, concentrated flavors, and umami boosters, are used to improve the sensory profile of processed foods, ready meals, and beverages. The market benefits from innovations in flavor extraction and formulation that ensure better performance and consistency. The trend towards clean label and natural ingredients is influencing product development. Increasing consumer interest in gourmet and premium foods is further propelling demand for liquid flavor enhancers.
Liquid Flavor Enhancers Competitive Landscape
The market report analyses the leading companies in the industry including Arizona Beverages, Coco-Cola, Cott Beverages, Dohler, Dyla LLC, Fusion Flavours, Nestlé SA, PepsiCo Inc, The Kraft Heinz Company, and Others.
Liquid Flavor Enhancers Market Dynamics
Liquid Flavor Enhancers Market Trend: Increasing Demand for Convenient Flavor Solutions
The most prominent trend in the Liquid Flavor Enhancers Market is the increasing demand for convenient flavor solutions. Liquid flavor enhancers, used to improve the taste of various food and beverage products, are gaining popularity among consumers seeking quick and easy ways to enhance their meals. This trend is driven by the demand for flavorful and high-quality food experiences.
Liquid Flavor Enhancers Market Driver: Growth of the Food and Beverage Industry
A key driver in the Liquid Flavor Enhancers Market is the growth of the food and beverage industry. As the consumption of processed and convenience foods continues to rise, there is an increasing need for ingredients that enhance flavor and consumer appeal. Liquid flavor enhancers offer benefits such as easy application, consistent flavor, and versatility, supporting their use in a wide range of products.
Liquid Flavor Enhancers Market Opportunity: Innovation in Clean Label and Natural Flavor Enhancers
One significant opportunity in the Liquid Flavor Enhancers Market lies in innovation in clean label and natural flavor enhancers. Companies can develop new products that use natural ingredients and avoid artificial additives, catering to the growing consumer preference for clean label products. By offering natural and high-quality flavor enhancers, manufacturers can attract health-conscious consumers and drive market growth.
Liquid Flavor Enhancers Market Share Analysis: Synthetic Flavor Enhancers segment generated the highest revenue share in the industry
The Synthetic Flavor Enhancers segment stands as the largest in the Liquid Flavor Enhancers market. This dominance is underpinned by their widespread use across various industries, including food and beverages, pharmaceuticals, and cosmetics. Synthetic flavor enhancers are manufactured to replicate natural flavors, offering consistent taste profiles and cost-effectiveness compared to their natural counterparts. They are extensively utilized in processed foods, beverages, and convenience products where precise flavor profiles are crucial for consumer acceptance and product differentiation. The market for synthetic flavor enhancers is experiencing robust growth driven by technological advancements in flavor synthesis, enabling manufacturers to create complex and diverse flavor profiles that cater to evolving consumer preferences globally. Further, the ability of synthetic flavor enhancers to enhance product taste, aroma, and overall sensory experience while maintaining shelf stability further contributes to their popularity and widespread adoption across various applications.
Liquid Flavor Enhancers Market Share Analysis: Tea and Coffee Enhancers is the fastest growing segment over the forecast period to 2032
The Tea and Coffee Enhancers segment emerges as the fastest growing in the Liquid Flavor Enhancers market, poised for substantial expansion through 2032. This growth is driven by evolving consumer preferences towards convenient and customizable beverage options that offer enhanced taste and aroma profiles. Tea and coffee enhancers provide consumers with the flexibility to personalize their beverages according to their taste preferences, whether it's adjusting sweetness levels, adding flavors like vanilla or caramel, or enhancing the richness of coffee blends. The increasing demand for on-the-go beverage solutions, coupled with the rising popularity of flavored coffees and teas, fuels the growth of this segment. Manufacturers are innovating with new formulations that cater to health-conscious consumers, incorporating natural ingredients and reducing sugar content while maintaining flavor intensity. The expansion of retail channels and online platforms further amplifies market accessibility, contributing to the segment's accelerated growth trajectory in the liquid flavor enhancers market.
Liquid Flavor Enhancers Market Segmentation
By Type
Fruits and Concentrate based Flavor Enhancers
Synthetic Flavor Enhancers
By Application
Water Enhancers
Tea and Coffee Enhancers
Beer Enhancers
Dairy Enhancers
Others
Countries Analyzed
North America (US, Canada, Mexico)
Europe (Germany, UK, France, Spain, Italy, Russia, Rest of Europe)
Asia Pacific (China, India, Japan, South Korea, Australia, South East Asia, Rest of Asia)
South America (Brazil, Argentina, Rest of South America)
Middle East and Africa (Saudi Arabia, UAE, Rest of Middle East, South Africa, Egypt, Rest of Africa)
Liquid Flavor Enhancers Companies Profiled in the Study
Arizona Beverages
Coco-Cola
Cott Beverages
Dohler
Dyla LLC
Fusion Flavours
Nestlé SA
PepsiCo Inc
The Kraft Heinz Company
*- List Not Exhaustive
Chapter 1. TABLE OF CONTENTS
Chapter 2. Introduction to Liquid Flavor Enhancers Market
2.1. Market Overview
2.2. Key Statistics and Report Highlights
2.3. Scope of the Comprehensive Study
2.3.1. Market Definition
2.3.2 Countries and Regions Covered
2.3.3 Research Objective
2.3.4 Units, Currency, and Conversions
2.3.5 Industry Value Chain
2.4. Key Market Segments
2.5. Key Companies
2.6. Study Period
Chapter 3. Strategic Analysis Review
3.1. Liquid Flavor Enhancers Pricing Analysis and Forecast
3.2. Porter’s Five Forces
3.3. Market Ecosystem
3.4. SWOT Analysis
3.5. Regulatory Scenario
3.3. Effects of Inflation, Russia-Ukraine War, moderating economic growth, and other macroeconomic factors
Chapter 4. Competitive Landscape
4.1. Market Share Analysis
4.1.1. Global Liquid Flavor Enhancers Market Share by Company, 2023
4.1.2. Product Offerings of Leading Liquid Flavor Enhancers Companies
4.2. Market Entropy
4.2.1. New Product Launches in the Industry
4.2.2. Mergers, Acquisitions, Joint ventures, and Partnerships
4.3. Key Strategies and Best Practices
Chapter 5. Global Market Projections: Best, Reference, and Low Case Scenarios
5.1. Growth Analysis- Case Scenario Definitions
5.2. Low Growth Case Scenario Forecasts
5.3. Reference Growth Case Scenario Forecasts
5.4. High Growth Case Scenario Forecasts
Chapter 6. Market Dynamics
6.1. Liquid Flavor Enhancers Market Drivers
6.2. Liquid Flavor Enhancers Market Challenges
6.6. Liquid Flavor Enhancers Market Opportunities
6.4. Liquid Flavor Enhancers Market Trends
Chapter 7. Global Liquid Flavor Enhancers Market Outlook Trends
7.1. Global Liquid Flavor Enhancers Revenue (USD Million) and CAGR (%) by Type (2021-2032)
7.2. Global Liquid Flavor Enhancers Revenue (USD Million) and CAGR (%) by Application (2021-2032)
7.3. Global Liquid Flavor Enhancers Revenue (USD Million) and CAGR (%) by Product (2021-2032)
By Type
Fruits and Concentrate based Flavor Enhancers
Synthetic Flavor Enhancers
By Application
Water Enhancers
Tea and Coffee Enhancers
Beer Enhancers
Dairy Enhancers
Others
Chapter 8. Global Liquid Flavor Enhancers Regional Analysis and Outlook
8.1. Global Liquid Flavor Enhancers Revenue (USD Million) By Regions (2021- 2032)
8.2. North America Liquid Flavor Enhancers Revenue (USD Million) by Country (2021-2032)
8.2.1. United States Liquid Flavor Enhancers Regional Analysis and Outlook
8.2.2. Canada Liquid Flavor Enhancers Regional Analysis and Outlook
8.2.3. Mexico Liquid Flavor Enhancers Regional Analysis and Outlook
8.3. Europe Liquid Flavor Enhancers Revenue (USD Million), by Country (2021-2032)
8.3.1. Germany Liquid Flavor Enhancers Regional Analysis and Outlook
8.3.2. France Liquid Flavor Enhancers Regional Analysis and Outlook
8.3.3. United Kingdom Liquid Flavor Enhancers Regional Analysis and Outlook
8.3.4. Spain Liquid Flavor Enhancers Regional Analysis and Outlook
8.3.5. Italy Liquid Flavor Enhancers Regional Analysis and Outlook
8.3.6. Russia Liquid Flavor Enhancers Regional Analysis and Outlook
8.3.7. Rest of Europe Liquid Flavor Enhancers Regional Analysis and Outlook
8.4. Asia Pacific Liquid Flavor Enhancers Revenue (USD Million) by Country (2021-2032)
8.4.1. China Liquid Flavor Enhancers Regional Analysis and Outlook
8.4.2. Japan Liquid Flavor Enhancers Regional Analysis and Outlook
8.4.3. India Liquid Flavor Enhancers Regional Analysis and Outlook
8.4.4. South Korea Liquid Flavor Enhancers Regional Analysis and Outlook
8.4.5. Australia Liquid Flavor Enhancers Regional Analysis and Outlook
8.4.6. South East Asia Liquid Flavor Enhancers Regional Analysis and Outlook
8.4.7. Rest of Asia Pacific Liquid Flavor Enhancers Regional Analysis and Outlook
8.5. South America Liquid Flavor Enhancers Revenue (USD Million), by Country (2021-2032)
8.5.1. Brazil Liquid Flavor Enhancers Regional Analysis and Outlook
8.5.2. Argentina Liquid Flavor Enhancers Regional Analysis and Outlook
8.5.3. Rest of South America Liquid Flavor Enhancers Regional Analysis and Outlook
8.6. Middle East and Africa Liquid Flavor Enhancers Revenue (USD Million) by Country (2021-2032)
8.6.1. Middle East Liquid Flavor Enhancers Regional Analysis and Outlook
8.6.2. Africa Liquid Flavor Enhancers Regional Analysis and Outlook
Chapter 9. North America Liquid Flavor Enhancers Analysis and Outlook
9.1. North America Liquid Flavor Enhancers Revenue (USD Million) by Segments (2021-2032)
9.1.1. North America Liquid Flavor Enhancers Revenue (USD Million) by Type (2021-2032)
9.1.2. North America Liquid Flavor Enhancers Revenue (USD Million) by Application (2021-2032)
9.1.3. North America Liquid Flavor Enhancers Revenue (USD Million) by Product (2021-2032)
By Type
Fruits and Concentrate based Flavor Enhancers
Synthetic Flavor Enhancers
By Application
Water Enhancers
Tea and Coffee Enhancers
Beer Enhancers
Dairy Enhancers
Others
Chapter 10. Europe Liquid Flavor Enhancers Analysis and Outlook
10.1. Europe Liquid Flavor Enhancers Revenue (USD Million), by Segments (USD Million) (2021-2032)
10.1.1. Europe Liquid Flavor Enhancers Revenue (USD Million) by Type (2021-2032)
10.1.2. Europe Liquid Flavor Enhancers Revenue (USD Million) by Application (2021-2032)
10.1.3. Europe Liquid Flavor Enhancers Revenue (USD Million) by Product (2021-2032)
By Type
Fruits and Concentrate based Flavor Enhancers
Synthetic Flavor Enhancers
By Application
Water Enhancers
Tea and Coffee Enhancers
Beer Enhancers
Dairy Enhancers
Others
Chapter 11. Asia Pacific Liquid Flavor Enhancers Analysis and Outlook
11.1. Asia Pacific Liquid Flavor Enhancers Revenue (USD Million), and Revenue (USD Million) by Segments (2021-2032)
11.1.1. Asia Pacific Liquid Flavor Enhancers Revenue (USD Million) by Type (2021-2032)
11.1.2. Asia Pacific Liquid Flavor Enhancers Revenue (USD Million) by Application (2021-2032)
11.1.3. Asia Pacific Liquid Flavor Enhancers Revenue (USD Million) by Product (2021-2032)
By Type
Fruits and Concentrate based Flavor Enhancers
Synthetic Flavor Enhancers
By Application
Water Enhancers
Tea and Coffee Enhancers
Beer Enhancers
Dairy Enhancers
Others
Chapter 12. South America Liquid Flavor Enhancers Analysis and Outlook
12.1. South America Liquid Flavor Enhancers Revenue (USD Million), by Segments (2021-2032)
12.1.1. South America Liquid Flavor Enhancers Revenue (USD Million) by Type (2021-2032)
12.1.2. South America Liquid Flavor Enhancers Revenue (USD Million) by Application (2021-2032)
12.1.3. South America Liquid Flavor Enhancers Revenue (USD Million) by Product (2021-2032)
By Type
Fruits and Concentrate based Flavor Enhancers
Synthetic Flavor Enhancers
By Application
Water Enhancers
Tea and Coffee Enhancers
Beer Enhancers
Dairy Enhancers
Others
Chapter 13. Middle East and Africa Liquid Flavor Enhancers Analysis and Outlook
13.1. Middle East and Africa Liquid Flavor Enhancers Revenue (USD Million), by Segments (2021-2032)
13.1.1. Middle East and Africa Liquid Flavor Enhancers Revenue (USD Million) by Type (2021-2032)
13.1.2. Middle East and Africa Liquid Flavor Enhancers Revenue (USD Million) by Application (2021-2032)
13.1.3. Middle East and Africa Liquid Flavor Enhancers Revenue (USD Million) by Product (2021-2032)
By Type
Fruits and Concentrate based Flavor Enhancers
Synthetic Flavor Enhancers
By Application
Water Enhancers
Tea and Coffee Enhancers
Beer Enhancers
Dairy Enhancers
Others
Chapter 14. Liquid Flavor Enhancers Company Profiles
14.1 Business Overview
14.2 Product Profiles
14.3 SWOT Profiles
14.5 Recent Developments
14.6 Financial Profile
List of Companies
Arizona Beverages
Coco-Cola
Cott Beverages
Dohler
Dyla LLC
Fusion Flavours
Nestlé SA
PepsiCo Inc
The Kraft Heinz Company
15. Methodology and Data Sources
15.1 Customization Offerings
15.2 Subscription Services
15.3 Related Reports
15.4 Publisher Expertise
LIST OF TABLES
Table 1 Market Segmentation Analysis
Table 2 Global Liquid Flavor Enhancers Market Share of Leading Companies, 2023
Table 3 Product Offerings of Leading Companies
Table 4 Low Growth Scenario Forecasts
Table 5 Reference Case Growth Scenario
Table 6 High Growth Case Scenario
Table 7 Global Liquid Flavor Enhancers Revenue (USD Million) And CAGR (%) By Type (2021-2032)
Table 8 Global Liquid Flavor Enhancers Revenue (USD Million) And CAGR (%) By Application (2021-2032)
Table 9 Global Liquid Flavor Enhancers Revenue (USD Million) And CAGR (%) By Product (2021-2032)
Table 10 Global Liquid Flavor Enhancers Market Revenue (USD Million) By Regions (2021-2032)
Table 11 Global Liquid Flavor Enhancers Market Share (%) By Regions (2021-2032)
Table 12 North America Liquid Flavor Enhancers Revenue (USD Million) By Country (2021-2032)
Table 13 Europe Liquid Flavor Enhancers Revenue (USD Million) By Country (2021-2032)
Table 14 Asia Pacific Liquid Flavor Enhancers Revenue (USD Million) By Country (2021-2032)
Table 15 South America Liquid Flavor Enhancers Revenue (USD Million) By Country (2021-2032)
Table 16 Middle East and Africa Liquid Flavor Enhancers Revenue (USD Million) By Region (2021-2032)
Table 17 North America Liquid Flavor Enhancers Revenue (USD Million) By Type (2021-2032)
Table 18 North America Liquid Flavor Enhancers Revenue (USD Million) By Application (2021-2032)
Table 19 North America Liquid Flavor Enhancers Revenue (USD Million) By Product (2021-2032)
Table 20 Europe Liquid Flavor Enhancers Revenue (USD Million) By Type (2021-2032)
Table 21 Europe Liquid Flavor Enhancers Revenue (USD Million) By Application (2021-2032)
Table 22 Europe Liquid Flavor Enhancers Revenue (USD Million) By Product (2021-2032)
Table 23 Asia Pacific Liquid Flavor Enhancers Revenue (USD Million) By Type (2021-2032)
Table 24 Asia Pacific Liquid Flavor Enhancers Revenue (USD Million) By Application (2021-2032)
Table 25 Asia Pacific Liquid Flavor Enhancers Revenue (USD Million) By Product (2021-2032)
Table 26 South America Liquid Flavor Enhancers Revenue (USD Million) By Type (2021-2032)
Table 27 South America Liquid Flavor Enhancers Revenue (USD Million) By Application (2021-2032)
Table 28 South America Liquid Flavor Enhancers Revenue (USD Million) By Product (2021-2032)
Table 29 Middle East and Africa Liquid Flavor Enhancers Revenue (USD Million) By Type (2021-2032)
Table 30 Middle East and Africa Liquid Flavor Enhancers Revenue (USD Million) By Application (2021-2032)
Table 31 Middle East and Africa Liquid Flavor Enhancers Revenue (USD Million) By Product (2021-2032)
LIST OF FIGURES
Figure 1. Market Scope
Figure 2. Pricing Forecasts Per Unit, 2023- 2032
Figure 3. Porter’s Five Forces
Figure 4. Global Liquid Flavor Enhancers Market Revenue (USD Million) By Regions (2021-2032)
Figure 5. Global Liquid Flavor Enhancers Market Share (%) By Regions (2023)
Figure 6. North America Liquid Flavor Enhancers Revenue (USD Million) By Country (2021-2032)
Figure 7. United States Liquid Flavor Enhancers Revenue (USD Million) By Country (2021-2032)
Figure 8. Canada Liquid Flavor Enhancers Revenue (USD Million) By Country (2021-2032)
Figure 9. Mexico Liquid Flavor Enhancers Revenue (USD Million) By Country (2021-2032)
Figure 10. Europe Liquid Flavor Enhancers Revenue (USD Million) By Country (2021-2032)
Figure 11. Germany Liquid Flavor Enhancers Revenue (USD Million) By Country (2021-2032)
Figure 12. France Liquid Flavor Enhancers Revenue (USD Million) By Country (2021-2032)
Figure 13. United Kingdom Liquid Flavor Enhancers Revenue (USD Million) By Country (2021-2032)
Figure 14. Spain Liquid Flavor Enhancers Revenue (USD Million) By Country (2021-2032)
Figure 15. Italy Liquid Flavor Enhancers Revenue (USD Million) By Country (2021-2032)
Figure 16. Russia Liquid Flavor Enhancers Revenue (USD Million) By Country (2021-2032)
Figure 17. Rest of Europe Liquid Flavor Enhancers Revenue (USD Million) By Country (2021-2032)
Figure 11. Asia Pacific Liquid Flavor Enhancers Revenue (USD Million) By Country (2021-2032)
Figure 12. China Liquid Flavor Enhancers Revenue (USD Million) By Country (2021-2032)
Figure 13. Japan Liquid Flavor Enhancers Revenue (USD Million) By Country (2021-2032)
Figure 14. India Liquid Flavor Enhancers Revenue (USD Million) By Country (2021-2032)
Figure 15. South Korea Liquid Flavor Enhancers Revenue (USD Million) By Country (2021-2032)
Figure 16. Australia Liquid Flavor Enhancers Revenue (USD Million) By Country (2021-2032)
Figure 17. South East Asia Liquid Flavor Enhancers Revenue (USD Million) By Country (2021-2032)
Figure 18. South America Liquid Flavor Enhancers Revenue (USD Million) By Country (2021-2032)
Figure 19. Brazil Liquid Flavor Enhancers Revenue (USD Million) By Country (2021-2032)
Figure 20. Argentina Liquid Flavor Enhancers Revenue (USD Million) By Country (2021-2032)
Figure 21. Rest of Asia Pacific Liquid Flavor Enhancers Revenue (USD Million) By Country (2021-2032)
Figure 22. Middle East and Africa Liquid Flavor Enhancers Revenue (USD Million) By Region (2021-2032)
Figure 23. Saudi Arabia Liquid Flavor Enhancers Revenue (USD Million) By Region (2021-2032)
Figure 24. The UAE Liquid Flavor Enhancers Revenue (USD Million) By Region (2021-2032)
Figure 25. Rest of Middle East Liquid Flavor Enhancers Revenue (USD Million) By Region (2021-2032)
Figure 26. South Africa Liquid Flavor Enhancers Revenue (USD Million) By Region (2021-2032)
Figure 27. Africa Liquid Flavor Enhancers Revenue (USD Million) By Region (2021-2032)
Figure 28. North America Liquid Flavor Enhancers Revenue (USD Million) By Type (2021-2032)
Figure 29. North America Liquid Flavor Enhancers Revenue (USD Million) By Application (2021-2032)
Figure 30. North America Liquid Flavor Enhancers Revenue (USD Million) By Product (2021-2032)
Figure 31. Europe Liquid Flavor Enhancers Revenue (USD Million) By Type (2021-2032)
Figure 32. Europe Liquid Flavor Enhancers Revenue (USD Million) By Application (2021-2032)
Figure 33. Europe Liquid Flavor Enhancers Revenue (USD Million) By Product (2021-2032)
Figure 34. Asia Pacific Liquid Flavor Enhancers Revenue (USD Million) By Type (2021-2032)
Figure 35. Asia Pacific Liquid Flavor Enhancers Revenue (USD Million) By Application (2021-2032)
Figure 36. Asia Pacific Liquid Flavor Enhancers Revenue (USD Million) By Product (2021-2032)
Figure 37. South America Liquid Flavor Enhancers Revenue (USD Million) By Type (2021-2032)
Figure 38. South America Liquid Flavor Enhancers Revenue (USD Million) By Application (2021-2032)
Figure 39. South America Liquid Flavor Enhancers Revenue (USD Million) By Product (2021-2032)
Figure 40. Middle East and Africa Liquid Flavor Enhancers Revenue (USD Million) By Type (2021-2032)
Figure 41. Middle East and Africa Liquid Flavor Enhancers Revenue (USD Million) By Application (2021-2032)
Figure 42. Middle East and Africa Liquid Flavor Enhancers Revenue (USD Million) By Product (2021-2032)
By Type
Fruits and Concentrate based Flavor Enhancers
Synthetic Flavor Enhancers
By Application
Water Enhancers
Tea and Coffee Enhancers
Beer Enhancers
Dairy Enhancers
Others
Countries Analyzed
North America (US, Canada, Mexico)
Europe (Germany, UK, France, Spain, Italy, Russia, Rest of Europe)
Asia Pacific (China, India, Japan, South Korea, Australia, South East Asia, Rest of Asia)
South America (Brazil, Argentina, Rest of South America)
Middle East and Africa (Saudi Arabia, UAE, Rest of Middle East, South Africa, Egypt, Rest of Africa)
