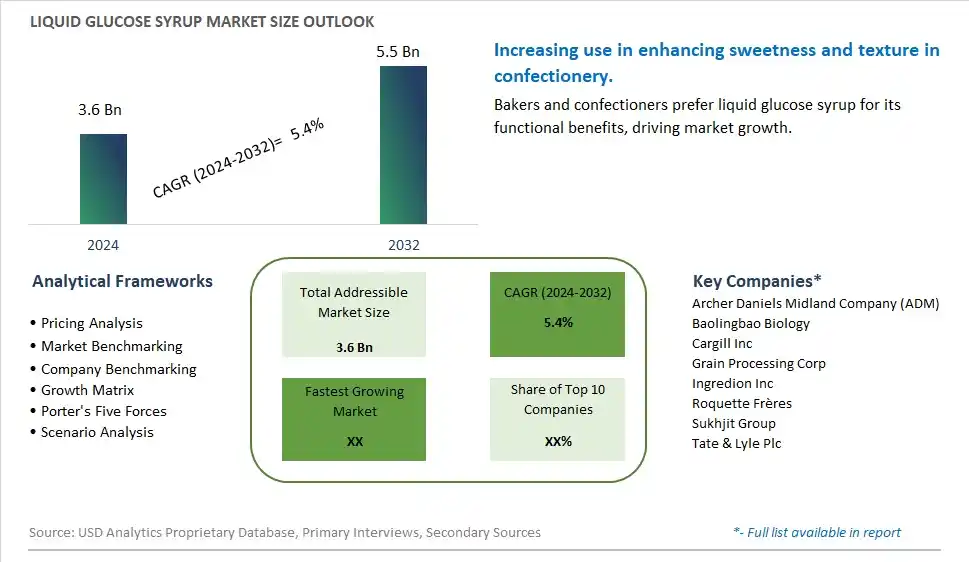
Global Liquid Glucose Syrup Market Size is valued at $3.6 Billion in 2024 and is forecast to register a growth rate (CAGR) of 5.4% to reach $5.5 Billion by 2032.
The global Liquid Glucose Syrup Market Comprehensive Study analyzes and forecasts the market size across 6 regions and 24 countries for diverse segments -By Type (Low Conversion 20-35 DE, Intermediate Conversion 35-55 DE, High Conversion 55-70 DE, Very High Conversion 70-98 DE), By Application (Bakery and Confectionery, Beverages, Dairy & Ice Cream, Fruit Processing, Pharmaceuticals, Others)
An Introduction to Liquid Glucose Syrup Market
The liquid glucose syrups market in 2024 is expanding, driven by the demand for versatile sweeteners and functional ingredients in the food and beverage industry. Liquid glucose syrups, derived from starch hydrolysis, are valued for their sweetness, texture-enhancing properties, and use in confectionery, baking, and beverages. The market benefits from innovations in starch processing and syrup formulation that enhance product quality and functionality. The trend towards clean label and natural ingredients is influencing market dynamics. Increasing demand for processed foods and the rise of convenience foods are further supporting market growth.
Liquid Glucose Syrup Competitive Landscape
The market report analyses the leading companies in the industry including Archer Daniels Midland Company (ADM), Baolingbao Biology, Cargill Inc, Grain Processing Corp, Ingredion Inc, Roquette Frères, Sukhjit Group, Tate & Lyle Plc, and Others.
Liquid Glucose Syrup Market Dynamics
Liquid Glucose Syrups Market Trend: Increasing Use in Confectionery and Bakery Products
The most prominent trend in the Liquid Glucose Syrups Market is the increasing use in confectionery and bakery products. Liquid glucose syrups, known for their sweetening and texturizing properties, are widely used in a variety of sweet treats and baked goods. This trend is driven by the demand for ingredients that enhance flavor, texture, and shelf life.
Liquid Glucose Syrups Market Driver: Growth of the Confectionery and Bakery Industries
A key driver in the Liquid Glucose Syrups Market is the growth of the confectionery and bakery industries. As the consumption of sweets and baked products continues to rise, there is an increasing need for reliable and high-quality sweeteners. Liquid glucose syrups offer benefits such as improved moisture retention, crystallization control, and enhanced mouthfeel, making them a preferred choice in these industries.
Liquid Glucose Syrups Market Opportunity: Development of Healthier and Specialty Syrups
One significant opportunity in the Liquid Glucose Syrups Market lies in the development of healthier and specialty syrups. Companies can innovate by creating liquid glucose syrups with reduced sugar content, natural ingredients, or unique flavor profiles. By offering diverse and health-oriented syrup options, manufacturers can attract health-conscious consumers and drive market growth.
Liquid Glucose Syrup Market Share Analysis- Largest Segment by Type
The Intermediate Conversion (35-55 DE) segment is the largest in the Liquid Glucose Syrup Market by type. This dominance is driven by the versatility and wide range of applications for intermediate conversion glucose syrup, which offers an optimal balance of sweetness, viscosity, and humectancy. Intermediate conversion glucose syrup is widely used in the food and beverage industry, particularly in confectionery, bakery products, and beverages, to enhance texture, moisture retention, and shelf life. The continuous innovation in glucose syrup formulations, including the development of tailored syrups for specific applications, enhances their appeal. Additionally, the growing demand for processed and convenience foods supports the significant market share of the intermediate conversion segment. The extensive availability of intermediate conversion glucose syrup in the food industry and its superior performance in diverse applications reinforce its dominant position in the market.
Liquid Glucose Syrup Market Share Analysis- Fastest Growing Segment by Application
The Beverages segment is poised to grow the fastest in the Liquid Glucose Syrup Market by application over the next five years. This rapid growth is driven by the increasing demand for glucose syrup as a sweetening and texture-enhancing agent in a wide variety of beverages, including soft drinks, energy drinks, flavored waters, and fruit beverages. Glucose syrup provides desirable characteristics such as viscosity, clarity, and sweetness balance, making it a preferred ingredient in beverage formulations. The continuous innovation in beverage products, including the development of new flavors and functional beverages, supports the fast growth of the beverages segment. Additionally, the growing trend of health and wellness supports the demand for beverages that use glucose syrup as a lower-calorie alternative to other sweeteners. The expanding market for ready-to-drink beverages and the increasing focus on improving the texture and mouthfeel of beverages further drive the demand for glucose syrup in this sector.
Liquid Glucose Syrup Market Segmentation
By Type
Low Conversion 20-35 DE
Intermediate Conversion 35-55 DE
High Conversion 55-70 DE
Very High Conversion 70-98 DE
By Application
Bakery and Confectionery
Beverages
Dairy & Ice Cream
Fruit Processing
Pharmaceuticals
Others
Countries Analyzed
North America (US, Canada, Mexico)
Europe (Germany, UK, France, Spain, Italy, Russia, Rest of Europe)
Asia Pacific (China, India, Japan, South Korea, Australia, South East Asia, Rest of Asia)
South America (Brazil, Argentina, Rest of South America)
Middle East and Africa (Saudi Arabia, UAE, Rest of Middle East, South Africa, Egypt, Rest of Africa)
Liquid Glucose Syrup Companies Profiled in the Study
Archer Daniels Midland Company (ADM)
Baolingbao Biology
Cargill Inc
Grain Processing Corp
Ingredion Inc
Roquette Frères
Sukhjit Group
Tate & Lyle Plc
*- List Not Exhaustive
Chapter 1. TABLE OF CONTENTS
Chapter 2. Introduction to Liquid Glucose Syrup Market
2.1. Market Overview
2.2. Key Statistics and Report Highlights
2.3. Scope of the Comprehensive Study
2.3.1. Market Definition
2.3.2 Countries and Regions Covered
2.3.3 Research Objective
2.3.4 Units, Currency, and Conversions
2.3.5 Industry Value Chain
2.4. Key Market Segments
2.5. Key Companies
2.6. Study Period
Chapter 3. Strategic Analysis Review
3.1. Liquid Glucose Syrup Pricing Analysis and Forecast
3.2. Porter’s Five Forces
3.3. Market Ecosystem
3.4. SWOT Analysis
3.5. Regulatory Scenario
3.3. Effects of Inflation, Russia-Ukraine War, moderating economic growth, and other macroeconomic factors
Chapter 4. Competitive Landscape
4.1. Market Share Analysis
4.1.1. Global Liquid Glucose Syrup Market Share by Company, 2023
4.1.2. Product Offerings of Leading Liquid Glucose Syrup Companies
4.2. Market Entropy
4.2.1. New Product Launches in the Industry
4.2.2. Mergers, Acquisitions, Joint ventures, and Partnerships
4.3. Key Strategies and Best Practices
Chapter 5. Global Market Projections: Best, Reference, and Low Case Scenarios
5.1. Growth Analysis- Case Scenario Definitions
5.2. Low Growth Case Scenario Forecasts
5.3. Reference Growth Case Scenario Forecasts
5.4. High Growth Case Scenario Forecasts
Chapter 6. Market Dynamics
6.1. Liquid Glucose Syrup Market Drivers
6.2. Liquid Glucose Syrup Market Challenges
6.6. Liquid Glucose Syrup Market Opportunities
6.4. Liquid Glucose Syrup Market Trends
Chapter 7. Global Liquid Glucose Syrup Market Outlook Trends
7.1. Global Liquid Glucose Syrup Revenue (USD Million) and CAGR (%) by Type (2021-2032)
7.2. Global Liquid Glucose Syrup Revenue (USD Million) and CAGR (%) by Application (2021-2032)
7.3. Global Liquid Glucose Syrup Revenue (USD Million) and CAGR (%) by Product (2021-2032)
By Type
Low Conversion 20-35 DE
Intermediate Conversion 35-55 DE
High Conversion 55-70 DE
Very High Conversion 70-98 DE
By Application
Bakery and Confectionery
Beverages
Dairy & Ice Cream
Fruit Processing
Pharmaceuticals
Others
Chapter 8. Global Liquid Glucose Syrup Regional Analysis and Outlook
8.1. Global Liquid Glucose Syrup Revenue (USD Million) By Regions (2021- 2032)
8.2. North America Liquid Glucose Syrup Revenue (USD Million) by Country (2021-2032)
8.2.1. United States Liquid Glucose Syrup Regional Analysis and Outlook
8.2.2. Canada Liquid Glucose Syrup Regional Analysis and Outlook
8.2.3. Mexico Liquid Glucose Syrup Regional Analysis and Outlook
8.3. Europe Liquid Glucose Syrup Revenue (USD Million), by Country (2021-2032)
8.3.1. Germany Liquid Glucose Syrup Regional Analysis and Outlook
8.3.2. France Liquid Glucose Syrup Regional Analysis and Outlook
8.3.3. United Kingdom Liquid Glucose Syrup Regional Analysis and Outlook
8.3.4. Spain Liquid Glucose Syrup Regional Analysis and Outlook
8.3.5. Italy Liquid Glucose Syrup Regional Analysis and Outlook
8.3.6. Russia Liquid Glucose Syrup Regional Analysis and Outlook
8.3.7. Rest of Europe Liquid Glucose Syrup Regional Analysis and Outlook
8.4. Asia Pacific Liquid Glucose Syrup Revenue (USD Million) by Country (2021-2032)
8.4.1. China Liquid Glucose Syrup Regional Analysis and Outlook
8.4.2. Japan Liquid Glucose Syrup Regional Analysis and Outlook
8.4.3. India Liquid Glucose Syrup Regional Analysis and Outlook
8.4.4. South Korea Liquid Glucose Syrup Regional Analysis and Outlook
8.4.5. Australia Liquid Glucose Syrup Regional Analysis and Outlook
8.4.6. South East Asia Liquid Glucose Syrup Regional Analysis and Outlook
8.4.7. Rest of Asia Pacific Liquid Glucose Syrup Regional Analysis and Outlook
8.5. South America Liquid Glucose Syrup Revenue (USD Million), by Country (2021-2032)
8.5.1. Brazil Liquid Glucose Syrup Regional Analysis and Outlook
8.5.2. Argentina Liquid Glucose Syrup Regional Analysis and Outlook
8.5.3. Rest of South America Liquid Glucose Syrup Regional Analysis and Outlook
8.6. Middle East and Africa Liquid Glucose Syrup Revenue (USD Million) by Country (2021-2032)
8.6.1. Middle East Liquid Glucose Syrup Regional Analysis and Outlook
8.6.2. Africa Liquid Glucose Syrup Regional Analysis and Outlook
Chapter 9. North America Liquid Glucose Syrup Analysis and Outlook
9.1. North America Liquid Glucose Syrup Revenue (USD Million) by Segments (2021-2032)
9.1.1. North America Liquid Glucose Syrup Revenue (USD Million) by Type (2021-2032)
9.1.2. North America Liquid Glucose Syrup Revenue (USD Million) by Application (2021-2032)
9.1.3. North America Liquid Glucose Syrup Revenue (USD Million) by Product (2021-2032)
By Type
Low Conversion 20-35 DE
Intermediate Conversion 35-55 DE
High Conversion 55-70 DE
Very High Conversion 70-98 DE
By Application
Bakery and Confectionery
Beverages
Dairy & Ice Cream
Fruit Processing
Pharmaceuticals
Others
Chapter 10. Europe Liquid Glucose Syrup Analysis and Outlook
10.1. Europe Liquid Glucose Syrup Revenue (USD Million), by Segments (USD Million) (2021-2032)
10.1.1. Europe Liquid Glucose Syrup Revenue (USD Million) by Type (2021-2032)
10.1.2. Europe Liquid Glucose Syrup Revenue (USD Million) by Application (2021-2032)
10.1.3. Europe Liquid Glucose Syrup Revenue (USD Million) by Product (2021-2032)
By Type
Low Conversion 20-35 DE
Intermediate Conversion 35-55 DE
High Conversion 55-70 DE
Very High Conversion 70-98 DE
By Application
Bakery and Confectionery
Beverages
Dairy & Ice Cream
Fruit Processing
Pharmaceuticals
Others
Chapter 11. Asia Pacific Liquid Glucose Syrup Analysis and Outlook
11.1. Asia Pacific Liquid Glucose Syrup Revenue (USD Million), and Revenue (USD Million) by Segments (2021-2032)
11.1.1. Asia Pacific Liquid Glucose Syrup Revenue (USD Million) by Type (2021-2032)
11.1.2. Asia Pacific Liquid Glucose Syrup Revenue (USD Million) by Application (2021-2032)
11.1.3. Asia Pacific Liquid Glucose Syrup Revenue (USD Million) by Product (2021-2032)
By Type
Low Conversion 20-35 DE
Intermediate Conversion 35-55 DE
High Conversion 55-70 DE
Very High Conversion 70-98 DE
By Application
Bakery and Confectionery
Beverages
Dairy & Ice Cream
Fruit Processing
Pharmaceuticals
Others
Chapter 12. South America Liquid Glucose Syrup Analysis and Outlook
12.1. South America Liquid Glucose Syrup Revenue (USD Million), by Segments (2021-2032)
12.1.1. South America Liquid Glucose Syrup Revenue (USD Million) by Type (2021-2032)
12.1.2. South America Liquid Glucose Syrup Revenue (USD Million) by Application (2021-2032)
12.1.3. South America Liquid Glucose Syrup Revenue (USD Million) by Product (2021-2032)
By Type
Low Conversion 20-35 DE
Intermediate Conversion 35-55 DE
High Conversion 55-70 DE
Very High Conversion 70-98 DE
By Application
Bakery and Confectionery
Beverages
Dairy & Ice Cream
Fruit Processing
Pharmaceuticals
Others
Chapter 13. Middle East and Africa Liquid Glucose Syrup Analysis and Outlook
13.1. Middle East and Africa Liquid Glucose Syrup Revenue (USD Million), by Segments (2021-2032)
13.1.1. Middle East and Africa Liquid Glucose Syrup Revenue (USD Million) by Type (2021-2032)
13.1.2. Middle East and Africa Liquid Glucose Syrup Revenue (USD Million) by Application (2021-2032)
13.1.3. Middle East and Africa Liquid Glucose Syrup Revenue (USD Million) by Product (2021-2032)
By Type
Low Conversion 20-35 DE
Intermediate Conversion 35-55 DE
High Conversion 55-70 DE
Very High Conversion 70-98 DE
By Application
Bakery and Confectionery
Beverages
Dairy & Ice Cream
Fruit Processing
Pharmaceuticals
Others
Chapter 14. Liquid Glucose Syrup Company Profiles
14.1 Business Overview
14.2 Product Profiles
14.3 SWOT Profiles
14.5 Recent Developments
14.6 Financial Profile
List of Companies
Archer Daniels Midland Company (ADM)
Baolingbao Biology
Cargill Inc
Grain Processing Corp
Ingredion Inc
Roquette Frères
Sukhjit Group
Tate & Lyle Plc
15. Methodology and Data Sources
15.1 Customization Offerings
15.2 Subscription Services
15.3 Related Reports
15.4 Publisher Expertise
LIST OF TABLES
Table 1 Market Segmentation Analysis
Table 2 Global Liquid Glucose Syrup Market Share of Leading Companies, 2023
Table 3 Product Offerings of Leading Companies
Table 4 Low Growth Scenario Forecasts
Table 5 Reference Case Growth Scenario
Table 6 High Growth Case Scenario
Table 7 Global Liquid Glucose Syrup Revenue (USD Million) And CAGR (%) By Type (2021-2032)
Table 8 Global Liquid Glucose Syrup Revenue (USD Million) And CAGR (%) By Application (2021-2032)
Table 9 Global Liquid Glucose Syrup Revenue (USD Million) And CAGR (%) By Product (2021-2032)
Table 10 Global Liquid Glucose Syrup Market Revenue (USD Million) By Regions (2021-2032)
Table 11 Global Liquid Glucose Syrup Market Share (%) By Regions (2021-2032)
Table 12 North America Liquid Glucose Syrup Revenue (USD Million) By Country (2021-2032)
Table 13 Europe Liquid Glucose Syrup Revenue (USD Million) By Country (2021-2032)
Table 14 Asia Pacific Liquid Glucose Syrup Revenue (USD Million) By Country (2021-2032)
Table 15 South America Liquid Glucose Syrup Revenue (USD Million) By Country (2021-2032)
Table 16 Middle East and Africa Liquid Glucose Syrup Revenue (USD Million) By Region (2021-2032)
Table 17 North America Liquid Glucose Syrup Revenue (USD Million) By Type (2021-2032)
Table 18 North America Liquid Glucose Syrup Revenue (USD Million) By Application (2021-2032)
Table 19 North America Liquid Glucose Syrup Revenue (USD Million) By Product (2021-2032)
Table 20 Europe Liquid Glucose Syrup Revenue (USD Million) By Type (2021-2032)
Table 21 Europe Liquid Glucose Syrup Revenue (USD Million) By Application (2021-2032)
Table 22 Europe Liquid Glucose Syrup Revenue (USD Million) By Product (2021-2032)
Table 23 Asia Pacific Liquid Glucose Syrup Revenue (USD Million) By Type (2021-2032)
Table 24 Asia Pacific Liquid Glucose Syrup Revenue (USD Million) By Application (2021-2032)
Table 25 Asia Pacific Liquid Glucose Syrup Revenue (USD Million) By Product (2021-2032)
Table 26 South America Liquid Glucose Syrup Revenue (USD Million) By Type (2021-2032)
Table 27 South America Liquid Glucose Syrup Revenue (USD Million) By Application (2021-2032)
Table 28 South America Liquid Glucose Syrup Revenue (USD Million) By Product (2021-2032)
Table 29 Middle East and Africa Liquid Glucose Syrup Revenue (USD Million) By Type (2021-2032)
Table 30 Middle East and Africa Liquid Glucose Syrup Revenue (USD Million) By Application (2021-2032)
Table 31 Middle East and Africa Liquid Glucose Syrup Revenue (USD Million) By Product (2021-2032)
LIST OF FIGURES
Figure 1. Market Scope
Figure 2. Pricing Forecasts Per Unit, 2023- 2032
Figure 3. Porter’s Five Forces
Figure 4. Global Liquid Glucose Syrup Market Revenue (USD Million) By Regions (2021-2032)
Figure 5. Global Liquid Glucose Syrup Market Share (%) By Regions (2023)
Figure 6. North America Liquid Glucose Syrup Revenue (USD Million) By Country (2021-2032)
Figure 7. United States Liquid Glucose Syrup Revenue (USD Million) By Country (2021-2032)
Figure 8. Canada Liquid Glucose Syrup Revenue (USD Million) By Country (2021-2032)
Figure 9. Mexico Liquid Glucose Syrup Revenue (USD Million) By Country (2021-2032)
Figure 10. Europe Liquid Glucose Syrup Revenue (USD Million) By Country (2021-2032)
Figure 11. Germany Liquid Glucose Syrup Revenue (USD Million) By Country (2021-2032)
Figure 12. France Liquid Glucose Syrup Revenue (USD Million) By Country (2021-2032)
Figure 13. United Kingdom Liquid Glucose Syrup Revenue (USD Million) By Country (2021-2032)
Figure 14. Spain Liquid Glucose Syrup Revenue (USD Million) By Country (2021-2032)
Figure 15. Italy Liquid Glucose Syrup Revenue (USD Million) By Country (2021-2032)
Figure 16. Russia Liquid Glucose Syrup Revenue (USD Million) By Country (2021-2032)
Figure 17. Rest of Europe Liquid Glucose Syrup Revenue (USD Million) By Country (2021-2032)
Figure 11. Asia Pacific Liquid Glucose Syrup Revenue (USD Million) By Country (2021-2032)
Figure 12. China Liquid Glucose Syrup Revenue (USD Million) By Country (2021-2032)
Figure 13. Japan Liquid Glucose Syrup Revenue (USD Million) By Country (2021-2032)
Figure 14. India Liquid Glucose Syrup Revenue (USD Million) By Country (2021-2032)
Figure 15. South Korea Liquid Glucose Syrup Revenue (USD Million) By Country (2021-2032)
Figure 16. Australia Liquid Glucose Syrup Revenue (USD Million) By Country (2021-2032)
Figure 17. South East Asia Liquid Glucose Syrup Revenue (USD Million) By Country (2021-2032)
Figure 18. South America Liquid Glucose Syrup Revenue (USD Million) By Country (2021-2032)
Figure 19. Brazil Liquid Glucose Syrup Revenue (USD Million) By Country (2021-2032)
Figure 20. Argentina Liquid Glucose Syrup Revenue (USD Million) By Country (2021-2032)
Figure 21. Rest of Asia Pacific Liquid Glucose Syrup Revenue (USD Million) By Country (2021-2032)
Figure 22. Middle East and Africa Liquid Glucose Syrup Revenue (USD Million) By Region (2021-2032)
Figure 23. Saudi Arabia Liquid Glucose Syrup Revenue (USD Million) By Region (2021-2032)
Figure 24. The UAE Liquid Glucose Syrup Revenue (USD Million) By Region (2021-2032)
Figure 25. Rest of Middle East Liquid Glucose Syrup Revenue (USD Million) By Region (2021-2032)
Figure 26. South Africa Liquid Glucose Syrup Revenue (USD Million) By Region (2021-2032)
Figure 27. Africa Liquid Glucose Syrup Revenue (USD Million) By Region (2021-2032)
Figure 28. North America Liquid Glucose Syrup Revenue (USD Million) By Type (2021-2032)
Figure 29. North America Liquid Glucose Syrup Revenue (USD Million) By Application (2021-2032)
Figure 30. North America Liquid Glucose Syrup Revenue (USD Million) By Product (2021-2032)
Figure 31. Europe Liquid Glucose Syrup Revenue (USD Million) By Type (2021-2032)
Figure 32. Europe Liquid Glucose Syrup Revenue (USD Million) By Application (2021-2032)
Figure 33. Europe Liquid Glucose Syrup Revenue (USD Million) By Product (2021-2032)
Figure 34. Asia Pacific Liquid Glucose Syrup Revenue (USD Million) By Type (2021-2032)
Figure 35. Asia Pacific Liquid Glucose Syrup Revenue (USD Million) By Application (2021-2032)
Figure 36. Asia Pacific Liquid Glucose Syrup Revenue (USD Million) By Product (2021-2032)
Figure 37. South America Liquid Glucose Syrup Revenue (USD Million) By Type (2021-2032)
Figure 38. South America Liquid Glucose Syrup Revenue (USD Million) By Application (2021-2032)
Figure 39. South America Liquid Glucose Syrup Revenue (USD Million) By Product (2021-2032)
Figure 40. Middle East and Africa Liquid Glucose Syrup Revenue (USD Million) By Type (2021-2032)
Figure 41. Middle East and Africa Liquid Glucose Syrup Revenue (USD Million) By Application (2021-2032)
Figure 42. Middle East and Africa Liquid Glucose Syrup Revenue (USD Million) By Product (2021-2032)
By Type
Low Conversion 20-35 DE
Intermediate Conversion 35-55 DE
High Conversion 55-70 DE
Very High Conversion 70-98 DE
By Application
Bakery and Confectionery
Beverages
Dairy & Ice Cream
Fruit Processing
Pharmaceuticals
Others
Countries Analyzed
North America (US, Canada, Mexico)
Europe (Germany, UK, France, Spain, Italy, Russia, Rest of Europe)
Asia Pacific (China, India, Japan, South Korea, Australia, South East Asia, Rest of Asia)
South America (Brazil, Argentina, Rest of South America)
Middle East and Africa (Saudi Arabia, UAE, Rest of Middle East, South Africa, Egypt, Rest of Africa)
