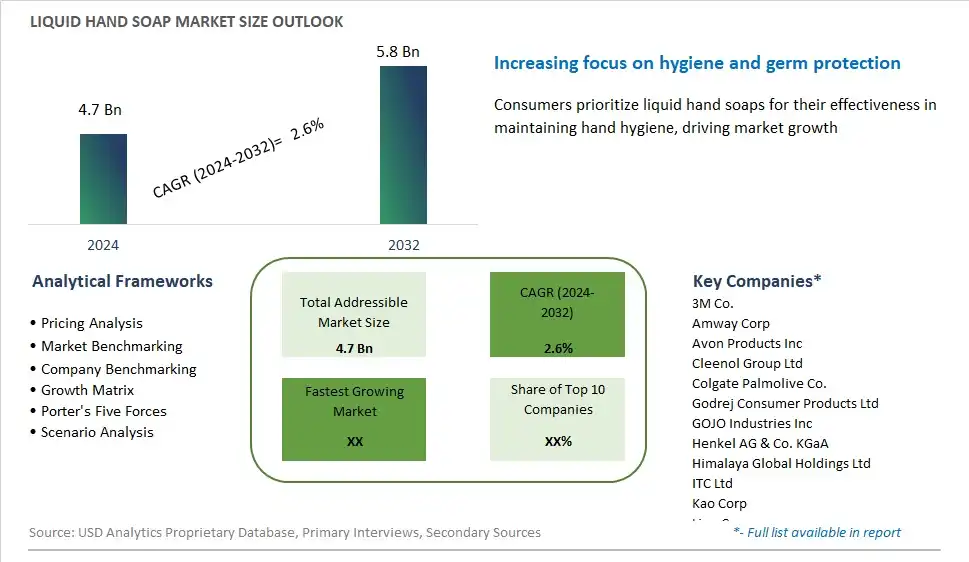
Global Liquid Hand Soap Market Size is valued at $4.7 Billion in 2024 and is forecast to register a growth rate (CAGR) of 2.6% to reach $5.8 Billion by 2032.
The global Liquid Hand Soap Market Comprehensive Study analyzes and forecasts the market size across 6 regions and 24 countries for diverse segments -By Type (Synthetic, Organic), By Packaging (Pump Dispensers, Bottles/Containers, Pouches), By Distribution Channel (Supermarkets/Hypermarkets, Convenience Stores, Online Retailers, Others)
An Introduction to Liquid Hand Soap Market
In 2024, the liquid hand soap market remains a cornerstone of personal hygiene and cleanliness, serving as a convenient and effective solution for handwashing in homes, workplaces, and public settings. Liquid hand soap, available in a variety of formulations and fragrances, offers superior convenience and hygiene compared to bar soap, dispensing easily and minimizing the risk of bacterial contamination. With increased awareness of the importance of hand hygiene in preventing the spread of infectious diseases, demand for liquid hand soap has surged, driving innovation in antibacterial, moisturizing, and eco-friendly formulations. Moreover, the market is witnessing a shift towards sustainable packaging options, such as refillable bottles and biodegradable materials, as consumers prioritize environmental responsibility in their purchasing decisions. In 2024, the liquid hand soap market is expected to continue expanding as hygiene remains a top priority for individuals and institutions alike, driving demand for products that combine efficacy, convenience, and sustainability.
Liquid Hand Soap Competitive Landscape
The market report analyses the leading companies in the industry including 3M Co., Amway Corp, Avon Products Inc, Cleenol Group Ltd, Colgate Palmolive Co., Godrej Consumer Products Ltd, GOJO Industries Inc, Henkel AG & Co. KGaA, Himalaya Global Holdings Ltd, ITC Ltd, Kao Corp, Lion Corp, Longrich Bioscience Co. Ltd, Pental Ltd, Premier English Manufacturing Ltd, Reckitt Benckiser Group PLC, Shri Sahib Enterprises LLP, Unilever PLC, Vi Jon Inc, and Others.
Liquid Hand Soap Market Dynamics
Liquid Hand Soap Market Trend: Growing Preference for Hygiene and Wellness Products
The market for liquid hand soap is experiencing a prominent trend towards the growing preference for hygiene and wellness products, driven by factors such as increasing awareness of hand hygiene, rising concern over infectious diseases, and the importance of personal wellness routines. As consumers prioritize cleanliness and health in their daily lives, there is a heightened demand for liquid hand soap known for its effectiveness in removing germs, dirt, and bacteria while also nourishing and moisturizing the skin. This trend is fueled by public health campaigns, hygiene education initiatives, and endorsements from health professionals advocating for regular handwashing practices, driving market growth and adoption among health-conscious consumers seeking products that promote cleanliness and well-being.
Market Driver: Influence of Cleanliness Standards and Regulations
A significant driver behind the market for liquid hand soap is the influence of cleanliness standards and regulations, driven by factors such as government mandates, industry guidelines, and public health recommendations promoting hand hygiene as a preventive measure against infectious diseases. As regulatory agencies impose stricter hygiene requirements in public spaces, healthcare facilities, and foodservice establishments, there is a heightened demand for liquid hand soap products that meet safety and efficacy standards for germ removal and skin protection. This driver is further fueled by the implementation of hand hygiene protocols in workplaces, schools, and recreational venues, driving market growth and consumption of liquid hand soap as an essential hygiene product for maintaining cleanliness and preventing the spread of illness.
Market Opportunity: Expansion into Eco-Friendly and Sustainable Formulations
An opportunity exists for manufacturers of liquid hand soap to expand their product offerings into eco-friendly and sustainable formulations to cater to evolving consumer preferences and environmental concerns. By developing liquid hand soap formulations made from biodegradable ingredients, plant-based surfactants, and renewable resources, manufacturers can appeal to environmentally conscious consumers seeking products that minimize environmental impact and support sustainability initiatives. Moreover, exploring opportunities in refillable packaging, reduced plastic waste, or carbon-neutral production processes can enhance brand sustainability and attract eco-conscious consumers looking for greener alternatives in the market for liquid hand soap. This opportunity allows manufacturers to differentiate their products, meet regulatory requirements, and capture market share in the growing segment of eco-friendly hygiene and wellness products, positioning themselves as leaders in sustainable hand care solutions.
Liquid Hand Soap Market Share Analysis: Synthetic held the dominant market share in 2024
In the liquid hand soap market, the synthetic type is the largest segment, driven by its widespread availability, affordability, and effectiveness in delivering cleansing and antibacterial properties. Synthetic liquid hand soaps typically contain chemical ingredients such as surfactants and preservatives that are formulated to effectively remove dirt, grease, and germs from hands, making them a popular choice for everyday use in homes, workplaces, and public facilities. Additionally, the stable shelf life and consistent performance of synthetic hand soaps appeal to consumers seeking reliable hygiene solutions. Further, the lower production costs associated with synthetic formulations enable manufacturers to offer competitive pricing, further bolstering the dominance of the synthetic segment in the liquid hand soap market. While organic hand soaps cater to niche markets seeking natural and eco-friendly alternatives, the affordability and efficacy of synthetic options make them the preferred choice for the majority of consumers, driving their continued dominance in the market.
Liquid Hand Soap Market Share Analysis: Pump Dispensers market is poised to register the fastest growth rae over the forecast period to 2032
Among the packaging options in the liquid hand soap market, pump dispensers are witnessing rapid growth, propelled by their convenience, hygiene benefits, and sustainability appeal. Pump dispensers offer easy and mess-free access to liquid hand soap, reducing product wastage and ensuring precise dosage with each use, making them a preferred choice for consumers seeking efficiency and cleanliness in hand hygiene routines. Additionally, the sealed and airtight nature of pump dispensers helps to preserve the freshness and quality of the liquid hand soap, prolonging its shelf life and maintaining its efficacy over time. Further, the growing awareness of environmental concerns and plastic waste reduction drives the demand for refillable pump dispensers, which allow consumers to reuse the dispenser mechanism with refill pouches or bulk liquid soap containers, minimizing single-use plastic consumption. As sustainability becomes an increasingly important factor in consumer purchasing decisions, pump dispensers emerge as a sustainable and eco-friendly packaging solution, driving their rapid growth in the liquid hand soap market.
Liquid Hand Soap Market Share Analysis: Supermarkets/Hypermarkets held the dominant market share in 2024
In the liquid hand soap market, supermarkets and hypermarkets stand out as the largest segment, owing to their extensive reach, diverse product offerings, and consumer convenience. These retail giants serve as one-stop destinations for household essentials, including liquid hand soaps, attracting a vast consumer base through their widespread physical presence and strategic locations. Further, supermarkets and hypermarkets offer a wide variety of brands and formulations, catering to different preferences and budgets, thus appealing to a broad spectrum of consumers. The ability to browse and compare products in-store, coupled with the immediate availability of liquid hand soaps, further enhances the shopping experience for consumers. Additionally, promotional activities and bulk purchase options in supermarkets and hypermarkets incentivize consumers to stock up on liquid hand soaps, driving sales volume and consolidating the dominance of this distribution channel in the market. As consumers continue to prioritize convenience and value-driven shopping experiences, supermarkets and hypermarkets are poised to maintain their leading position in the liquid hand soap market.
Liquid Hand Soap Market Segmentation
By Type
Synthetic
Organic
By Packaging
Pump Dispensers
Bottles/Containers
Pouches
By Distribution Channel
Supermarkets/Hypermarkets
Convenience Stores
Online Retailers
Others
Countries Analyzed
North America (US, Canada, Mexico)
Europe (Germany, UK, France, Spain, Italy, Russia, Rest of Europe)
Asia Pacific (China, India, Japan, South Korea, Australia, South East Asia, Rest of Asia)
South America (Brazil, Argentina, Rest of South America)
Middle East and Africa (Saudi Arabia, UAE, Rest of Middle East, South Africa, Egypt, Rest of Africa)
Liquid Hand Soap Companies Profiled in the Study
3M Co.
Amway Corp
Avon Products Inc
Cleenol Group Ltd
Colgate Palmolive Co.
Godrej Consumer Products Ltd
GOJO Industries Inc
Henkel AG & Co. KGaA
Himalaya Global Holdings Ltd
ITC Ltd
Kao Corp
Lion Corp
Longrich Bioscience Co. Ltd
Pental Ltd
Premier English Manufacturing Ltd
Reckitt Benckiser Group PLC
Shri Sahib Enterprises LLP
Unilever PLC
Vi Jon Inc
*- List Not Exhaustive
Chapter 1. TABLE OF CONTENTS
Chapter 2. Introduction to Liquid Hand Soap Market
2.1. Market Overview
2.2. Key Statistics and Report Highlights
2.3. Scope of the Comprehensive Study
2.3.1. Market Definition
2.3.2 Countries and Regions Covered
2.3.3 Research Objective
2.3.4 Units, Currency, and Conversions
2.3.5 Industry Value Chain
2.4. Key Market Segments
2.5. Key Companies
2.6. Study Period
Chapter 3. Strategic Analysis Review
3.1. Liquid Hand Soap Pricing Analysis and Forecast
3.2. Porter’s Five Forces
3.3. Market Ecosystem
3.4. SWOT Analysis
3.5. Regulatory Scenario
3.3. Effects of Inflation, Russia-Ukraine War, moderating economic growth, and other macroeconomic factors
Chapter 4. Competitive Landscape
4.1. Market Share Analysis
4.1.1. Global Liquid Hand Soap Market Share by Company, 2023
4.1.2. Product Offerings of Leading Liquid Hand Soap Companies
4.2. Market Entropy
4.2.1. New Product Launches in the Industry
4.2.2. Mergers, Acquisitions, Joint ventures, and Partnerships
4.3. Key Strategies and Best Practices
Chapter 5. Global Market Projections: Best, Reference, and Low Case Scenarios
5.1. Growth Analysis- Case Scenario Definitions
5.2. Low Growth Case Scenario Forecasts
5.3. Reference Growth Case Scenario Forecasts
5.4. High Growth Case Scenario Forecasts
Chapter 6. Market Dynamics
6.1. Liquid Hand Soap Market Drivers
6.2. Liquid Hand Soap Market Challenges
6.6. Liquid Hand Soap Market Opportunities
6.4. Liquid Hand Soap Market Trends
Chapter 7. Global Liquid Hand Soap Market Outlook Trends
7.1. Global Liquid Hand Soap Revenue (USD Million) and CAGR (%) by Type (2021-2032)
7.2. Global Liquid Hand Soap Revenue (USD Million) and CAGR (%) by Application (2021-2032)
7.3. Global Liquid Hand Soap Revenue (USD Million) and CAGR (%) by Product (2021-2032)
By Type
Synthetic
Organic
By Packaging
Pump Dispensers
Bottles/Containers
Pouches
By Distribution Channel
Supermarkets/Hypermarkets
Convenience Stores
Online Retailers
Others
Chapter 8. Global Liquid Hand Soap Regional Analysis and Outlook
8.1. Global Liquid Hand Soap Revenue (USD Million) By Regions (2021- 2032)
8.2. North America Liquid Hand Soap Revenue (USD Million) by Country (2021-2032)
8.2.1. United States Liquid Hand Soap Regional Analysis and Outlook
8.2.2. Canada Liquid Hand Soap Regional Analysis and Outlook
8.2.3. Mexico Liquid Hand Soap Regional Analysis and Outlook
8.3. Europe Liquid Hand Soap Revenue (USD Million), by Country (2021-2032)
8.3.1. Germany Liquid Hand Soap Regional Analysis and Outlook
8.3.2. France Liquid Hand Soap Regional Analysis and Outlook
8.3.3. United Kingdom Liquid Hand Soap Regional Analysis and Outlook
8.3.4. Spain Liquid Hand Soap Regional Analysis and Outlook
8.3.5. Italy Liquid Hand Soap Regional Analysis and Outlook
8.3.6. Russia Liquid Hand Soap Regional Analysis and Outlook
8.3.7. Rest of Europe Liquid Hand Soap Regional Analysis and Outlook
8.4. Asia Pacific Liquid Hand Soap Revenue (USD Million) by Country (2021-2032)
8.4.1. China Liquid Hand Soap Regional Analysis and Outlook
8.4.2. Japan Liquid Hand Soap Regional Analysis and Outlook
8.4.3. India Liquid Hand Soap Regional Analysis and Outlook
8.4.4. South Korea Liquid Hand Soap Regional Analysis and Outlook
8.4.5. Australia Liquid Hand Soap Regional Analysis and Outlook
8.4.6. South East Asia Liquid Hand Soap Regional Analysis and Outlook
8.4.7. Rest of Asia Pacific Liquid Hand Soap Regional Analysis and Outlook
8.5. South America Liquid Hand Soap Revenue (USD Million), by Country (2021-2032)
8.5.1. Brazil Liquid Hand Soap Regional Analysis and Outlook
8.5.2. Argentina Liquid Hand Soap Regional Analysis and Outlook
8.5.3. Rest of South America Liquid Hand Soap Regional Analysis and Outlook
8.6. Middle East and Africa Liquid Hand Soap Revenue (USD Million) by Country (2021-2032)
8.6.1. Middle East Liquid Hand Soap Regional Analysis and Outlook
8.6.2. Africa Liquid Hand Soap Regional Analysis and Outlook
Chapter 9. North America Liquid Hand Soap Analysis and Outlook
9.1. North America Liquid Hand Soap Revenue (USD Million) by Segments (2021-2032)
9.1.1. North America Liquid Hand Soap Revenue (USD Million) by Type (2021-2032)
9.1.2. North America Liquid Hand Soap Revenue (USD Million) by Application (2021-2032)
9.1.3. North America Liquid Hand Soap Revenue (USD Million) by Product (2021-2032)
By Type
Synthetic
Organic
By Packaging
Pump Dispensers
Bottles/Containers
Pouches
By Distribution Channel
Supermarkets/Hypermarkets
Convenience Stores
Online Retailers
Others
Chapter 10. Europe Liquid Hand Soap Analysis and Outlook
10.1. Europe Liquid Hand Soap Revenue (USD Million), by Segments (USD Million) (2021-2032)
10.1.1. Europe Liquid Hand Soap Revenue (USD Million) by Type (2021-2032)
10.1.2. Europe Liquid Hand Soap Revenue (USD Million) by Application (2021-2032)
10.1.3. Europe Liquid Hand Soap Revenue (USD Million) by Product (2021-2032)
By Type
Synthetic
Organic
By Packaging
Pump Dispensers
Bottles/Containers
Pouches
By Distribution Channel
Supermarkets/Hypermarkets
Convenience Stores
Online Retailers
Others
Chapter 11. Asia Pacific Liquid Hand Soap Analysis and Outlook
11.1. Asia Pacific Liquid Hand Soap Revenue (USD Million), and Revenue (USD Million) by Segments (2021-2032)
11.1.1. Asia Pacific Liquid Hand Soap Revenue (USD Million) by Type (2021-2032)
11.1.2. Asia Pacific Liquid Hand Soap Revenue (USD Million) by Application (2021-2032)
11.1.3. Asia Pacific Liquid Hand Soap Revenue (USD Million) by Product (2021-2032)
By Type
Synthetic
Organic
By Packaging
Pump Dispensers
Bottles/Containers
Pouches
By Distribution Channel
Supermarkets/Hypermarkets
Convenience Stores
Online Retailers
Others
Chapter 12. South America Liquid Hand Soap Analysis and Outlook
12.1. South America Liquid Hand Soap Revenue (USD Million), by Segments (2021-2032)
12.1.1. South America Liquid Hand Soap Revenue (USD Million) by Type (2021-2032)
12.1.2. South America Liquid Hand Soap Revenue (USD Million) by Application (2021-2032)
12.1.3. South America Liquid Hand Soap Revenue (USD Million) by Product (2021-2032)
By Type
Synthetic
Organic
By Packaging
Pump Dispensers
Bottles/Containers
Pouches
By Distribution Channel
Supermarkets/Hypermarkets
Convenience Stores
Online Retailers
Others
Chapter 13. Middle East and Africa Liquid Hand Soap Analysis and Outlook
13.1. Middle East and Africa Liquid Hand Soap Revenue (USD Million), by Segments (2021-2032)
13.1.1. Middle East and Africa Liquid Hand Soap Revenue (USD Million) by Type (2021-2032)
13.1.2. Middle East and Africa Liquid Hand Soap Revenue (USD Million) by Application (2021-2032)
13.1.3. Middle East and Africa Liquid Hand Soap Revenue (USD Million) by Product (2021-2032)
By Type
Synthetic
Organic
By Packaging
Pump Dispensers
Bottles/Containers
Pouches
By Distribution Channel
Supermarkets/Hypermarkets
Convenience Stores
Online Retailers
Others
Chapter 14. Liquid Hand Soap Company Profiles
14.1 Business Overview
14.2 Product Profiles
14.3 SWOT Profiles
14.5 Recent Developments
14.6 Financial Profile
List of Companies
3M Co.
Amway Corp
Avon Products Inc
Cleenol Group Ltd
Colgate Palmolive Co.
Godrej Consumer Products Ltd
GOJO Industries Inc
Henkel AG & Co. KGaA
Himalaya Global Holdings Ltd
ITC Ltd
Kao Corp
Lion Corp
Longrich Bioscience Co. Ltd
Pental Ltd
Premier English Manufacturing Ltd
Reckitt Benckiser Group PLC
Shri Sahib Enterprises LLP
Unilever PLC
Vi Jon Inc
15. Methodology and Data Sources
15.1 Customization Offerings
15.2 Subscription Services
15.3 Related Reports
15.4 Publisher Expertise
LIST OF TABLES
Table 1 Market Segmentation Analysis
Table 2 Global Liquid Hand Soap Market Share of Leading Companies, 2023
Table 3 Product Offerings of Leading Companies
Table 4 Low Growth Scenario Forecasts
Table 5 Reference Case Growth Scenario
Table 6 High Growth Case Scenario
Table 7 Global Liquid Hand Soap Revenue (USD Million) And CAGR (%) By Type (2021-2032)
Table 8 Global Liquid Hand Soap Revenue (USD Million) And CAGR (%) By Application (2021-2032)
Table 9 Global Liquid Hand Soap Revenue (USD Million) And CAGR (%) By Product (2021-2032)
Table 10 Global Liquid Hand Soap Market Revenue (USD Million) By Regions (2021-2032)
Table 11 Global Liquid Hand Soap Market Share (%) By Regions (2021-2032)
Table 12 North America Liquid Hand Soap Revenue (USD Million) By Country (2021-2032)
Table 13 Europe Liquid Hand Soap Revenue (USD Million) By Country (2021-2032)
Table 14 Asia Pacific Liquid Hand Soap Revenue (USD Million) By Country (2021-2032)
Table 15 South America Liquid Hand Soap Revenue (USD Million) By Country (2021-2032)
Table 16 Middle East and Africa Liquid Hand Soap Revenue (USD Million) By Region (2021-2032)
Table 17 North America Liquid Hand Soap Revenue (USD Million) By Type (2021-2032)
Table 18 North America Liquid Hand Soap Revenue (USD Million) By Application (2021-2032)
Table 19 North America Liquid Hand Soap Revenue (USD Million) By Product (2021-2032)
Table 20 Europe Liquid Hand Soap Revenue (USD Million) By Type (2021-2032)
Table 21 Europe Liquid Hand Soap Revenue (USD Million) By Application (2021-2032)
Table 22 Europe Liquid Hand Soap Revenue (USD Million) By Product (2021-2032)
Table 23 Asia Pacific Liquid Hand Soap Revenue (USD Million) By Type (2021-2032)
Table 24 Asia Pacific Liquid Hand Soap Revenue (USD Million) By Application (2021-2032)
Table 25 Asia Pacific Liquid Hand Soap Revenue (USD Million) By Product (2021-2032)
Table 26 South America Liquid Hand Soap Revenue (USD Million) By Type (2021-2032)
Table 27 South America Liquid Hand Soap Revenue (USD Million) By Application (2021-2032)
Table 28 South America Liquid Hand Soap Revenue (USD Million) By Product (2021-2032)
Table 29 Middle East and Africa Liquid Hand Soap Revenue (USD Million) By Type (2021-2032)
Table 30 Middle East and Africa Liquid Hand Soap Revenue (USD Million) By Application (2021-2032)
Table 31 Middle East and Africa Liquid Hand Soap Revenue (USD Million) By Product (2021-2032)
LIST OF FIGURES
Figure 1. Market Scope
Figure 2. Pricing Forecasts Per Unit, 2023- 2032
Figure 3. Porter’s Five Forces
Figure 4. Global Liquid Hand Soap Market Revenue (USD Million) By Regions (2021-2032)
Figure 5. Global Liquid Hand Soap Market Share (%) By Regions (2023)
Figure 6. North America Liquid Hand Soap Revenue (USD Million) By Country (2021-2032)
Figure 7. United States Liquid Hand Soap Revenue (USD Million) By Country (2021-2032)
Figure 8. Canada Liquid Hand Soap Revenue (USD Million) By Country (2021-2032)
Figure 9. Mexico Liquid Hand Soap Revenue (USD Million) By Country (2021-2032)
Figure 10. Europe Liquid Hand Soap Revenue (USD Million) By Country (2021-2032)
Figure 11. Germany Liquid Hand Soap Revenue (USD Million) By Country (2021-2032)
Figure 12. France Liquid Hand Soap Revenue (USD Million) By Country (2021-2032)
Figure 13. United Kingdom Liquid Hand Soap Revenue (USD Million) By Country (2021-2032)
Figure 14. Spain Liquid Hand Soap Revenue (USD Million) By Country (2021-2032)
Figure 15. Italy Liquid Hand Soap Revenue (USD Million) By Country (2021-2032)
Figure 16. Russia Liquid Hand Soap Revenue (USD Million) By Country (2021-2032)
Figure 17. Rest of Europe Liquid Hand Soap Revenue (USD Million) By Country (2021-2032)
Figure 11. Asia Pacific Liquid Hand Soap Revenue (USD Million) By Country (2021-2032)
Figure 12. China Liquid Hand Soap Revenue (USD Million) By Country (2021-2032)
Figure 13. Japan Liquid Hand Soap Revenue (USD Million) By Country (2021-2032)
Figure 14. India Liquid Hand Soap Revenue (USD Million) By Country (2021-2032)
Figure 15. South Korea Liquid Hand Soap Revenue (USD Million) By Country (2021-2032)
Figure 16. Australia Liquid Hand Soap Revenue (USD Million) By Country (2021-2032)
Figure 17. South East Asia Liquid Hand Soap Revenue (USD Million) By Country (2021-2032)
Figure 18. South America Liquid Hand Soap Revenue (USD Million) By Country (2021-2032)
Figure 19. Brazil Liquid Hand Soap Revenue (USD Million) By Country (2021-2032)
Figure 20. Argentina Liquid Hand Soap Revenue (USD Million) By Country (2021-2032)
Figure 21. Rest of Asia Pacific Liquid Hand Soap Revenue (USD Million) By Country (2021-2032)
Figure 22. Middle East and Africa Liquid Hand Soap Revenue (USD Million) By Region (2021-2032)
Figure 23. Saudi Arabia Liquid Hand Soap Revenue (USD Million) By Region (2021-2032)
Figure 24. The UAE Liquid Hand Soap Revenue (USD Million) By Region (2021-2032)
Figure 25. Rest of Middle East Liquid Hand Soap Revenue (USD Million) By Region (2021-2032)
Figure 26. South Africa Liquid Hand Soap Revenue (USD Million) By Region (2021-2032)
Figure 27. Africa Liquid Hand Soap Revenue (USD Million) By Region (2021-2032)
Figure 28. North America Liquid Hand Soap Revenue (USD Million) By Type (2021-2032)
Figure 29. North America Liquid Hand Soap Revenue (USD Million) By Application (2021-2032)
Figure 30. North America Liquid Hand Soap Revenue (USD Million) By Product (2021-2032)
Figure 31. Europe Liquid Hand Soap Revenue (USD Million) By Type (2021-2032)
Figure 32. Europe Liquid Hand Soap Revenue (USD Million) By Application (2021-2032)
Figure 33. Europe Liquid Hand Soap Revenue (USD Million) By Product (2021-2032)
Figure 34. Asia Pacific Liquid Hand Soap Revenue (USD Million) By Type (2021-2032)
Figure 35. Asia Pacific Liquid Hand Soap Revenue (USD Million) By Application (2021-2032)
Figure 36. Asia Pacific Liquid Hand Soap Revenue (USD Million) By Product (2021-2032)
Figure 37. South America Liquid Hand Soap Revenue (USD Million) By Type (2021-2032)
Figure 38. South America Liquid Hand Soap Revenue (USD Million) By Application (2021-2032)
Figure 39. South America Liquid Hand Soap Revenue (USD Million) By Product (2021-2032)
Figure 40. Middle East and Africa Liquid Hand Soap Revenue (USD Million) By Type (2021-2032)
Figure 41. Middle East and Africa Liquid Hand Soap Revenue (USD Million) By Application (2021-2032)
Figure 42. Middle East and Africa Liquid Hand Soap Revenue (USD Million) By Product (2021-2032)
By Type
Synthetic
Organic
By Packaging
Pump Dispensers
Bottles/Containers
Pouches
By Distribution Channel
Supermarkets/Hypermarkets
Convenience Stores
Online Retailers
Others
Countries Analyzed
North America (US, Canada, Mexico)
Europe (Germany, UK, France, Spain, Italy, Russia, Rest of Europe)
Asia Pacific (China, India, Japan, South Korea, Australia, South East Asia, Rest of Asia)
South America (Brazil, Argentina, Rest of South America)
Middle East and Africa (Saudi Arabia, UAE, Rest of Middle East, South Africa, Egypt, Rest of Africa)
