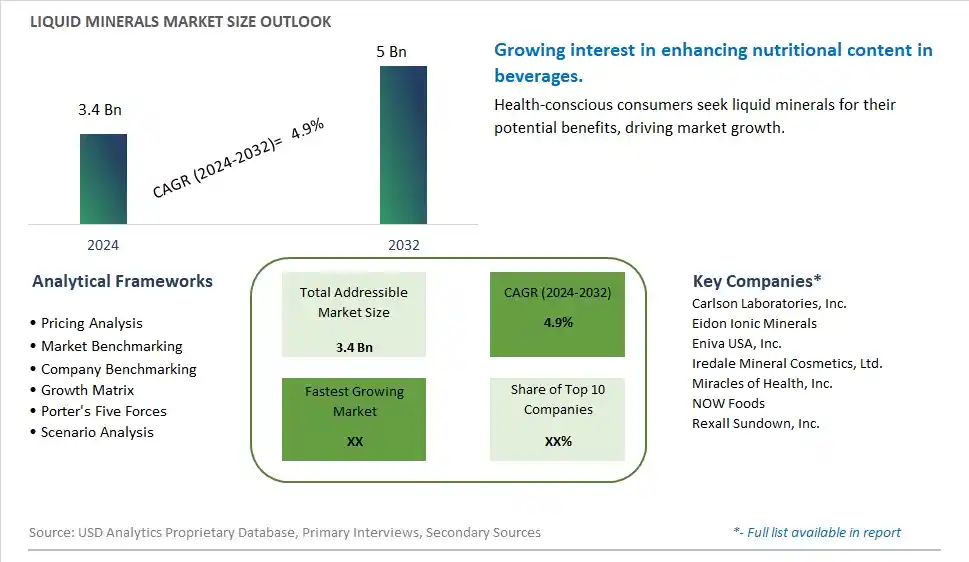
Global Liquid Minerals Market Size is valued at $3.4 Billion in 2024 and is forecast to register a growth rate (CAGR) of 4.9% to reach $5 Billion by 2032.
The global Liquid Minerals Market Comprehensive Study analyzes and forecasts the market size across 6 regions and 24 countries for diverse segments -By Type (Iron Ingredient, Calcium Ingredient, Magnesium Ingredient, Others), By Application (Dietary supplement, Animal feed supplement, Cosmetics, Others)
An Introduction to Liquid Minerals Market
The liquid minerals market in 2024 is expanding rapidly, driven by the increasing demand for bioavailable and convenient mineral supplements. Liquid minerals, including essential elements like calcium, magnesium, and iron, are valued for their ease of absorption and use in dietary supplements, functional foods, and beverages. The market benefits from innovations in mineral extraction and formulation technologies that enhance bioavailability and taste. The trend towards preventive healthcare and the rising popularity of wellness products are influencing market dynamics. Increasing consumer interest in personalized nutrition and the rise of e-commerce are further propelling demand for liquid minerals.
Liquid Minerals Competitive Landscape
The market report analyses the leading companies in the industry including Carlson Laboratories, Inc., Eidon Ionic Minerals, Eniva USA, Inc., Iredale Mineral Cosmetics, Ltd., Miracles of Health, Inc., NOW Foods, Rexall Sundown, Inc., and Others.
Liquid Minerals Market Dynamics
Liquid Minerals Market Trend: Growing Demand for Liquid Supplements
The most prominent trend in the Liquid Minerals Market is the growing demand for liquid supplements. Liquid minerals, which offer a convenient and easily absorbable form of essential nutrients, are becoming increasingly popular among consumers seeking effective and hassle-free supplementation. This trend is driven by the rising interest in health and wellness.
Liquid Minerals Market Driver: Increasing Awareness of Mineral Deficiencies
A key driver in the Liquid Minerals Market is the increasing awareness of mineral deficiencies. As more individuals recognize the importance of minerals for overall health, there is a growing demand for supplements that address common deficiencies, such as magnesium, calcium, and iron. Liquid minerals offer an efficient way to deliver these essential nutrients, supporting market growth.
Liquid Minerals Market Opportunity: Development of Targeted Mineral Formulations
One significant opportunity in the Liquid Minerals Market lies in the development of targeted mineral formulations. Companies can innovate by creating liquid mineral supplements tailored to specific health needs, such as bone health, immune support, or energy enhancement. By offering specialized formulations, manufacturers can attract a broader consumer base and drive market growth.
Liquid Minerals Market Share Analysis: Calcium Ingredient segment generated the highest revenue share in the industry
Among the segments in the Liquid Minerals market, the Calcium Ingredient segment stands out as the largest. Calcium is an essential mineral vital for bone health, muscle function, nerve transmission, and overall cardiovascular health. It is widely used in various industries, including food and beverages, dietary supplements, pharmaceuticals, and personal care products. The demand for liquid calcium ingredients is driven by increasing awareness of bone health and osteoporosis prevention among aging populations globally. Further, dietary supplement manufacturers prefer liquid forms of calcium due to their higher bioavailability and easier absorption compared to traditional solid forms. In the food and beverage industry, liquid calcium ingredients are incorporated into fortified products such as juices, dairy alternatives, and functional beverages to enhance nutritional value. The pharmaceutical sector also utilizes liquid calcium in formulations targeting calcium deficiency disorders and as an ingredient in antacids. As consumer preferences for convenient and health-enhancing products continue to grow, the Calcium Ingredient segment of the Liquid Minerals market is expected to maintain its dominance and witness steady growth across diverse applications.
Liquid Minerals Market Share Analysis: Dietary Supplement Application is the fastest growing segment over the forecast period to 2032
Within the Liquid Minerals market, the Dietary Supplement application segment is experiencing significant growth and is poised to continue expanding rapidly through 2032. This growth is driven by increasing consumer awareness of the importance of mineral supplementation for overall health and wellness. Liquid minerals offer advantages such as better absorption rates compared to traditional solid supplements, making them more effective in meeting daily nutritional needs. The dietary supplement industry, in particular, is witnessing a surge in demand for liquid mineral formulations due to their convenience and bioavailability. Consumers are increasingly opting for supplements that are easy to ingest and assimilate, which has spurred innovation and product development in the liquid minerals sector. Key minerals such as iron, calcium, magnesium, zinc, and others are crucial for maintaining various bodily functions, from bone health and muscle function to immune support and cognitive health. As dietary preferences shift towards health-conscious choices, including vegan and gluten-free options, liquid minerals provide a versatile solution for supplement manufacturers to meet evolving consumer demands. Hence, the Dietary Supplement application segment is expected to lead the growth trajectory in the Liquid Minerals market, driven by ongoing advancements in formulation technologies and increasing consumer adoption of wellness-oriented lifestyles.
Liquid Minerals Market Segmentation
By Type
Iron Ingredient
Calcium Ingredient
Magnesium Ingredient
Others
By Application
Dietary supplement
Animal feed supplement
Cosmetics
Others
Countries Analyzed
North America (US, Canada, Mexico)
Europe (Germany, UK, France, Spain, Italy, Russia, Rest of Europe)
Asia Pacific (China, India, Japan, South Korea, Australia, South East Asia, Rest of Asia)
South America (Brazil, Argentina, Rest of South America)
Middle East and Africa (Saudi Arabia, UAE, Rest of Middle East, South Africa, Egypt, Rest of Africa)
Liquid Minerals Companies Profiled in the Study
Carlson Laboratories, Inc.
Eidon Ionic Minerals
Eniva USA, Inc.
Iredale Mineral Cosmetics, Ltd.
Miracles of Health, Inc.
NOW Foods
Rexall Sundown, Inc.
*- List Not Exhaustive
Chapter 1. TABLE OF CONTENTS
Chapter 2. Introduction to Liquid Minerals Market
2.1. Market Overview
2.2. Key Statistics and Report Highlights
2.3. Scope of the Comprehensive Study
2.3.1. Market Definition
2.3.2 Countries and Regions Covered
2.3.3 Research Objective
2.3.4 Units, Currency, and Conversions
2.3.5 Industry Value Chain
2.4. Key Market Segments
2.5. Key Companies
2.6. Study Period
Chapter 3. Strategic Analysis Review
3.1. Liquid Minerals Pricing Analysis and Forecast
3.2. Porter’s Five Forces
3.3. Market Ecosystem
3.4. SWOT Analysis
3.5. Regulatory Scenario
3.3. Effects of Inflation, Russia-Ukraine War, moderating economic growth, and other macroeconomic factors
Chapter 4. Competitive Landscape
4.1. Market Share Analysis
4.1.1. Global Liquid Minerals Market Share by Company, 2023
4.1.2. Product Offerings of Leading Liquid Minerals Companies
4.2. Market Entropy
4.2.1. New Product Launches in the Industry
4.2.2. Mergers, Acquisitions, Joint ventures, and Partnerships
4.3. Key Strategies and Best Practices
Chapter 5. Global Market Projections: Best, Reference, and Low Case Scenarios
5.1. Growth Analysis- Case Scenario Definitions
5.2. Low Growth Case Scenario Forecasts
5.3. Reference Growth Case Scenario Forecasts
5.4. High Growth Case Scenario Forecasts
Chapter 6. Market Dynamics
6.1. Liquid Minerals Market Drivers
6.2. Liquid Minerals Market Challenges
6.6. Liquid Minerals Market Opportunities
6.4. Liquid Minerals Market Trends
Chapter 7. Global Liquid Minerals Market Outlook Trends
7.1. Global Liquid Minerals Revenue (USD Million) and CAGR (%) by Type (2021-2032)
7.2. Global Liquid Minerals Revenue (USD Million) and CAGR (%) by Application (2021-2032)
7.3. Global Liquid Minerals Revenue (USD Million) and CAGR (%) by Product (2021-2032)
By Type
Iron Ingredient
Calcium Ingredient
Magnesium Ingredient
Others
By Application
Dietary supplement
Animal feed supplement
Cosmetics
Others
Chapter 8. Global Liquid Minerals Regional Analysis and Outlook
8.1. Global Liquid Minerals Revenue (USD Million) By Regions (2021- 2032)
8.2. North America Liquid Minerals Revenue (USD Million) by Country (2021-2032)
8.2.1. United States Liquid Minerals Regional Analysis and Outlook
8.2.2. Canada Liquid Minerals Regional Analysis and Outlook
8.2.3. Mexico Liquid Minerals Regional Analysis and Outlook
8.3. Europe Liquid Minerals Revenue (USD Million), by Country (2021-2032)
8.3.1. Germany Liquid Minerals Regional Analysis and Outlook
8.3.2. France Liquid Minerals Regional Analysis and Outlook
8.3.3. United Kingdom Liquid Minerals Regional Analysis and Outlook
8.3.4. Spain Liquid Minerals Regional Analysis and Outlook
8.3.5. Italy Liquid Minerals Regional Analysis and Outlook
8.3.6. Russia Liquid Minerals Regional Analysis and Outlook
8.3.7. Rest of Europe Liquid Minerals Regional Analysis and Outlook
8.4. Asia Pacific Liquid Minerals Revenue (USD Million) by Country (2021-2032)
8.4.1. China Liquid Minerals Regional Analysis and Outlook
8.4.2. Japan Liquid Minerals Regional Analysis and Outlook
8.4.3. India Liquid Minerals Regional Analysis and Outlook
8.4.4. South Korea Liquid Minerals Regional Analysis and Outlook
8.4.5. Australia Liquid Minerals Regional Analysis and Outlook
8.4.6. South East Asia Liquid Minerals Regional Analysis and Outlook
8.4.7. Rest of Asia Pacific Liquid Minerals Regional Analysis and Outlook
8.5. South America Liquid Minerals Revenue (USD Million), by Country (2021-2032)
8.5.1. Brazil Liquid Minerals Regional Analysis and Outlook
8.5.2. Argentina Liquid Minerals Regional Analysis and Outlook
8.5.3. Rest of South America Liquid Minerals Regional Analysis and Outlook
8.6. Middle East and Africa Liquid Minerals Revenue (USD Million) by Country (2021-2032)
8.6.1. Middle East Liquid Minerals Regional Analysis and Outlook
8.6.2. Africa Liquid Minerals Regional Analysis and Outlook
Chapter 9. North America Liquid Minerals Analysis and Outlook
9.1. North America Liquid Minerals Revenue (USD Million) by Segments (2021-2032)
9.1.1. North America Liquid Minerals Revenue (USD Million) by Type (2021-2032)
9.1.2. North America Liquid Minerals Revenue (USD Million) by Application (2021-2032)
9.1.3. North America Liquid Minerals Revenue (USD Million) by Product (2021-2032)
By Type
Iron Ingredient
Calcium Ingredient
Magnesium Ingredient
Others
By Application
Dietary supplement
Animal feed supplement
Cosmetics
Others
Chapter 10. Europe Liquid Minerals Analysis and Outlook
10.1. Europe Liquid Minerals Revenue (USD Million), by Segments (USD Million) (2021-2032)
10.1.1. Europe Liquid Minerals Revenue (USD Million) by Type (2021-2032)
10.1.2. Europe Liquid Minerals Revenue (USD Million) by Application (2021-2032)
10.1.3. Europe Liquid Minerals Revenue (USD Million) by Product (2021-2032)
By Type
Iron Ingredient
Calcium Ingredient
Magnesium Ingredient
Others
By Application
Dietary supplement
Animal feed supplement
Cosmetics
Others
Chapter 11. Asia Pacific Liquid Minerals Analysis and Outlook
11.1. Asia Pacific Liquid Minerals Revenue (USD Million), and Revenue (USD Million) by Segments (2021-2032)
11.1.1. Asia Pacific Liquid Minerals Revenue (USD Million) by Type (2021-2032)
11.1.2. Asia Pacific Liquid Minerals Revenue (USD Million) by Application (2021-2032)
11.1.3. Asia Pacific Liquid Minerals Revenue (USD Million) by Product (2021-2032)
By Type
Iron Ingredient
Calcium Ingredient
Magnesium Ingredient
Others
By Application
Dietary supplement
Animal feed supplement
Cosmetics
Others
Chapter 12. South America Liquid Minerals Analysis and Outlook
12.1. South America Liquid Minerals Revenue (USD Million), by Segments (2021-2032)
12.1.1. South America Liquid Minerals Revenue (USD Million) by Type (2021-2032)
12.1.2. South America Liquid Minerals Revenue (USD Million) by Application (2021-2032)
12.1.3. South America Liquid Minerals Revenue (USD Million) by Product (2021-2032)
By Type
Iron Ingredient
Calcium Ingredient
Magnesium Ingredient
Others
By Application
Dietary supplement
Animal feed supplement
Cosmetics
Others
Chapter 13. Middle East and Africa Liquid Minerals Analysis and Outlook
13.1. Middle East and Africa Liquid Minerals Revenue (USD Million), by Segments (2021-2032)
13.1.1. Middle East and Africa Liquid Minerals Revenue (USD Million) by Type (2021-2032)
13.1.2. Middle East and Africa Liquid Minerals Revenue (USD Million) by Application (2021-2032)
13.1.3. Middle East and Africa Liquid Minerals Revenue (USD Million) by Product (2021-2032)
By Type
Iron Ingredient
Calcium Ingredient
Magnesium Ingredient
Others
By Application
Dietary supplement
Animal feed supplement
Cosmetics
Others
Chapter 14. Liquid Minerals Company Profiles
14.1 Business Overview
14.2 Product Profiles
14.3 SWOT Profiles
14.5 Recent Developments
14.6 Financial Profile
List of Companies
Carlson Laboratories, Inc.
Eidon Ionic Minerals
Eniva USA, Inc.
Iredale Mineral Cosmetics, Ltd.
Miracles of Health, Inc.
NOW Foods
Rexall Sundown, Inc.
15. Methodology and Data Sources
15.1 Customization Offerings
15.2 Subscription Services
15.3 Related Reports
15.4 Publisher Expertise
LIST OF TABLES
Table 1 Market Segmentation Analysis
Table 2 Global Liquid Minerals Market Share of Leading Companies, 2023
Table 3 Product Offerings of Leading Companies
Table 4 Low Growth Scenario Forecasts
Table 5 Reference Case Growth Scenario
Table 6 High Growth Case Scenario
Table 7 Global Liquid Minerals Revenue (USD Million) And CAGR (%) By Type (2021-2032)
Table 8 Global Liquid Minerals Revenue (USD Million) And CAGR (%) By Application (2021-2032)
Table 9 Global Liquid Minerals Revenue (USD Million) And CAGR (%) By Product (2021-2032)
Table 10 Global Liquid Minerals Market Revenue (USD Million) By Regions (2021-2032)
Table 11 Global Liquid Minerals Market Share (%) By Regions (2021-2032)
Table 12 North America Liquid Minerals Revenue (USD Million) By Country (2021-2032)
Table 13 Europe Liquid Minerals Revenue (USD Million) By Country (2021-2032)
Table 14 Asia Pacific Liquid Minerals Revenue (USD Million) By Country (2021-2032)
Table 15 South America Liquid Minerals Revenue (USD Million) By Country (2021-2032)
Table 16 Middle East and Africa Liquid Minerals Revenue (USD Million) By Region (2021-2032)
Table 17 North America Liquid Minerals Revenue (USD Million) By Type (2021-2032)
Table 18 North America Liquid Minerals Revenue (USD Million) By Application (2021-2032)
Table 19 North America Liquid Minerals Revenue (USD Million) By Product (2021-2032)
Table 20 Europe Liquid Minerals Revenue (USD Million) By Type (2021-2032)
Table 21 Europe Liquid Minerals Revenue (USD Million) By Application (2021-2032)
Table 22 Europe Liquid Minerals Revenue (USD Million) By Product (2021-2032)
Table 23 Asia Pacific Liquid Minerals Revenue (USD Million) By Type (2021-2032)
Table 24 Asia Pacific Liquid Minerals Revenue (USD Million) By Application (2021-2032)
Table 25 Asia Pacific Liquid Minerals Revenue (USD Million) By Product (2021-2032)
Table 26 South America Liquid Minerals Revenue (USD Million) By Type (2021-2032)
Table 27 South America Liquid Minerals Revenue (USD Million) By Application (2021-2032)
Table 28 South America Liquid Minerals Revenue (USD Million) By Product (2021-2032)
Table 29 Middle East and Africa Liquid Minerals Revenue (USD Million) By Type (2021-2032)
Table 30 Middle East and Africa Liquid Minerals Revenue (USD Million) By Application (2021-2032)
Table 31 Middle East and Africa Liquid Minerals Revenue (USD Million) By Product (2021-2032)
LIST OF FIGURES
Figure 1. Market Scope
Figure 2. Pricing Forecasts Per Unit, 2023- 2032
Figure 3. Porter’s Five Forces
Figure 4. Global Liquid Minerals Market Revenue (USD Million) By Regions (2021-2032)
Figure 5. Global Liquid Minerals Market Share (%) By Regions (2023)
Figure 6. North America Liquid Minerals Revenue (USD Million) By Country (2021-2032)
Figure 7. United States Liquid Minerals Revenue (USD Million) By Country (2021-2032)
Figure 8. Canada Liquid Minerals Revenue (USD Million) By Country (2021-2032)
Figure 9. Mexico Liquid Minerals Revenue (USD Million) By Country (2021-2032)
Figure 10. Europe Liquid Minerals Revenue (USD Million) By Country (2021-2032)
Figure 11. Germany Liquid Minerals Revenue (USD Million) By Country (2021-2032)
Figure 12. France Liquid Minerals Revenue (USD Million) By Country (2021-2032)
Figure 13. United Kingdom Liquid Minerals Revenue (USD Million) By Country (2021-2032)
Figure 14. Spain Liquid Minerals Revenue (USD Million) By Country (2021-2032)
Figure 15. Italy Liquid Minerals Revenue (USD Million) By Country (2021-2032)
Figure 16. Russia Liquid Minerals Revenue (USD Million) By Country (2021-2032)
Figure 17. Rest of Europe Liquid Minerals Revenue (USD Million) By Country (2021-2032)
Figure 11. Asia Pacific Liquid Minerals Revenue (USD Million) By Country (2021-2032)
Figure 12. China Liquid Minerals Revenue (USD Million) By Country (2021-2032)
Figure 13. Japan Liquid Minerals Revenue (USD Million) By Country (2021-2032)
Figure 14. India Liquid Minerals Revenue (USD Million) By Country (2021-2032)
Figure 15. South Korea Liquid Minerals Revenue (USD Million) By Country (2021-2032)
Figure 16. Australia Liquid Minerals Revenue (USD Million) By Country (2021-2032)
Figure 17. South East Asia Liquid Minerals Revenue (USD Million) By Country (2021-2032)
Figure 18. South America Liquid Minerals Revenue (USD Million) By Country (2021-2032)
Figure 19. Brazil Liquid Minerals Revenue (USD Million) By Country (2021-2032)
Figure 20. Argentina Liquid Minerals Revenue (USD Million) By Country (2021-2032)
Figure 21. Rest of Asia Pacific Liquid Minerals Revenue (USD Million) By Country (2021-2032)
Figure 22. Middle East and Africa Liquid Minerals Revenue (USD Million) By Region (2021-2032)
Figure 23. Saudi Arabia Liquid Minerals Revenue (USD Million) By Region (2021-2032)
Figure 24. The UAE Liquid Minerals Revenue (USD Million) By Region (2021-2032)
Figure 25. Rest of Middle East Liquid Minerals Revenue (USD Million) By Region (2021-2032)
Figure 26. South Africa Liquid Minerals Revenue (USD Million) By Region (2021-2032)
Figure 27. Africa Liquid Minerals Revenue (USD Million) By Region (2021-2032)
Figure 28. North America Liquid Minerals Revenue (USD Million) By Type (2021-2032)
Figure 29. North America Liquid Minerals Revenue (USD Million) By Application (2021-2032)
Figure 30. North America Liquid Minerals Revenue (USD Million) By Product (2021-2032)
Figure 31. Europe Liquid Minerals Revenue (USD Million) By Type (2021-2032)
Figure 32. Europe Liquid Minerals Revenue (USD Million) By Application (2021-2032)
Figure 33. Europe Liquid Minerals Revenue (USD Million) By Product (2021-2032)
Figure 34. Asia Pacific Liquid Minerals Revenue (USD Million) By Type (2021-2032)
Figure 35. Asia Pacific Liquid Minerals Revenue (USD Million) By Application (2021-2032)
Figure 36. Asia Pacific Liquid Minerals Revenue (USD Million) By Product (2021-2032)
Figure 37. South America Liquid Minerals Revenue (USD Million) By Type (2021-2032)
Figure 38. South America Liquid Minerals Revenue (USD Million) By Application (2021-2032)
Figure 39. South America Liquid Minerals Revenue (USD Million) By Product (2021-2032)
Figure 40. Middle East and Africa Liquid Minerals Revenue (USD Million) By Type (2021-2032)
Figure 41. Middle East and Africa Liquid Minerals Revenue (USD Million) By Application (2021-2032)
Figure 42. Middle East and Africa Liquid Minerals Revenue (USD Million) By Product (2021-2032)
By Type
Iron Ingredient
Calcium Ingredient
Magnesium Ingredient
Others
By Application
Dietary supplement
Animal feed supplement
Cosmetics
Others
Countries Analyzed
North America (US, Canada, Mexico)
Europe (Germany, UK, France, Spain, Italy, Russia, Rest of Europe)
Asia Pacific (China, India, Japan, South Korea, Australia, South East Asia, Rest of Asia)
South America (Brazil, Argentina, Rest of South America)
Middle East and Africa (Saudi Arabia, UAE, Rest of Middle East, South Africa, Egypt, Rest of Africa)
