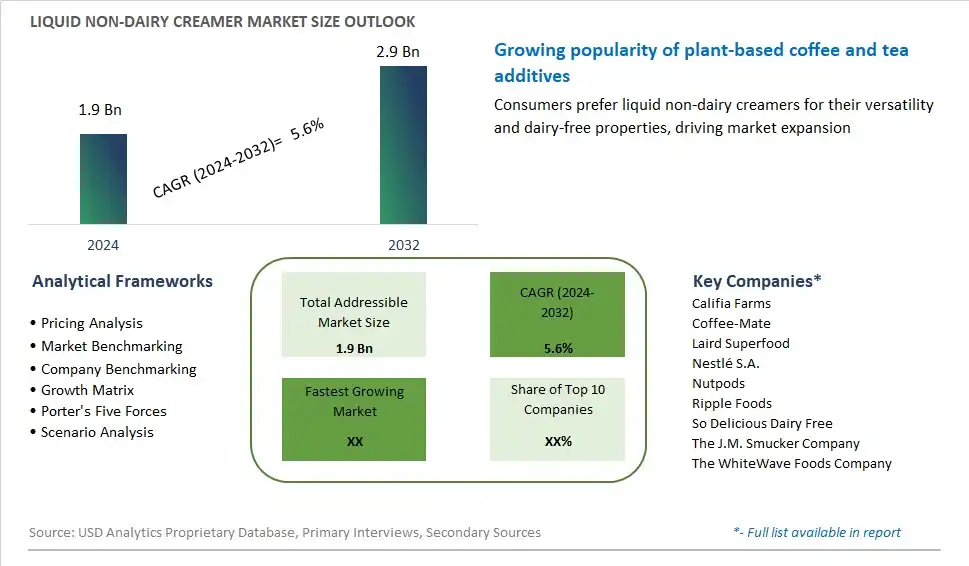
Global Liquid Non-dairy Creamer Market Size is valued at $1.9 Billion in 2024 and is forecast to register a growth rate (CAGR) of 5.6% to reach $2.9 Billion by 2032.
The global Liquid Non-dairy Creamer Market Comprehensive Study analyzes and forecasts the market size across 6 regions and 24 countries for diverse segments -By Source (Soy-based, Almond-based, Coconut-based), By Packaging (Bottles, Cartons, Pouches), By End-User (Food and Beverage, Foodservice)
An Introduction to Liquid Non-dairy Creamer Market
In 2024, the liquid non-dairy creamer market is thriving, driven by the increasing demand for plant-based and lactose-free alternatives in the food and beverage industry. Liquid non-dairy creamers, made from ingredients such as almond, soy, oat, and coconut, provide a creamy texture and flavor to coffee, tea, and other beverages without the use of dairy. The market benefits from the growing trend towards vegan and lactose-free diets, as well as the rising prevalence of lactose intolerance. Innovations in formulation and processing have improved the taste, consistency, and nutritional profile of non-dairy creamers, making them more appealing to consumers. Additionally, the trend towards clean-label and natural products supports the adoption of liquid non-dairy creamers. As consumers continue to seek plant-based and healthful alternatives, the demand for liquid non-dairy creamers is set to expand significantly.
Liquid Non dairy Creamer Competitive Landscape
The market report analyses the leading companies in the industry including Califia Farms, Coffee-Mate, Laird Superfood, Nestlé S.A., Nutpods, Ripple Foods, So Delicious Dairy Free, The J.M. Smucker Company, The WhiteWave Foods Company, and Others.
Liquid Non dairy Creamer Market Dynamics
Market Trend: Rise of Plant-Based Creamers
The most prominent trend in the Liquid Non-Dairy Creamer Market is the rise of plant-based creamers. As more consumers adopt plant-based diets and seek dairy alternatives, there is a growing demand for non-dairy creamers made from ingredients like almond, soy, coconut, and oat. This trend is driven by health, environmental, and ethical considerations. Plant-based creamers offer a versatile and convenient option for consumers looking to avoid dairy, and their popularity is contributing to the rapid growth of the liquid non-dairy creamer market.
Market Driver: Increasing Prevalence of Lactose Intolerance
The increasing prevalence of lactose intolerance is a major driver of the Liquid Non-Dairy Creamer Market. A significant portion of the population experiences difficulty digesting lactose, leading to a growing demand for lactose-free alternatives. Liquid non-dairy creamers provide a convenient solution for individuals with lactose intolerance, allowing them to enjoy coffee, tea, and other beverages without discomfort. The rising awareness of lactose intolerance and the availability of non-dairy options are driving market growth
Market Opportunity: Innovation in Flavors and Formulations
A significant opportunity in the Liquid Non-Dairy Creamer Market lies in innovation in flavors and formulations. As consumer preferences evolve, there is potential for companies to develop unique and appealing non-dairy creamer products. This includes experimenting with new flavors, such as seasonal and exotic varieties, as well as enhancing the nutritional profile by adding vitamins, minerals, and functional ingredients. By offering a diverse range of innovative non-dairy creamers, companies can attract a wider audience and differentiate their products in the competitive market
Liquid Non-Dairy Creamer Market Share Analysis: Source (Soy-based, Almond-based, Coconut-based)
The almond-based segment is anticipated to be the fastest-growing in the Liquid Non-Dairy Creamer Market by source to 2032. Almond-based creamers are increasingly popular among consumers seeking plant-based, dairy-free alternatives for their beverages. The demand for almond-based creamers is driven by their mild flavor, creamy texture, and perceived health benefits, including being low in calories and rich in vitamins and minerals. Additionally, the growing trend of plant-based diets and the rising awareness of lactose intolerance and dairy allergies contribute to the segment's rapid growth. The expansion of product offerings, including flavored and fortified almond-based creamers, further supports the growth of this segment.
Liquid Non-Dairy Creamer Market Share Analysis: Packaging (Bottles, Cartons, Pouches)
The cartons segment is expected to be the fastest-growing in the Liquid Non-Dairy Creamer Market by packaging to 2032. Cartons offer several advantages, including convenience, extended shelf life, and ease of storage, making them a preferred choice for consumers and retailers. The demand for cartons is driven by the increasing focus on environmentally friendly and recyclable packaging solutions. Additionally, cartons provide better protection for non-dairy creamers, preserving their nutritional value and taste. The expanding availability of liquid non-dairy creamers in carton packaging in various retail channels, including supermarkets, convenience stores, and online platforms, further supports the segment's rapid growth.
Liquid Non-Dairy Creamer Market Share Analysis: End-User (Food and Beverage, Foodservice)
The foodservice segment is projected to be the fastest-growing in the Liquid Non-Dairy Creamer Market by end-user to 2032. The demand for liquid non-dairy creamers in the foodservice industry is driven by the increasing number of cafes, restaurants, and other foodservice establishments offering plant-based and dairy-free options. Consumers are increasingly seeking non-dairy alternatives for their coffee, tea, and other beverages when dining out. Additionally, the rise of specialty coffee shops and the growing trend of plant-based diets contribute to the segment's rapid growth. The expansion of the foodservice industry and the increasing availability of liquid non-dairy creamers in bulk packaging support the growth of the foodservice segment.
Liquid Non dairy Creamer Market Segmentation
By Source
Soy-based
Almond-based
Coconut-based
By Packaging
Bottles
Cartons
Pouches
By End-User
Food and Beverage
Foodservice
Countries Analyzed
North America (US, Canada, Mexico)
Europe (Germany, UK, France, Spain, Italy, Russia, Rest of Europe)
Asia Pacific (China, India, Japan, South Korea, Australia, South East Asia, Rest of Asia)
South America (Brazil, Argentina, Rest of South America)
Middle East and Africa (Saudi Arabia, UAE, Rest of Middle East, South Africa, Egypt, Rest of Africa)
Liquid Non dairy Creamer Companies Profiled in the Study
Califia Farms
Coffee-Mate
Laird Superfood
Nestlé S.A.
Nutpods
Ripple Foods
So Delicious Dairy Free
The J.M. Smucker Company
The WhiteWave Foods Company
*- List Not Exhaustive
Chapter 1. TABLE OF CONTENTS
Chapter 2. Introduction to Liquid Non dairy Creamer Market
2.1. Market Overview
2.2. Key Statistics and Report Highlights
2.3. Scope of the Comprehensive Study
2.3.1. Market Definition
2.3.2 Countries and Regions Covered
2.3.3 Research Objective
2.3.4 Units, Currency, and Conversions
2.3.5 Industry Value Chain
2.4. Key Market Segments
2.5. Key Companies
2.6. Study Period
Chapter 3. Strategic Analysis Review
3.1. Liquid Non dairy Creamer Pricing Analysis and Forecast
3.2. Porter’s Five Forces
3.3. Market Ecosystem
3.4. SWOT Analysis
3.5. Regulatory Scenario
3.3. Effects of Inflation, Russia-Ukraine War, moderating economic growth, and other macroeconomic factors
Chapter 4. Competitive Landscape
4.1. Market Share Analysis
4.1.1. Global Liquid Non dairy Creamer Market Share by Company, 2023
4.1.2. Product Offerings of Leading Liquid Non dairy Creamer Companies
4.2. Market Entropy
4.2.1. New Product Launches in the Industry
4.2.2. Mergers, Acquisitions, Joint ventures, and Partnerships
4.3. Key Strategies and Best Practices
Chapter 5. Global Market Projections: Best, Reference, and Low Case Scenarios
5.1. Growth Analysis- Case Scenario Definitions
5.2. Low Growth Case Scenario Forecasts
5.3. Reference Growth Case Scenario Forecasts
5.4. High Growth Case Scenario Forecasts
Chapter 6. Market Dynamics
6.1. Liquid Non dairy Creamer Market Drivers
6.2. Liquid Non dairy Creamer Market Challenges
6.6. Liquid Non dairy Creamer Market Opportunities
6.4. Liquid Non dairy Creamer Market Trends
Chapter 7. Global Liquid Non dairy Creamer Market Outlook Trends
7.1. Global Liquid Non dairy Creamer Revenue (USD Million) and CAGR (%) by Type (2021-2032)
7.2. Global Liquid Non dairy Creamer Revenue (USD Million) and CAGR (%) by Application (2021-2032)
7.3. Global Liquid Non dairy Creamer Revenue (USD Million) and CAGR (%) by Product (2021-2032)
By Source
Soy-based
Almond-based
Coconut-based
By Packaging
Bottles
Cartons
Pouches
By End-User
Food and Beverage
Foodservice
Chapter 8. Global Liquid Non dairy Creamer Regional Analysis and Outlook
8.1. Global Liquid Non dairy Creamer Revenue (USD Million) By Regions (2021- 2032)
8.2. North America Liquid Non dairy Creamer Revenue (USD Million) by Country (2021-2032)
8.2.1. United States Liquid Non dairy Creamer Regional Analysis and Outlook
8.2.2. Canada Liquid Non dairy Creamer Regional Analysis and Outlook
8.2.3. Mexico Liquid Non dairy Creamer Regional Analysis and Outlook
8.3. Europe Liquid Non dairy Creamer Revenue (USD Million), by Country (2021-2032)
8.3.1. Germany Liquid Non dairy Creamer Regional Analysis and Outlook
8.3.2. France Liquid Non dairy Creamer Regional Analysis and Outlook
8.3.3. United Kingdom Liquid Non dairy Creamer Regional Analysis and Outlook
8.3.4. Spain Liquid Non dairy Creamer Regional Analysis and Outlook
8.3.5. Italy Liquid Non dairy Creamer Regional Analysis and Outlook
8.3.6. Russia Liquid Non dairy Creamer Regional Analysis and Outlook
8.3.7. Rest of Europe Liquid Non dairy Creamer Regional Analysis and Outlook
8.4. Asia Pacific Liquid Non dairy Creamer Revenue (USD Million) by Country (2021-2032)
8.4.1. China Liquid Non dairy Creamer Regional Analysis and Outlook
8.4.2. Japan Liquid Non dairy Creamer Regional Analysis and Outlook
8.4.3. India Liquid Non dairy Creamer Regional Analysis and Outlook
8.4.4. South Korea Liquid Non dairy Creamer Regional Analysis and Outlook
8.4.5. Australia Liquid Non dairy Creamer Regional Analysis and Outlook
8.4.6. South East Asia Liquid Non dairy Creamer Regional Analysis and Outlook
8.4.7. Rest of Asia Pacific Liquid Non dairy Creamer Regional Analysis and Outlook
8.5. South America Liquid Non dairy Creamer Revenue (USD Million), by Country (2021-2032)
8.5.1. Brazil Liquid Non dairy Creamer Regional Analysis and Outlook
8.5.2. Argentina Liquid Non dairy Creamer Regional Analysis and Outlook
8.5.3. Rest of South America Liquid Non dairy Creamer Regional Analysis and Outlook
8.6. Middle East and Africa Liquid Non dairy Creamer Revenue (USD Million) by Country (2021-2032)
8.6.1. Middle East Liquid Non dairy Creamer Regional Analysis and Outlook
8.6.2. Africa Liquid Non dairy Creamer Regional Analysis and Outlook
Chapter 9. North America Liquid Non dairy Creamer Analysis and Outlook
9.1. North America Liquid Non dairy Creamer Revenue (USD Million) by Segments (2021-2032)
9.1.1. North America Liquid Non dairy Creamer Revenue (USD Million) by Type (2021-2032)
9.1.2. North America Liquid Non dairy Creamer Revenue (USD Million) by Application (2021-2032)
9.1.3. North America Liquid Non dairy Creamer Revenue (USD Million) by Product (2021-2032)
By Source
Soy-based
Almond-based
Coconut-based
By Packaging
Bottles
Cartons
Pouches
By End-User
Food and Beverage
Foodservice
Chapter 10. Europe Liquid Non dairy Creamer Analysis and Outlook
10.1. Europe Liquid Non dairy Creamer Revenue (USD Million), by Segments (USD Million) (2021-2032)
10.1.1. Europe Liquid Non dairy Creamer Revenue (USD Million) by Type (2021-2032)
10.1.2. Europe Liquid Non dairy Creamer Revenue (USD Million) by Application (2021-2032)
10.1.3. Europe Liquid Non dairy Creamer Revenue (USD Million) by Product (2021-2032)
By Source
Soy-based
Almond-based
Coconut-based
By Packaging
Bottles
Cartons
Pouches
By End-User
Food and Beverage
Foodservice
Chapter 11. Asia Pacific Liquid Non dairy Creamer Analysis and Outlook
11.1. Asia Pacific Liquid Non dairy Creamer Revenue (USD Million), and Revenue (USD Million) by Segments (2021-2032)
11.1.1. Asia Pacific Liquid Non dairy Creamer Revenue (USD Million) by Type (2021-2032)
11.1.2. Asia Pacific Liquid Non dairy Creamer Revenue (USD Million) by Application (2021-2032)
11.1.3. Asia Pacific Liquid Non dairy Creamer Revenue (USD Million) by Product (2021-2032)
By Source
Soy-based
Almond-based
Coconut-based
By Packaging
Bottles
Cartons
Pouches
By End-User
Food and Beverage
Foodservice
Chapter 12. South America Liquid Non dairy Creamer Analysis and Outlook
12.1. South America Liquid Non dairy Creamer Revenue (USD Million), by Segments (2021-2032)
12.1.1. South America Liquid Non dairy Creamer Revenue (USD Million) by Type (2021-2032)
12.1.2. South America Liquid Non dairy Creamer Revenue (USD Million) by Application (2021-2032)
12.1.3. South America Liquid Non dairy Creamer Revenue (USD Million) by Product (2021-2032)
By Source
Soy-based
Almond-based
Coconut-based
By Packaging
Bottles
Cartons
Pouches
By End-User
Food and Beverage
Foodservice
Chapter 13. Middle East and Africa Liquid Non dairy Creamer Analysis and Outlook
13.1. Middle East and Africa Liquid Non dairy Creamer Revenue (USD Million), by Segments (2021-2032)
13.1.1. Middle East and Africa Liquid Non dairy Creamer Revenue (USD Million) by Type (2021-2032)
13.1.2. Middle East and Africa Liquid Non dairy Creamer Revenue (USD Million) by Application (2021-2032)
13.1.3. Middle East and Africa Liquid Non dairy Creamer Revenue (USD Million) by Product (2021-2032)
By Source
Soy-based
Almond-based
Coconut-based
By Packaging
Bottles
Cartons
Pouches
By End-User
Food and Beverage
Foodservice
Chapter 14. Liquid Non dairy Creamer Company Profiles
14.1 Business Overview
14.2 Product Profiles
14.3 SWOT Profiles
14.5 Recent Developments
14.6 Financial Profile
List of Companies
Califia Farms
Coffee-Mate
Laird Superfood
Nestlé S.A.
Nutpods
Ripple Foods
So Delicious Dairy Free
The J.M. Smucker Company
The WhiteWave Foods Company
15. Methodology and Data Sources
15.1 Customization Offerings
15.2 Subscription Services
15.3 Related Reports
15.4 Publisher Expertise
LIST OF TABLES
Table 1 Market Segmentation Analysis
Table 2 Global Liquid Non dairy Creamer Market Share of Leading Companies, 2023
Table 3 Product Offerings of Leading Companies
Table 4 Low Growth Scenario Forecasts
Table 5 Reference Case Growth Scenario
Table 6 High Growth Case Scenario
Table 7 Global Liquid Non dairy Creamer Revenue (USD Million) And CAGR (%) By Type (2021-2032)
Table 8 Global Liquid Non dairy Creamer Revenue (USD Million) And CAGR (%) By Application (2021-2032)
Table 9 Global Liquid Non dairy Creamer Revenue (USD Million) And CAGR (%) By Product (2021-2032)
Table 10 Global Liquid Non dairy Creamer Market Revenue (USD Million) By Regions (2021-2032)
Table 11 Global Liquid Non dairy Creamer Market Share (%) By Regions (2021-2032)
Table 12 North America Liquid Non dairy Creamer Revenue (USD Million) By Country (2021-2032)
Table 13 Europe Liquid Non dairy Creamer Revenue (USD Million) By Country (2021-2032)
Table 14 Asia Pacific Liquid Non dairy Creamer Revenue (USD Million) By Country (2021-2032)
Table 15 South America Liquid Non dairy Creamer Revenue (USD Million) By Country (2021-2032)
Table 16 Middle East and Africa Liquid Non dairy Creamer Revenue (USD Million) By Region (2021-2032)
Table 17 North America Liquid Non dairy Creamer Revenue (USD Million) By Type (2021-2032)
Table 18 North America Liquid Non dairy Creamer Revenue (USD Million) By Application (2021-2032)
Table 19 North America Liquid Non dairy Creamer Revenue (USD Million) By Product (2021-2032)
Table 20 Europe Liquid Non dairy Creamer Revenue (USD Million) By Type (2021-2032)
Table 21 Europe Liquid Non dairy Creamer Revenue (USD Million) By Application (2021-2032)
Table 22 Europe Liquid Non dairy Creamer Revenue (USD Million) By Product (2021-2032)
Table 23 Asia Pacific Liquid Non dairy Creamer Revenue (USD Million) By Type (2021-2032)
Table 24 Asia Pacific Liquid Non dairy Creamer Revenue (USD Million) By Application (2021-2032)
Table 25 Asia Pacific Liquid Non dairy Creamer Revenue (USD Million) By Product (2021-2032)
Table 26 South America Liquid Non dairy Creamer Revenue (USD Million) By Type (2021-2032)
Table 27 South America Liquid Non dairy Creamer Revenue (USD Million) By Application (2021-2032)
Table 28 South America Liquid Non dairy Creamer Revenue (USD Million) By Product (2021-2032)
Table 29 Middle East and Africa Liquid Non dairy Creamer Revenue (USD Million) By Type (2021-2032)
Table 30 Middle East and Africa Liquid Non dairy Creamer Revenue (USD Million) By Application (2021-2032)
Table 31 Middle East and Africa Liquid Non dairy Creamer Revenue (USD Million) By Product (2021-2032)
LIST OF FIGURES
Figure 1. Market Scope
Figure 2. Pricing Forecasts Per Unit, 2023- 2032
Figure 3. Porter’s Five Forces
Figure 4. Global Liquid Non dairy Creamer Market Revenue (USD Million) By Regions (2021-2032)
Figure 5. Global Liquid Non dairy Creamer Market Share (%) By Regions (2023)
Figure 6. North America Liquid Non dairy Creamer Revenue (USD Million) By Country (2021-2032)
Figure 7. United States Liquid Non dairy Creamer Revenue (USD Million) By Country (2021-2032)
Figure 8. Canada Liquid Non dairy Creamer Revenue (USD Million) By Country (2021-2032)
Figure 9. Mexico Liquid Non dairy Creamer Revenue (USD Million) By Country (2021-2032)
Figure 10. Europe Liquid Non dairy Creamer Revenue (USD Million) By Country (2021-2032)
Figure 11. Germany Liquid Non dairy Creamer Revenue (USD Million) By Country (2021-2032)
Figure 12. France Liquid Non dairy Creamer Revenue (USD Million) By Country (2021-2032)
Figure 13. United Kingdom Liquid Non dairy Creamer Revenue (USD Million) By Country (2021-2032)
Figure 14. Spain Liquid Non dairy Creamer Revenue (USD Million) By Country (2021-2032)
Figure 15. Italy Liquid Non dairy Creamer Revenue (USD Million) By Country (2021-2032)
Figure 16. Russia Liquid Non dairy Creamer Revenue (USD Million) By Country (2021-2032)
Figure 17. Rest of Europe Liquid Non dairy Creamer Revenue (USD Million) By Country (2021-2032)
Figure 11. Asia Pacific Liquid Non dairy Creamer Revenue (USD Million) By Country (2021-2032)
Figure 12. China Liquid Non dairy Creamer Revenue (USD Million) By Country (2021-2032)
Figure 13. Japan Liquid Non dairy Creamer Revenue (USD Million) By Country (2021-2032)
Figure 14. India Liquid Non dairy Creamer Revenue (USD Million) By Country (2021-2032)
Figure 15. South Korea Liquid Non dairy Creamer Revenue (USD Million) By Country (2021-2032)
Figure 16. Australia Liquid Non dairy Creamer Revenue (USD Million) By Country (2021-2032)
Figure 17. South East Asia Liquid Non dairy Creamer Revenue (USD Million) By Country (2021-2032)
Figure 18. South America Liquid Non dairy Creamer Revenue (USD Million) By Country (2021-2032)
Figure 19. Brazil Liquid Non dairy Creamer Revenue (USD Million) By Country (2021-2032)
Figure 20. Argentina Liquid Non dairy Creamer Revenue (USD Million) By Country (2021-2032)
Figure 21. Rest of Asia Pacific Liquid Non dairy Creamer Revenue (USD Million) By Country (2021-2032)
Figure 22. Middle East and Africa Liquid Non dairy Creamer Revenue (USD Million) By Region (2021-2032)
Figure 23. Saudi Arabia Liquid Non dairy Creamer Revenue (USD Million) By Region (2021-2032)
Figure 24. The UAE Liquid Non dairy Creamer Revenue (USD Million) By Region (2021-2032)
Figure 25. Rest of Middle East Liquid Non dairy Creamer Revenue (USD Million) By Region (2021-2032)
Figure 26. South Africa Liquid Non dairy Creamer Revenue (USD Million) By Region (2021-2032)
Figure 27. Africa Liquid Non dairy Creamer Revenue (USD Million) By Region (2021-2032)
Figure 28. North America Liquid Non dairy Creamer Revenue (USD Million) By Type (2021-2032)
Figure 29. North America Liquid Non dairy Creamer Revenue (USD Million) By Application (2021-2032)
Figure 30. North America Liquid Non dairy Creamer Revenue (USD Million) By Product (2021-2032)
Figure 31. Europe Liquid Non dairy Creamer Revenue (USD Million) By Type (2021-2032)
Figure 32. Europe Liquid Non dairy Creamer Revenue (USD Million) By Application (2021-2032)
Figure 33. Europe Liquid Non dairy Creamer Revenue (USD Million) By Product (2021-2032)
Figure 34. Asia Pacific Liquid Non dairy Creamer Revenue (USD Million) By Type (2021-2032)
Figure 35. Asia Pacific Liquid Non dairy Creamer Revenue (USD Million) By Application (2021-2032)
Figure 36. Asia Pacific Liquid Non dairy Creamer Revenue (USD Million) By Product (2021-2032)
Figure 37. South America Liquid Non dairy Creamer Revenue (USD Million) By Type (2021-2032)
Figure 38. South America Liquid Non dairy Creamer Revenue (USD Million) By Application (2021-2032)
Figure 39. South America Liquid Non dairy Creamer Revenue (USD Million) By Product (2021-2032)
Figure 40. Middle East and Africa Liquid Non dairy Creamer Revenue (USD Million) By Type (2021-2032)
Figure 41. Middle East and Africa Liquid Non dairy Creamer Revenue (USD Million) By Application (2021-2032)
Figure 42. Middle East and Africa Liquid Non dairy Creamer Revenue (USD Million) By Product (2021-2032)
By Source
Soy-based
Almond-based
Coconut-based
By Packaging
Bottles
Cartons
Pouches
By End-User
Food and Beverage
Foodservice
Countries Analyzed
North America (US, Canada, Mexico)
Europe (Germany, UK, France, Spain, Italy, Russia, Rest of Europe)
Asia Pacific (China, India, Japan, South Korea, Australia, South East Asia, Rest of Asia)
South America (Brazil, Argentina, Rest of South America)
Middle East and Africa (Saudi Arabia, UAE, Rest of Middle East, South Africa, Egypt, Rest of Africa)
