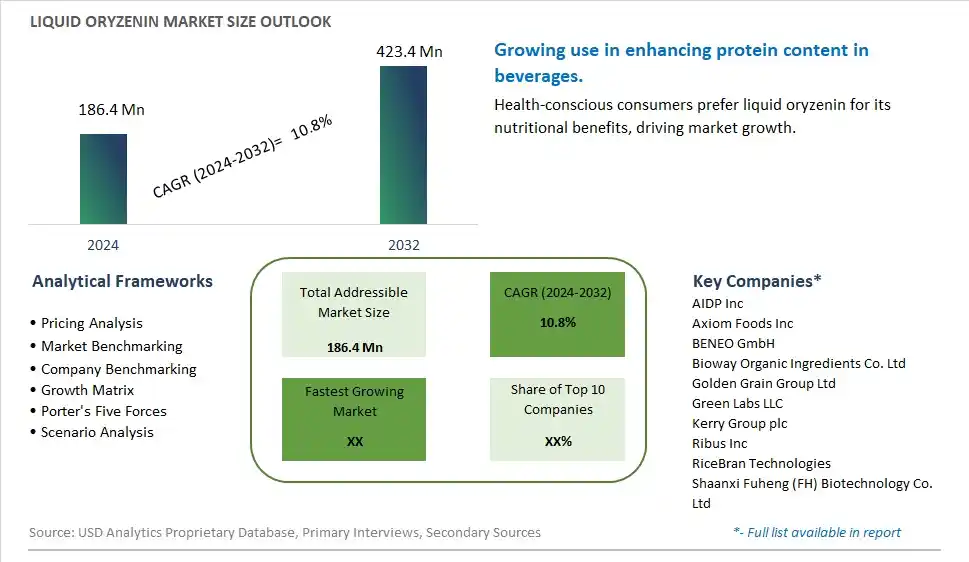
Global Liquid Oryzenin Market Size is valued at $186.4 Million in 2024 and is forecast to register a growth rate (CAGR) of 10.8% to reach $423.4 Million by 2032.
The global Liquid Oryzenin Market Comprehensive Study analyzes and forecasts the market size across 6 regions and 24 countries for diverse segments -By Type (Isolates, Concentrates, Others), By Application (Sports & energy nutrition, Beverages, Dairy alternatives, Bakery & confectionery, Meat analogs & extenders, Others)
An Introduction to Liquid Oryzenin Market
The liquid oryzenin market in 2024 is expanding, driven by the increasing demand for plant-based protein ingredients in the food and beverage industry. Liquid oryzenin, derived from rice, is valued for its high protein content, hypoallergenic properties, and use in protein supplements, functional foods, and beverages. The market benefits from innovations in protein extraction and formulation technologies that enhance the quality and functionality of oryzenin products. The trend towards plant-based diets and clean label ingredients is influencing market dynamics. Increasing consumer interest in sustainable and natural protein sources is further propelling demand for liquid oryzenin.
Liquid Oryzenin Competitive Landscape
The market report analyses the leading companies in the industry including AIDP Inc, Axiom Foods Inc, BENEO GmbH, Bioway Organic Ingredients Co. Ltd, Golden Grain Group Ltd, Green Labs LLC, Kerry Group plc, Ribus Inc, RiceBran Technologies, Shaanxi Fuheng (FH) Biotechnology Co. Ltd, and Others.
Liquid Oryzenin Market Dynamics
Liquid Oryzenin Market Trend: Growing Popularity of Plant-Based Proteins
The most prominent trend in the Liquid Oryzenin Market is the growing popularity of plant-based proteins. Liquid oryzenin, a rice protein, is increasingly used in food and beverage products as a high-quality plant-based protein source. This trend is driven by the rising demand for sustainable and nutritious protein alternatives.
Liquid Oryzenin Market Driver: Health and Environmental Benefits
A key driver in the Liquid Oryzenin Market is the health and environmental benefits of plant-based proteins. Consumers are becoming more aware of the health advantages of plant-based diets, such as improved heart health and reduced risk of chronic diseases. Additionally, the environmental impact of plant-based proteins is lower compared to animal-based proteins, making oryzenin an attractive choice for eco-conscious consumers.
Liquid Oryzenin Market Opportunity: Expansion into Functional Food and Beverage Products
One significant opportunity in the Liquid Oryzenin Market lies in the expansion into functional food and beverage products. Companies can develop new oryzenin-based products, such as protein shakes, energy bars, and meal replacements, that cater to health-conscious consumers. By highlighting the nutritional benefits and versatility of oryzenin, manufacturers can attract a broader audience and drive market growth.
Liquid Oryzenin Market Share Analysis: Isolates segment generated the highest revenue share in the industry
Within the Liquid Oryzenin Market, Isolates stand out as the largest segment. Oryzenin, derived from rice, is a plant-based protein known for its hypoallergenic properties and nutritional benefits. Isolates are highly purified forms of oryzenin protein, containing a higher concentration of protein per unit compared to concentrates or other forms. They are widely used in the food and beverage industry, particularly in the formulation of protein shakes, nutritional supplements, and plant-based meat alternatives. The growing consumer preference for vegan and vegetarian diets has significantly boosted the demand for plant-based proteins like oryzenin isolates. Further, technological advancements in protein extraction and purification processes have improved the quality and functionality of oryzenin isolates, making them suitable for a broader range of applications. As the market continues to expand, driven by increasing health consciousness and dietary trends favoring plant-based proteins, the Isolates segment of the Liquid Oryzenin Market is expected to maintain its leadership position and grow steadily in the coming years.
Liquid Oryzenin Market Share Analysis: Sports & Energy Nutrition is the fastest growing segment over the forecast period to 2032
In the Liquid Oryzenin Market, the Sports & Energy Nutrition segment is experiencing rapid growth and prominence. Oryzenin, derived from rice, is a valuable source of plant-based protein that meets the increasing demand for vegan and allergen-free protein sources in sports and energy nutrition products. The segment's growth is driven by rising awareness among athletes and fitness enthusiasts about the benefits of plant-based diets for muscle recovery, endurance, and overall health. Oryzenin's high digestibility, amino acid profile, and ability to support muscle protein synthesis make it ideal for inclusion in protein shakes, bars, and supplements targeted at athletes and active individuals. Additionally, innovations in food technology have enhanced the solubility and sensory properties of oryzenin, making it more versatile for use in various sports nutrition formulations. As the global sports nutrition market continues to expand, fueled by trends towards healthier lifestyles and performance enhancement, the Sports & Energy Nutrition segment of the Liquid Oryzenin Market is poised to see robust growth up to 2032.
Liquid Oryzenin Market Segmentation
By Type
Isolates
Concentrates
Others
By Application
Sports & energy nutrition
Beverages
Dairy alternatives
Bakery & confectionery
Meat analogs & extenders
Others
Countries Analyzed
North America (US, Canada, Mexico)
Europe (Germany, UK, France, Spain, Italy, Russia, Rest of Europe)
Asia Pacific (China, India, Japan, South Korea, Australia, South East Asia, Rest of Asia)
South America (Brazil, Argentina, Rest of South America)
Middle East and Africa (Saudi Arabia, UAE, Rest of Middle East, South Africa, Egypt, Rest of Africa)
Liquid Oryzenin Companies Profiled in the Study
AIDP Inc
Axiom Foods Inc
BENEO GmbH
Bioway Organic Ingredients Co. Ltd
Golden Grain Group Ltd
Green Labs LLC
Kerry Group plc
Ribus Inc
RiceBran Technologies
Shaanxi Fuheng (FH) Biotechnology Co. Ltd
*- List Not Exhaustive
Chapter 1. TABLE OF CONTENTS
Chapter 2. Introduction to Liquid Oryzenin Market
2.1. Market Overview
2.2. Key Statistics and Report Highlights
2.3. Scope of the Comprehensive Study
2.3.1. Market Definition
2.3.2 Countries and Regions Covered
2.3.3 Research Objective
2.3.4 Units, Currency, and Conversions
2.3.5 Industry Value Chain
2.4. Key Market Segments
2.5. Key Companies
2.6. Study Period
Chapter 3. Strategic Analysis Review
3.1. Liquid Oryzenin Pricing Analysis and Forecast
3.2. Porter’s Five Forces
3.3. Market Ecosystem
3.4. SWOT Analysis
3.5. Regulatory Scenario
3.3. Effects of Inflation, Russia-Ukraine War, moderating economic growth, and other macroeconomic factors
Chapter 4. Competitive Landscape
4.1. Market Share Analysis
4.1.1. Global Liquid Oryzenin Market Share by Company, 2023
4.1.2. Product Offerings of Leading Liquid Oryzenin Companies
4.2. Market Entropy
4.2.1. New Product Launches in the Industry
4.2.2. Mergers, Acquisitions, Joint ventures, and Partnerships
4.3. Key Strategies and Best Practices
Chapter 5. Global Market Projections: Best, Reference, and Low Case Scenarios
5.1. Growth Analysis- Case Scenario Definitions
5.2. Low Growth Case Scenario Forecasts
5.3. Reference Growth Case Scenario Forecasts
5.4. High Growth Case Scenario Forecasts
Chapter 6. Market Dynamics
6.1. Liquid Oryzenin Market Drivers
6.2. Liquid Oryzenin Market Challenges
6.6. Liquid Oryzenin Market Opportunities
6.4. Liquid Oryzenin Market Trends
Chapter 7. Global Liquid Oryzenin Market Outlook Trends
7.1. Global Liquid Oryzenin Revenue (USD Million) and CAGR (%) by Type (2021-2032)
7.2. Global Liquid Oryzenin Revenue (USD Million) and CAGR (%) by Application (2021-2032)
7.3. Global Liquid Oryzenin Revenue (USD Million) and CAGR (%) by Product (2021-2032)
By Type
Isolates
Concentrates
Others
By Application
Sports & energy nutrition
Beverages
Dairy alternatives
Bakery & confectionery
Meat analogs & extenders
Others
Chapter 8. Global Liquid Oryzenin Regional Analysis and Outlook
8.1. Global Liquid Oryzenin Revenue (USD Million) By Regions (2021- 2032)
8.2. North America Liquid Oryzenin Revenue (USD Million) by Country (2021-2032)
8.2.1. United States Liquid Oryzenin Regional Analysis and Outlook
8.2.2. Canada Liquid Oryzenin Regional Analysis and Outlook
8.2.3. Mexico Liquid Oryzenin Regional Analysis and Outlook
8.3. Europe Liquid Oryzenin Revenue (USD Million), by Country (2021-2032)
8.3.1. Germany Liquid Oryzenin Regional Analysis and Outlook
8.3.2. France Liquid Oryzenin Regional Analysis and Outlook
8.3.3. United Kingdom Liquid Oryzenin Regional Analysis and Outlook
8.3.4. Spain Liquid Oryzenin Regional Analysis and Outlook
8.3.5. Italy Liquid Oryzenin Regional Analysis and Outlook
8.3.6. Russia Liquid Oryzenin Regional Analysis and Outlook
8.3.7. Rest of Europe Liquid Oryzenin Regional Analysis and Outlook
8.4. Asia Pacific Liquid Oryzenin Revenue (USD Million) by Country (2021-2032)
8.4.1. China Liquid Oryzenin Regional Analysis and Outlook
8.4.2. Japan Liquid Oryzenin Regional Analysis and Outlook
8.4.3. India Liquid Oryzenin Regional Analysis and Outlook
8.4.4. South Korea Liquid Oryzenin Regional Analysis and Outlook
8.4.5. Australia Liquid Oryzenin Regional Analysis and Outlook
8.4.6. South East Asia Liquid Oryzenin Regional Analysis and Outlook
8.4.7. Rest of Asia Pacific Liquid Oryzenin Regional Analysis and Outlook
8.5. South America Liquid Oryzenin Revenue (USD Million), by Country (2021-2032)
8.5.1. Brazil Liquid Oryzenin Regional Analysis and Outlook
8.5.2. Argentina Liquid Oryzenin Regional Analysis and Outlook
8.5.3. Rest of South America Liquid Oryzenin Regional Analysis and Outlook
8.6. Middle East and Africa Liquid Oryzenin Revenue (USD Million) by Country (2021-2032)
8.6.1. Middle East Liquid Oryzenin Regional Analysis and Outlook
8.6.2. Africa Liquid Oryzenin Regional Analysis and Outlook
Chapter 9. North America Liquid Oryzenin Analysis and Outlook
9.1. North America Liquid Oryzenin Revenue (USD Million) by Segments (2021-2032)
9.1.1. North America Liquid Oryzenin Revenue (USD Million) by Type (2021-2032)
9.1.2. North America Liquid Oryzenin Revenue (USD Million) by Application (2021-2032)
9.1.3. North America Liquid Oryzenin Revenue (USD Million) by Product (2021-2032)
By Type
Isolates
Concentrates
Others
By Application
Sports & energy nutrition
Beverages
Dairy alternatives
Bakery & confectionery
Meat analogs & extenders
Others
Chapter 10. Europe Liquid Oryzenin Analysis and Outlook
10.1. Europe Liquid Oryzenin Revenue (USD Million), by Segments (USD Million) (2021-2032)
10.1.1. Europe Liquid Oryzenin Revenue (USD Million) by Type (2021-2032)
10.1.2. Europe Liquid Oryzenin Revenue (USD Million) by Application (2021-2032)
10.1.3. Europe Liquid Oryzenin Revenue (USD Million) by Product (2021-2032)
By Type
Isolates
Concentrates
Others
By Application
Sports & energy nutrition
Beverages
Dairy alternatives
Bakery & confectionery
Meat analogs & extenders
Others
Chapter 11. Asia Pacific Liquid Oryzenin Analysis and Outlook
11.1. Asia Pacific Liquid Oryzenin Revenue (USD Million), and Revenue (USD Million) by Segments (2021-2032)
11.1.1. Asia Pacific Liquid Oryzenin Revenue (USD Million) by Type (2021-2032)
11.1.2. Asia Pacific Liquid Oryzenin Revenue (USD Million) by Application (2021-2032)
11.1.3. Asia Pacific Liquid Oryzenin Revenue (USD Million) by Product (2021-2032)
By Type
Isolates
Concentrates
Others
By Application
Sports & energy nutrition
Beverages
Dairy alternatives
Bakery & confectionery
Meat analogs & extenders
Others
Chapter 12. South America Liquid Oryzenin Analysis and Outlook
12.1. South America Liquid Oryzenin Revenue (USD Million), by Segments (2021-2032)
12.1.1. South America Liquid Oryzenin Revenue (USD Million) by Type (2021-2032)
12.1.2. South America Liquid Oryzenin Revenue (USD Million) by Application (2021-2032)
12.1.3. South America Liquid Oryzenin Revenue (USD Million) by Product (2021-2032)
By Type
Isolates
Concentrates
Others
By Application
Sports & energy nutrition
Beverages
Dairy alternatives
Bakery & confectionery
Meat analogs & extenders
Others
Chapter 13. Middle East and Africa Liquid Oryzenin Analysis and Outlook
13.1. Middle East and Africa Liquid Oryzenin Revenue (USD Million), by Segments (2021-2032)
13.1.1. Middle East and Africa Liquid Oryzenin Revenue (USD Million) by Type (2021-2032)
13.1.2. Middle East and Africa Liquid Oryzenin Revenue (USD Million) by Application (2021-2032)
13.1.3. Middle East and Africa Liquid Oryzenin Revenue (USD Million) by Product (2021-2032)
By Type
Isolates
Concentrates
Others
By Application
Sports & energy nutrition
Beverages
Dairy alternatives
Bakery & confectionery
Meat analogs & extenders
Others
Chapter 14. Liquid Oryzenin Company Profiles
14.1 Business Overview
14.2 Product Profiles
14.3 SWOT Profiles
14.5 Recent Developments
14.6 Financial Profile
List of Companies
AIDP Inc
Axiom Foods Inc
BENEO GmbH
Bioway Organic Ingredients Co. Ltd
Golden Grain Group Ltd
Green Labs LLC
Kerry Group plc
Ribus Inc
RiceBran Technologies
Shaanxi Fuheng (FH) Biotechnology Co. Ltd
15. Methodology and Data Sources
15.1 Customization Offerings
15.2 Subscription Services
15.3 Related Reports
15.4 Publisher Expertise
LIST OF TABLES
Table 1 Market Segmentation Analysis
Table 2 Global Liquid Oryzenin Market Share of Leading Companies, 2023
Table 3 Product Offerings of Leading Companies
Table 4 Low Growth Scenario Forecasts
Table 5 Reference Case Growth Scenario
Table 6 High Growth Case Scenario
Table 7 Global Liquid Oryzenin Revenue (USD Million) And CAGR (%) By Type (2021-2032)
Table 8 Global Liquid Oryzenin Revenue (USD Million) And CAGR (%) By Application (2021-2032)
Table 9 Global Liquid Oryzenin Revenue (USD Million) And CAGR (%) By Product (2021-2032)
Table 10 Global Liquid Oryzenin Market Revenue (USD Million) By Regions (2021-2032)
Table 11 Global Liquid Oryzenin Market Share (%) By Regions (2021-2032)
Table 12 North America Liquid Oryzenin Revenue (USD Million) By Country (2021-2032)
Table 13 Europe Liquid Oryzenin Revenue (USD Million) By Country (2021-2032)
Table 14 Asia Pacific Liquid Oryzenin Revenue (USD Million) By Country (2021-2032)
Table 15 South America Liquid Oryzenin Revenue (USD Million) By Country (2021-2032)
Table 16 Middle East and Africa Liquid Oryzenin Revenue (USD Million) By Region (2021-2032)
Table 17 North America Liquid Oryzenin Revenue (USD Million) By Type (2021-2032)
Table 18 North America Liquid Oryzenin Revenue (USD Million) By Application (2021-2032)
Table 19 North America Liquid Oryzenin Revenue (USD Million) By Product (2021-2032)
Table 20 Europe Liquid Oryzenin Revenue (USD Million) By Type (2021-2032)
Table 21 Europe Liquid Oryzenin Revenue (USD Million) By Application (2021-2032)
Table 22 Europe Liquid Oryzenin Revenue (USD Million) By Product (2021-2032)
Table 23 Asia Pacific Liquid Oryzenin Revenue (USD Million) By Type (2021-2032)
Table 24 Asia Pacific Liquid Oryzenin Revenue (USD Million) By Application (2021-2032)
Table 25 Asia Pacific Liquid Oryzenin Revenue (USD Million) By Product (2021-2032)
Table 26 South America Liquid Oryzenin Revenue (USD Million) By Type (2021-2032)
Table 27 South America Liquid Oryzenin Revenue (USD Million) By Application (2021-2032)
Table 28 South America Liquid Oryzenin Revenue (USD Million) By Product (2021-2032)
Table 29 Middle East and Africa Liquid Oryzenin Revenue (USD Million) By Type (2021-2032)
Table 30 Middle East and Africa Liquid Oryzenin Revenue (USD Million) By Application (2021-2032)
Table 31 Middle East and Africa Liquid Oryzenin Revenue (USD Million) By Product (2021-2032)
LIST OF FIGURES
Figure 1. Market Scope
Figure 2. Pricing Forecasts Per Unit, 2023- 2032
Figure 3. Porter’s Five Forces
Figure 4. Global Liquid Oryzenin Market Revenue (USD Million) By Regions (2021-2032)
Figure 5. Global Liquid Oryzenin Market Share (%) By Regions (2023)
Figure 6. North America Liquid Oryzenin Revenue (USD Million) By Country (2021-2032)
Figure 7. United States Liquid Oryzenin Revenue (USD Million) By Country (2021-2032)
Figure 8. Canada Liquid Oryzenin Revenue (USD Million) By Country (2021-2032)
Figure 9. Mexico Liquid Oryzenin Revenue (USD Million) By Country (2021-2032)
Figure 10. Europe Liquid Oryzenin Revenue (USD Million) By Country (2021-2032)
Figure 11. Germany Liquid Oryzenin Revenue (USD Million) By Country (2021-2032)
Figure 12. France Liquid Oryzenin Revenue (USD Million) By Country (2021-2032)
Figure 13. United Kingdom Liquid Oryzenin Revenue (USD Million) By Country (2021-2032)
Figure 14. Spain Liquid Oryzenin Revenue (USD Million) By Country (2021-2032)
Figure 15. Italy Liquid Oryzenin Revenue (USD Million) By Country (2021-2032)
Figure 16. Russia Liquid Oryzenin Revenue (USD Million) By Country (2021-2032)
Figure 17. Rest of Europe Liquid Oryzenin Revenue (USD Million) By Country (2021-2032)
Figure 11. Asia Pacific Liquid Oryzenin Revenue (USD Million) By Country (2021-2032)
Figure 12. China Liquid Oryzenin Revenue (USD Million) By Country (2021-2032)
Figure 13. Japan Liquid Oryzenin Revenue (USD Million) By Country (2021-2032)
Figure 14. India Liquid Oryzenin Revenue (USD Million) By Country (2021-2032)
Figure 15. South Korea Liquid Oryzenin Revenue (USD Million) By Country (2021-2032)
Figure 16. Australia Liquid Oryzenin Revenue (USD Million) By Country (2021-2032)
Figure 17. South East Asia Liquid Oryzenin Revenue (USD Million) By Country (2021-2032)
Figure 18. South America Liquid Oryzenin Revenue (USD Million) By Country (2021-2032)
Figure 19. Brazil Liquid Oryzenin Revenue (USD Million) By Country (2021-2032)
Figure 20. Argentina Liquid Oryzenin Revenue (USD Million) By Country (2021-2032)
Figure 21. Rest of Asia Pacific Liquid Oryzenin Revenue (USD Million) By Country (2021-2032)
Figure 22. Middle East and Africa Liquid Oryzenin Revenue (USD Million) By Region (2021-2032)
Figure 23. Saudi Arabia Liquid Oryzenin Revenue (USD Million) By Region (2021-2032)
Figure 24. The UAE Liquid Oryzenin Revenue (USD Million) By Region (2021-2032)
Figure 25. Rest of Middle East Liquid Oryzenin Revenue (USD Million) By Region (2021-2032)
Figure 26. South Africa Liquid Oryzenin Revenue (USD Million) By Region (2021-2032)
Figure 27. Africa Liquid Oryzenin Revenue (USD Million) By Region (2021-2032)
Figure 28. North America Liquid Oryzenin Revenue (USD Million) By Type (2021-2032)
Figure 29. North America Liquid Oryzenin Revenue (USD Million) By Application (2021-2032)
Figure 30. North America Liquid Oryzenin Revenue (USD Million) By Product (2021-2032)
Figure 31. Europe Liquid Oryzenin Revenue (USD Million) By Type (2021-2032)
Figure 32. Europe Liquid Oryzenin Revenue (USD Million) By Application (2021-2032)
Figure 33. Europe Liquid Oryzenin Revenue (USD Million) By Product (2021-2032)
Figure 34. Asia Pacific Liquid Oryzenin Revenue (USD Million) By Type (2021-2032)
Figure 35. Asia Pacific Liquid Oryzenin Revenue (USD Million) By Application (2021-2032)
Figure 36. Asia Pacific Liquid Oryzenin Revenue (USD Million) By Product (2021-2032)
Figure 37. South America Liquid Oryzenin Revenue (USD Million) By Type (2021-2032)
Figure 38. South America Liquid Oryzenin Revenue (USD Million) By Application (2021-2032)
Figure 39. South America Liquid Oryzenin Revenue (USD Million) By Product (2021-2032)
Figure 40. Middle East and Africa Liquid Oryzenin Revenue (USD Million) By Type (2021-2032)
Figure 41. Middle East and Africa Liquid Oryzenin Revenue (USD Million) By Application (2021-2032)
Figure 42. Middle East and Africa Liquid Oryzenin Revenue (USD Million) By Product (2021-2032)
By Type
Isolates
Concentrates
Others
By Application
Sports & energy nutrition
Beverages
Dairy alternatives
Bakery & confectionery
Meat analogs & extenders
Others
Countries Analyzed
North America (US, Canada, Mexico)
Europe (Germany, UK, France, Spain, Italy, Russia, Rest of Europe)
Asia Pacific (China, India, Japan, South Korea, Australia, South East Asia, Rest of Asia)
South America (Brazil, Argentina, Rest of South America)
Middle East and Africa (Saudi Arabia, UAE, Rest of Middle East, South Africa, Egypt, Rest of Africa)
