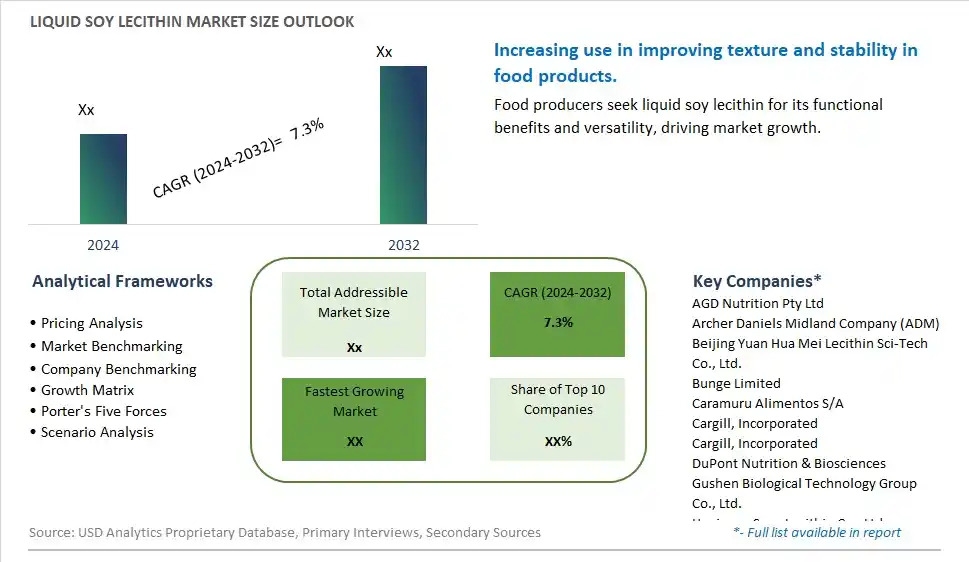
Global Liquid Soy Lecithin Market Size is valued at $XX Million in 2024 and is forecast to register a growth rate (CAGR) of 7.3% to reach $XX Million by 2032.
The global Liquid Soy Lecithin Market Comprehensive Study analyzes and forecasts the market size across 6 regions and 24 countries for diverse segments -By Type (Unrefined or Natural Lecithin, Refined Lecithin, Chemically Modified Lecithin Products), By Application (Food Uses, Therapeutic Uses, Industrial Uses, Others)
An Introduction to Liquid Soy Lecithin Market
In 2024, the liquid soy lecithin market is thriving, driven by its extensive use as an emulsifier and stabilizer in the food, pharmaceutical, and cosmetics industries. Liquid soy lecithin, derived from soybeans, is valued for its functional properties, including improving texture, extending shelf life, and enhancing nutrient absorption. The market benefits from innovations in lecithin extraction and processing techniques that ensure better quality and consistency. The trend towards clean label and natural ingredients is influencing product development. Increasing demand for functional ingredients and the rise of plant-based products are further supporting market growth.
Liquid Soy Lecithin Competitive Landscape
The market report analyses the leading companies in the industry including AGD Nutrition Pty Ltd, Archer Daniels Midland Company (ADM), Beijing Yuan Hua Mei Lecithin Sci-Tech Co., Ltd., Bunge Limited, Caramuru Alimentos S/A, Cargill, Incorporated, Cargill, Incorporated, DuPont Nutrition & Biosciences, Gushen Biological Technology Group Co., Ltd., Hexiyuan Soya Lecithin Co., Ltd., International Flavors & Fragrances Inc., Jiusan Group Co., Ltd., Lasenor Emul SL, Lipoid GmbH, Marathwada Chemical Industries Pvt. Ltd., Meryas Lecithin Co., Ltd., Qinhuangdao Glodensea Industries Co., Ltd., Ruchi Soya Industries Limited, Shandong Bohi Industry Co., Ltd., Shankar Soya Concepts, Siwei Phospholipid Co., Ltd., and Others.
Liquid Soy Lecithin Market Dynamics
Liquid Soy Lecithin Market Trend: Increasing Use in Food and Pharmaceutical Industries
The most prominent trend in the Liquid Soy Lecithin Market is the increasing use in the food and pharmaceutical industries. Liquid soy lecithin, known for its emulsifying and stabilizing properties, is widely used in various applications, including baked goods, chocolates, and pharmaceuticals. This trend is driven by the demand for high-quality and multifunctional ingredients.
Liquid Soy Lecithin Market Driver: Growth of the Functional Food and Supplement Markets
A key driver in the Liquid Soy Lecithin Market is the growth of the functional food and supplement markets. As consumers seek food products and supplements that offer health benefits, there is a growing need for ingredients that improve product quality and functionality. Liquid soy lecithin offers numerous benefits, such as improved texture, shelf life, and nutrient absorption, supporting its use in these industries.
Liquid Soy Lecithin Market Opportunity: Development of Non-GMO and Organic Lecithin Products
One significant opportunity in the Liquid Soy Lecithin Market lies in the development of non-GMO and organic lecithin products. Companies can innovate by creating lecithin products that meet consumer preferences for natural and clean label ingredients. By offering non-GMO and organic lecithin, manufacturers can attract health-conscious and environmentally aware consumers, driving market growth.
Liquid Soy Lecithin Market Share Analysis: Refined Lecithin segment generated the highest revenue share in the industry
Within the Liquid Soy Lecithin Market, the Refined Lecithin segment stands out as the largest and most significant category. Refined lecithin undergoes a purification process to remove impurities and standardize its composition, making it suitable for a wide range of applications across various industries. This type of lecithin is highly valued in food and beverage manufacturing, pharmaceuticals, cosmetics, and animal nutrition due to its emulsifying, stabilizing, and antioxidant properties. In the food industry, refined lecithin is used extensively in chocolate and confectionery products, bakery goods, margarines, and spreads to improve texture, extend shelf life, and enhance mixing properties. Further, its role as a natural emulsifier and dispersant in pharmaceutical formulations and as a nutrient in animal feeds further drives its demand. As consumer preferences for natural ingredients and clean labels continue to grow, refined soy lecithin remains pivotal, offering functional benefits while meeting stringent regulatory standards. The segment's dominance is reinforced by ongoing research and development efforts aimed at enhancing its functionality and expanding its application scope, ensuring sustained growth in the Liquid Soy Lecithin Market.
Liquid Soy Lecithin Market Share Analysis: Food Uses is the fastest growing segment over the forecast period to 2032
In the Liquid Soy Lecithin Market, the Food Uses segment emerges as the fastest-growing category projected to 2032. This segment encompasses various applications across the food industry, where liquid soy lecithin serves as a crucial ingredient valued for its emulsifying, stabilizing, and enhancing properties. In food manufacturing, soy lecithin is extensively utilized in chocolate and confectionery products, bakery items, margarines, and salad dressings to improve texture, shelf life, and mouthfeel. Its ability to blend oil and water phases effectively makes it indispensable in producing smooth and stable emulsions. Further, as consumer demand grows for natural and clean-label ingredients, soy lecithin, derived from soybeans, aligns well with these preferences. The increasing awareness of its health benefits, including its role in promoting heart health and supporting brain function due to its phospholipid content, further drives its adoption in functional foods and dietary supplements. With ongoing innovations and advancements in food processing technologies, the Food Uses segment of the Liquid Soy Lecithin Market is poised for robust growth, catering to evolving consumer preferences and industry requirements.
Liquid Soy Lecithin Market Segmentation
By Type
Unrefined or Natural Lecithin
Refined Lecithin
Chemically Modified Lecithin Products
By Application
Food Uses
Therapeutic Uses
Industrial Uses
Others
Countries Analyzed
North America (US, Canada, Mexico)
Europe (Germany, UK, France, Spain, Italy, Russia, Rest of Europe)
Asia Pacific (China, India, Japan, South Korea, Australia, South East Asia, Rest of Asia)
South America (Brazil, Argentina, Rest of South America)
Middle East and Africa (Saudi Arabia, UAE, Rest of Middle East, South Africa, Egypt, Rest of Africa)
Liquid Soy Lecithin Companies Profiled in the Study
AGD Nutrition Pty Ltd
Archer Daniels Midland Company (ADM)
Beijing Yuan Hua Mei Lecithin Sci-Tech Co., Ltd.
Bunge Limited
Caramuru Alimentos S/A
Cargill, Incorporated
Cargill, Incorporated
DuPont Nutrition & Biosciences
Gushen Biological Technology Group Co., Ltd.
Hexiyuan Soya Lecithin Co., Ltd.
International Flavors & Fragrances Inc.
Jiusan Group Co., Ltd.
Lasenor Emul SL
Lipoid GmbH
Marathwada Chemical Industries Pvt. Ltd.
Meryas Lecithin Co., Ltd.
Qinhuangdao Glodensea Industries Co., Ltd.
Ruchi Soya Industries Limited
Shandong Bohi Industry Co., Ltd.
Shankar Soya Concepts
Siwei Phospholipid Co., Ltd.
*- List Not Exhaustive
Chapter 1. TABLE OF CONTENTS
Chapter 2. Introduction to Liquid Soy Lecithin Market
2.1. Market Overview
2.2. Key Statistics and Report Highlights
2.3. Scope of the Comprehensive Study
2.3.1. Market Definition
2.3.2 Countries and Regions Covered
2.3.3 Research Objective
2.3.4 Units, Currency, and Conversions
2.3.5 Industry Value Chain
2.4. Key Market Segments
2.5. Key Companies
2.6. Study Period
Chapter 3. Strategic Analysis Review
3.1. Liquid Soy Lecithin Pricing Analysis and Forecast
3.2. Porter’s Five Forces
3.3. Market Ecosystem
3.4. SWOT Analysis
3.5. Regulatory Scenario
3.3. Effects of Inflation, Russia-Ukraine War, moderating economic growth, and other macroeconomic factors
Chapter 4. Competitive Landscape
4.1. Market Share Analysis
4.1.1. Global Liquid Soy Lecithin Market Share by Company, 2023
4.1.2. Product Offerings of Leading Liquid Soy Lecithin Companies
4.2. Market Entropy
4.2.1. New Product Launches in the Industry
4.2.2. Mergers, Acquisitions, Joint ventures, and Partnerships
4.3. Key Strategies and Best Practices
Chapter 5. Global Market Projections: Best, Reference, and Low Case Scenarios
5.1. Growth Analysis- Case Scenario Definitions
5.2. Low Growth Case Scenario Forecasts
5.3. Reference Growth Case Scenario Forecasts
5.4. High Growth Case Scenario Forecasts
Chapter 6. Market Dynamics
6.1. Liquid Soy Lecithin Market Drivers
6.2. Liquid Soy Lecithin Market Challenges
6.6. Liquid Soy Lecithin Market Opportunities
6.4. Liquid Soy Lecithin Market Trends
Chapter 7. Global Liquid Soy Lecithin Market Outlook Trends
7.1. Global Liquid Soy Lecithin Revenue (USD Million) and CAGR (%) by Type (2021-2032)
7.2. Global Liquid Soy Lecithin Revenue (USD Million) and CAGR (%) by Application (2021-2032)
7.3. Global Liquid Soy Lecithin Revenue (USD Million) and CAGR (%) by Product (2021-2032)
By Type
Unrefined or Natural Lecithin
Refined Lecithin
Chemically Modified Lecithin Products
By Application
Food Uses
Therapeutic Uses
Industrial Uses
Others
Chapter 8. Global Liquid Soy Lecithin Regional Analysis and Outlook
8.1. Global Liquid Soy Lecithin Revenue (USD Million) By Regions (2021- 2032)
8.2. North America Liquid Soy Lecithin Revenue (USD Million) by Country (2021-2032)
8.2.1. United States Liquid Soy Lecithin Regional Analysis and Outlook
8.2.2. Canada Liquid Soy Lecithin Regional Analysis and Outlook
8.2.3. Mexico Liquid Soy Lecithin Regional Analysis and Outlook
8.3. Europe Liquid Soy Lecithin Revenue (USD Million), by Country (2021-2032)
8.3.1. Germany Liquid Soy Lecithin Regional Analysis and Outlook
8.3.2. France Liquid Soy Lecithin Regional Analysis and Outlook
8.3.3. United Kingdom Liquid Soy Lecithin Regional Analysis and Outlook
8.3.4. Spain Liquid Soy Lecithin Regional Analysis and Outlook
8.3.5. Italy Liquid Soy Lecithin Regional Analysis and Outlook
8.3.6. Russia Liquid Soy Lecithin Regional Analysis and Outlook
8.3.7. Rest of Europe Liquid Soy Lecithin Regional Analysis and Outlook
8.4. Asia Pacific Liquid Soy Lecithin Revenue (USD Million) by Country (2021-2032)
8.4.1. China Liquid Soy Lecithin Regional Analysis and Outlook
8.4.2. Japan Liquid Soy Lecithin Regional Analysis and Outlook
8.4.3. India Liquid Soy Lecithin Regional Analysis and Outlook
8.4.4. South Korea Liquid Soy Lecithin Regional Analysis and Outlook
8.4.5. Australia Liquid Soy Lecithin Regional Analysis and Outlook
8.4.6. South East Asia Liquid Soy Lecithin Regional Analysis and Outlook
8.4.7. Rest of Asia Pacific Liquid Soy Lecithin Regional Analysis and Outlook
8.5. South America Liquid Soy Lecithin Revenue (USD Million), by Country (2021-2032)
8.5.1. Brazil Liquid Soy Lecithin Regional Analysis and Outlook
8.5.2. Argentina Liquid Soy Lecithin Regional Analysis and Outlook
8.5.3. Rest of South America Liquid Soy Lecithin Regional Analysis and Outlook
8.6. Middle East and Africa Liquid Soy Lecithin Revenue (USD Million) by Country (2021-2032)
8.6.1. Middle East Liquid Soy Lecithin Regional Analysis and Outlook
8.6.2. Africa Liquid Soy Lecithin Regional Analysis and Outlook
Chapter 9. North America Liquid Soy Lecithin Analysis and Outlook
9.1. North America Liquid Soy Lecithin Revenue (USD Million) by Segments (2021-2032)
9.1.1. North America Liquid Soy Lecithin Revenue (USD Million) by Type (2021-2032)
9.1.2. North America Liquid Soy Lecithin Revenue (USD Million) by Application (2021-2032)
9.1.3. North America Liquid Soy Lecithin Revenue (USD Million) by Product (2021-2032)
By Type
Unrefined or Natural Lecithin
Refined Lecithin
Chemically Modified Lecithin Products
By Application
Food Uses
Therapeutic Uses
Industrial Uses
Others
Chapter 10. Europe Liquid Soy Lecithin Analysis and Outlook
10.1. Europe Liquid Soy Lecithin Revenue (USD Million), by Segments (USD Million) (2021-2032)
10.1.1. Europe Liquid Soy Lecithin Revenue (USD Million) by Type (2021-2032)
10.1.2. Europe Liquid Soy Lecithin Revenue (USD Million) by Application (2021-2032)
10.1.3. Europe Liquid Soy Lecithin Revenue (USD Million) by Product (2021-2032)
By Type
Unrefined or Natural Lecithin
Refined Lecithin
Chemically Modified Lecithin Products
By Application
Food Uses
Therapeutic Uses
Industrial Uses
Others
Chapter 11. Asia Pacific Liquid Soy Lecithin Analysis and Outlook
11.1. Asia Pacific Liquid Soy Lecithin Revenue (USD Million), and Revenue (USD Million) by Segments (2021-2032)
11.1.1. Asia Pacific Liquid Soy Lecithin Revenue (USD Million) by Type (2021-2032)
11.1.2. Asia Pacific Liquid Soy Lecithin Revenue (USD Million) by Application (2021-2032)
11.1.3. Asia Pacific Liquid Soy Lecithin Revenue (USD Million) by Product (2021-2032)
By Type
Unrefined or Natural Lecithin
Refined Lecithin
Chemically Modified Lecithin Products
By Application
Food Uses
Therapeutic Uses
Industrial Uses
Others
Chapter 12. South America Liquid Soy Lecithin Analysis and Outlook
12.1. South America Liquid Soy Lecithin Revenue (USD Million), by Segments (2021-2032)
12.1.1. South America Liquid Soy Lecithin Revenue (USD Million) by Type (2021-2032)
12.1.2. South America Liquid Soy Lecithin Revenue (USD Million) by Application (2021-2032)
12.1.3. South America Liquid Soy Lecithin Revenue (USD Million) by Product (2021-2032)
By Type
Unrefined or Natural Lecithin
Refined Lecithin
Chemically Modified Lecithin Products
By Application
Food Uses
Therapeutic Uses
Industrial Uses
Others
Chapter 13. Middle East and Africa Liquid Soy Lecithin Analysis and Outlook
13.1. Middle East and Africa Liquid Soy Lecithin Revenue (USD Million), by Segments (2021-2032)
13.1.1. Middle East and Africa Liquid Soy Lecithin Revenue (USD Million) by Type (2021-2032)
13.1.2. Middle East and Africa Liquid Soy Lecithin Revenue (USD Million) by Application (2021-2032)
13.1.3. Middle East and Africa Liquid Soy Lecithin Revenue (USD Million) by Product (2021-2032)
By Type
Unrefined or Natural Lecithin
Refined Lecithin
Chemically Modified Lecithin Products
By Application
Food Uses
Therapeutic Uses
Industrial Uses
Others
Chapter 14. Liquid Soy Lecithin Company Profiles
14.1 Business Overview
14.2 Product Profiles
14.3 SWOT Profiles
14.5 Recent Developments
14.6 Financial Profile
List of Companies
AGD Nutrition Pty Ltd
Archer Daniels Midland Company (ADM)
Beijing Yuan Hua Mei Lecithin Sci-Tech Co., Ltd.
Bunge Limited
Caramuru Alimentos S/A
Cargill, Incorporated
Cargill, Incorporated
DuPont Nutrition & Biosciences
Gushen Biological Technology Group Co., Ltd.
Hexiyuan Soya Lecithin Co., Ltd.
International Flavors & Fragrances Inc.
Jiusan Group Co., Ltd.
Lasenor Emul SL
Lipoid GmbH
Marathwada Chemical Industries Pvt. Ltd.
Meryas Lecithin Co., Ltd.
Qinhuangdao Glodensea Industries Co., Ltd.
Ruchi Soya Industries Limited
Shandong Bohi Industry Co., Ltd.
Shankar Soya Concepts
Siwei Phospholipid Co., Ltd.
15. Methodology and Data Sources
15.1 Customization Offerings
15.2 Subscription Services
15.3 Related Reports
15.4 Publisher Expertise
LIST OF TABLES
Table 1 Market Segmentation Analysis
Table 2 Global Liquid Soy Lecithin Market Share of Leading Companies, 2023
Table 3 Product Offerings of Leading Companies
Table 4 Low Growth Scenario Forecasts
Table 5 Reference Case Growth Scenario
Table 6 High Growth Case Scenario
Table 7 Global Liquid Soy Lecithin Revenue (USD Million) And CAGR (%) By Type (2021-2032)
Table 8 Global Liquid Soy Lecithin Revenue (USD Million) And CAGR (%) By Application (2021-2032)
Table 9 Global Liquid Soy Lecithin Revenue (USD Million) And CAGR (%) By Product (2021-2032)
Table 10 Global Liquid Soy Lecithin Market Revenue (USD Million) By Regions (2021-2032)
Table 11 Global Liquid Soy Lecithin Market Share (%) By Regions (2021-2032)
Table 12 North America Liquid Soy Lecithin Revenue (USD Million) By Country (2021-2032)
Table 13 Europe Liquid Soy Lecithin Revenue (USD Million) By Country (2021-2032)
Table 14 Asia Pacific Liquid Soy Lecithin Revenue (USD Million) By Country (2021-2032)
Table 15 South America Liquid Soy Lecithin Revenue (USD Million) By Country (2021-2032)
Table 16 Middle East and Africa Liquid Soy Lecithin Revenue (USD Million) By Region (2021-2032)
Table 17 North America Liquid Soy Lecithin Revenue (USD Million) By Type (2021-2032)
Table 18 North America Liquid Soy Lecithin Revenue (USD Million) By Application (2021-2032)
Table 19 North America Liquid Soy Lecithin Revenue (USD Million) By Product (2021-2032)
Table 20 Europe Liquid Soy Lecithin Revenue (USD Million) By Type (2021-2032)
Table 21 Europe Liquid Soy Lecithin Revenue (USD Million) By Application (2021-2032)
Table 22 Europe Liquid Soy Lecithin Revenue (USD Million) By Product (2021-2032)
Table 23 Asia Pacific Liquid Soy Lecithin Revenue (USD Million) By Type (2021-2032)
Table 24 Asia Pacific Liquid Soy Lecithin Revenue (USD Million) By Application (2021-2032)
Table 25 Asia Pacific Liquid Soy Lecithin Revenue (USD Million) By Product (2021-2032)
Table 26 South America Liquid Soy Lecithin Revenue (USD Million) By Type (2021-2032)
Table 27 South America Liquid Soy Lecithin Revenue (USD Million) By Application (2021-2032)
Table 28 South America Liquid Soy Lecithin Revenue (USD Million) By Product (2021-2032)
Table 29 Middle East and Africa Liquid Soy Lecithin Revenue (USD Million) By Type (2021-2032)
Table 30 Middle East and Africa Liquid Soy Lecithin Revenue (USD Million) By Application (2021-2032)
Table 31 Middle East and Africa Liquid Soy Lecithin Revenue (USD Million) By Product (2021-2032)
LIST OF FIGURES
Figure 1. Market Scope
Figure 2. Pricing Forecasts Per Unit, 2023- 2032
Figure 3. Porter’s Five Forces
Figure 4. Global Liquid Soy Lecithin Market Revenue (USD Million) By Regions (2021-2032)
Figure 5. Global Liquid Soy Lecithin Market Share (%) By Regions (2023)
Figure 6. North America Liquid Soy Lecithin Revenue (USD Million) By Country (2021-2032)
Figure 7. United States Liquid Soy Lecithin Revenue (USD Million) By Country (2021-2032)
Figure 8. Canada Liquid Soy Lecithin Revenue (USD Million) By Country (2021-2032)
Figure 9. Mexico Liquid Soy Lecithin Revenue (USD Million) By Country (2021-2032)
Figure 10. Europe Liquid Soy Lecithin Revenue (USD Million) By Country (2021-2032)
Figure 11. Germany Liquid Soy Lecithin Revenue (USD Million) By Country (2021-2032)
Figure 12. France Liquid Soy Lecithin Revenue (USD Million) By Country (2021-2032)
Figure 13. United Kingdom Liquid Soy Lecithin Revenue (USD Million) By Country (2021-2032)
Figure 14. Spain Liquid Soy Lecithin Revenue (USD Million) By Country (2021-2032)
Figure 15. Italy Liquid Soy Lecithin Revenue (USD Million) By Country (2021-2032)
Figure 16. Russia Liquid Soy Lecithin Revenue (USD Million) By Country (2021-2032)
Figure 17. Rest of Europe Liquid Soy Lecithin Revenue (USD Million) By Country (2021-2032)
Figure 11. Asia Pacific Liquid Soy Lecithin Revenue (USD Million) By Country (2021-2032)
Figure 12. China Liquid Soy Lecithin Revenue (USD Million) By Country (2021-2032)
Figure 13. Japan Liquid Soy Lecithin Revenue (USD Million) By Country (2021-2032)
Figure 14. India Liquid Soy Lecithin Revenue (USD Million) By Country (2021-2032)
Figure 15. South Korea Liquid Soy Lecithin Revenue (USD Million) By Country (2021-2032)
Figure 16. Australia Liquid Soy Lecithin Revenue (USD Million) By Country (2021-2032)
Figure 17. South East Asia Liquid Soy Lecithin Revenue (USD Million) By Country (2021-2032)
Figure 18. South America Liquid Soy Lecithin Revenue (USD Million) By Country (2021-2032)
Figure 19. Brazil Liquid Soy Lecithin Revenue (USD Million) By Country (2021-2032)
Figure 20. Argentina Liquid Soy Lecithin Revenue (USD Million) By Country (2021-2032)
Figure 21. Rest of Asia Pacific Liquid Soy Lecithin Revenue (USD Million) By Country (2021-2032)
Figure 22. Middle East and Africa Liquid Soy Lecithin Revenue (USD Million) By Region (2021-2032)
Figure 23. Saudi Arabia Liquid Soy Lecithin Revenue (USD Million) By Region (2021-2032)
Figure 24. The UAE Liquid Soy Lecithin Revenue (USD Million) By Region (2021-2032)
Figure 25. Rest of Middle East Liquid Soy Lecithin Revenue (USD Million) By Region (2021-2032)
Figure 26. South Africa Liquid Soy Lecithin Revenue (USD Million) By Region (2021-2032)
Figure 27. Africa Liquid Soy Lecithin Revenue (USD Million) By Region (2021-2032)
Figure 28. North America Liquid Soy Lecithin Revenue (USD Million) By Type (2021-2032)
Figure 29. North America Liquid Soy Lecithin Revenue (USD Million) By Application (2021-2032)
Figure 30. North America Liquid Soy Lecithin Revenue (USD Million) By Product (2021-2032)
Figure 31. Europe Liquid Soy Lecithin Revenue (USD Million) By Type (2021-2032)
Figure 32. Europe Liquid Soy Lecithin Revenue (USD Million) By Application (2021-2032)
Figure 33. Europe Liquid Soy Lecithin Revenue (USD Million) By Product (2021-2032)
Figure 34. Asia Pacific Liquid Soy Lecithin Revenue (USD Million) By Type (2021-2032)
Figure 35. Asia Pacific Liquid Soy Lecithin Revenue (USD Million) By Application (2021-2032)
Figure 36. Asia Pacific Liquid Soy Lecithin Revenue (USD Million) By Product (2021-2032)
Figure 37. South America Liquid Soy Lecithin Revenue (USD Million) By Type (2021-2032)
Figure 38. South America Liquid Soy Lecithin Revenue (USD Million) By Application (2021-2032)
Figure 39. South America Liquid Soy Lecithin Revenue (USD Million) By Product (2021-2032)
Figure 40. Middle East and Africa Liquid Soy Lecithin Revenue (USD Million) By Type (2021-2032)
Figure 41. Middle East and Africa Liquid Soy Lecithin Revenue (USD Million) By Application (2021-2032)
Figure 42. Middle East and Africa Liquid Soy Lecithin Revenue (USD Million) By Product (2021-2032)
By Type
Unrefined or Natural Lecithin
Refined Lecithin
Chemically Modified Lecithin Products
By Application
Food Uses
Therapeutic Uses
Industrial Uses
Others
Countries Analyzed
North America (US, Canada, Mexico)
Europe (Germany, UK, France, Spain, Italy, Russia, Rest of Europe)
Asia Pacific (China, India, Japan, South Korea, Australia, South East Asia, Rest of Asia)
South America (Brazil, Argentina, Rest of South America)
Middle East and Africa (Saudi Arabia, UAE, Rest of Middle East, South Africa, Egypt, Rest of Africa)
