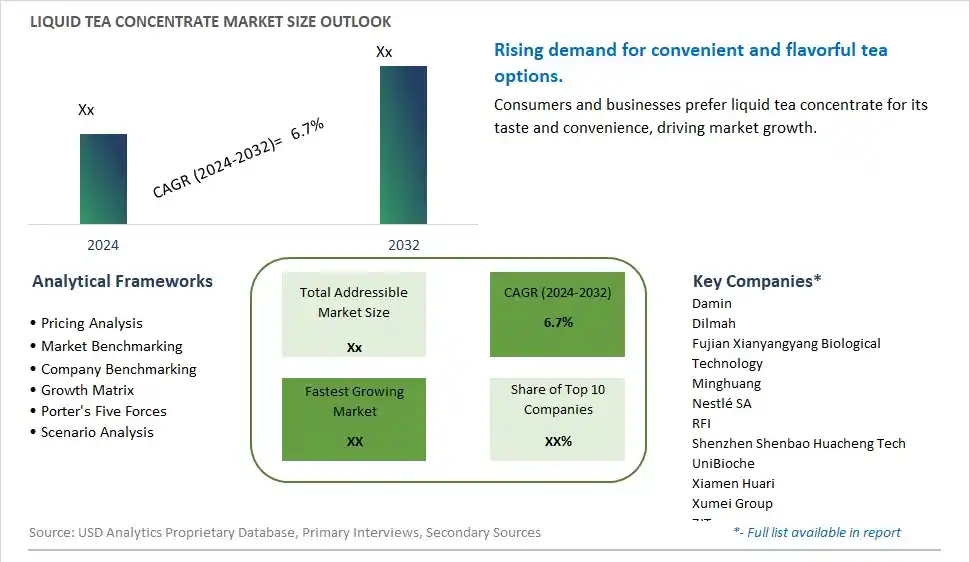
Global Liquid Tea Concentrate Market Size is valued at $XX Million in 2024 and is forecast to register a growth rate (CAGR) of 6.7% to reach $XX Million by 2032.
The global Liquid Tea Concentrate Market Comprehensive Study analyzes and forecasts the market size across 6 regions and 24 countries for diverse segments -By Type (Black Tea, Green Tea, Oolong Tea, Pu'er Tea, Others), By Type (Organic, Conventional)
An Introduction to Liquid Tea Concentrate Market
The liquid tea concentrate market in 2024 is expanding rapidly, driven by the demand for convenient, high-quality tea solutions for both commercial and home use. Liquid tea concentrates offer the convenience of instant tea preparation with the rich flavor and aroma of freshly brewed tea. The market benefits from innovations in tea extraction and concentration techniques that enhance product quality and shelf life. The trend towards premiumization in the beverage sector and the popularity of ready-to-drink tea beverages are influencing market dynamics. The rise of on-the-go consumption and the growth of the tea culture are further supporting demand for liquid tea concentrates.
Liquid Tea Concentrate Competitive Landscape
The market report analyses the leading companies in the industry including Damin, Dilmah, Fujian Xianyangyang Biological Technology, Minghuang, Nestlé SA, RFI, Shenzhen Shenbao Huacheng Tech, UniBioche, Xiamen Huari, Xumei Group, ZJT, and Others.
Liquid Tea Concentrate Market Dynamics
Liquid Tea Concentrate Market Trend: Rising Demand for Ready-to-Drink Beverages
The most prominent trend in the Liquid Tea Concentrate Market is the rising demand for ready-to-drink (RTD) beverages. Liquid tea concentrates, which offer convenience and consistent quality, are becoming popular among consumers seeking quick and easy tea options. This trend is driven by the busy lifestyles of modern consumers who value convenience without compromising on taste.
Liquid Tea Concentrate Market Driver: Growth of the Specialty Tea Market
Liquid Tea Concentrate Market Share Analysis: Black Tea segment generated the highest revenue share in the industry
In the Liquid Tea Concentrate Market, the Black Tea segment stands out as the largest category among the different tea types. Black tea, known for its robust flavor and dark color, holds a significant share in the global tea market due to its widespread consumption and versatile applications. As a concentrated form, black tea extract is popularly used in ready-to-drink beverages, tea-based beverages, and various culinary applications. Its rich flavor profile makes it a preferred choice for products aimed at both traditional tea drinkers and those seeking refreshing and flavorful beverages. The black tea segment's dominance is bolstered by its strong presence in the global beverage industry, where it is often marketed for its antioxidant properties and potential health benefits. With increasing consumer awareness about the health advantages associated with tea consumption, including its potential to boost immunity and support cardiovascular health, the demand for black tea concentrate continues to grow. Further, innovations in processing technologies and packaging formats further contribute to the segment's expansion, catering to diverse consumer preferences and driving growth in the Liquid Tea Concentrate Market.
Liquid Tea Concentrate Market Share Analysis: Organic Tea Concentrate is the fastest growing segment over the forecast period to 2032
Within the Liquid Tea Concentrate Market, the Organic Tea Concentrate segment is poised for rapid growth through 2032. Organic products have witnessed increasing demand globally, driven by consumer preferences for natural and sustainable options. Organic tea concentrates, derived from organically grown tea leaves without synthetic pesticides or fertilizers, appeal to health-conscious consumers seeking clean-label products. This segment's growth is further propelled by rising awareness about environmental sustainability and ethical farming practices among consumers. The organic certification assures consumers of the product's quality, safety, and adherence to stringent organic standards, making it a preferred choice in the beverage industry. Further, the growing availability of organic tea concentrates in various flavors and blends, coupled with expanding distribution channels including specialty stores and online platforms, contributes to its market expansion. As health and wellness trends continue to influence consumer choices, the Organic Tea Concentrate segment is expected to see sustained growth, supported by increasing disposable incomes and a shift towards healthier beverage options.
Liquid Tea Concentrate Market Segmentation
By Type
Black Tea
Green Tea
Oolong Tea
Pu'er Tea
Others
By Type
Organic
Conventional
Countries Analyzed
North America (US, Canada, Mexico)
Europe (Germany, UK, France, Spain, Italy, Russia, Rest of Europe)
Asia Pacific (China, India, Japan, South Korea, Australia, South East Asia, Rest of Asia)
South America (Brazil, Argentina, Rest of South America)
Middle East and Africa (Saudi Arabia, UAE, Rest of Middle East, South Africa, Egypt, Rest of Africa)
Liquid Tea Concentrate Companies Profiled in the Study
Damin
Dilmah
Fujian Xianyangyang Biological Technology
Minghuang
Nestlé SA
RFI
Shenzhen Shenbao Huacheng Tech
UniBioche
Xiamen Huari
Xumei Group
ZJT
*- List Not Exhaustive
Chapter 1. TABLE OF CONTENTS
Chapter 2. Introduction to Liquid Tea Concentrate Market
2.1. Market Overview
2.2. Key Statistics and Report Highlights
2.3. Scope of the Comprehensive Study
2.3.1. Market Definition
2.3.2 Countries and Regions Covered
2.3.3 Research Objective
2.3.4 Units, Currency, and Conversions
2.3.5 Industry Value Chain
2.4. Key Market Segments
2.5. Key Companies
2.6. Study Period
Chapter 3. Strategic Analysis Review
3.1. Liquid Tea Concentrate Pricing Analysis and Forecast
3.2. Porter’s Five Forces
3.3. Market Ecosystem
3.4. SWOT Analysis
3.5. Regulatory Scenario
3.3. Effects of Inflation, Russia-Ukraine War, moderating economic growth, and other macroeconomic factors
Chapter 4. Competitive Landscape
4.1. Market Share Analysis
4.1.1. Global Liquid Tea Concentrate Market Share by Company, 2023
4.1.2. Product Offerings of Leading Liquid Tea Concentrate Companies
4.2. Market Entropy
4.2.1. New Product Launches in the Industry
4.2.2. Mergers, Acquisitions, Joint ventures, and Partnerships
4.3. Key Strategies and Best Practices
Chapter 5. Global Market Projections: Best, Reference, and Low Case Scenarios
5.1. Growth Analysis- Case Scenario Definitions
5.2. Low Growth Case Scenario Forecasts
5.3. Reference Growth Case Scenario Forecasts
5.4. High Growth Case Scenario Forecasts
Chapter 6. Market Dynamics
6.1. Liquid Tea Concentrate Market Drivers
6.2. Liquid Tea Concentrate Market Challenges
6.6. Liquid Tea Concentrate Market Opportunities
6.4. Liquid Tea Concentrate Market Trends
Chapter 7. Global Liquid Tea Concentrate Market Outlook Trends
7.1. Global Liquid Tea Concentrate Revenue (USD Million) and CAGR (%) by Type (2021-2032)
7.2. Global Liquid Tea Concentrate Revenue (USD Million) and CAGR (%) by Application (2021-2032)
7.3. Global Liquid Tea Concentrate Revenue (USD Million) and CAGR (%) by Product (2021-2032)
By Type
Black Tea
Green Tea
Oolong Tea
Pu'er Tea
Others
By Type
Organic
Conventional
Chapter 8. Global Liquid Tea Concentrate Regional Analysis and Outlook
8.1. Global Liquid Tea Concentrate Revenue (USD Million) By Regions (2021- 2032)
8.2. North America Liquid Tea Concentrate Revenue (USD Million) by Country (2021-2032)
8.2.1. United States Liquid Tea Concentrate Regional Analysis and Outlook
8.2.2. Canada Liquid Tea Concentrate Regional Analysis and Outlook
8.2.3. Mexico Liquid Tea Concentrate Regional Analysis and Outlook
8.3. Europe Liquid Tea Concentrate Revenue (USD Million), by Country (2021-2032)
8.3.1. Germany Liquid Tea Concentrate Regional Analysis and Outlook
8.3.2. France Liquid Tea Concentrate Regional Analysis and Outlook
8.3.3. United Kingdom Liquid Tea Concentrate Regional Analysis and Outlook
8.3.4. Spain Liquid Tea Concentrate Regional Analysis and Outlook
8.3.5. Italy Liquid Tea Concentrate Regional Analysis and Outlook
8.3.6. Russia Liquid Tea Concentrate Regional Analysis and Outlook
8.3.7. Rest of Europe Liquid Tea Concentrate Regional Analysis and Outlook
8.4. Asia Pacific Liquid Tea Concentrate Revenue (USD Million) by Country (2021-2032)
8.4.1. China Liquid Tea Concentrate Regional Analysis and Outlook
8.4.2. Japan Liquid Tea Concentrate Regional Analysis and Outlook
8.4.3. India Liquid Tea Concentrate Regional Analysis and Outlook
8.4.4. South Korea Liquid Tea Concentrate Regional Analysis and Outlook
8.4.5. Australia Liquid Tea Concentrate Regional Analysis and Outlook
8.4.6. South East Asia Liquid Tea Concentrate Regional Analysis and Outlook
8.4.7. Rest of Asia Pacific Liquid Tea Concentrate Regional Analysis and Outlook
8.5. South America Liquid Tea Concentrate Revenue (USD Million), by Country (2021-2032)
8.5.1. Brazil Liquid Tea Concentrate Regional Analysis and Outlook
8.5.2. Argentina Liquid Tea Concentrate Regional Analysis and Outlook
8.5.3. Rest of South America Liquid Tea Concentrate Regional Analysis and Outlook
8.6. Middle East and Africa Liquid Tea Concentrate Revenue (USD Million) by Country (2021-2032)
8.6.1. Middle East Liquid Tea Concentrate Regional Analysis and Outlook
8.6.2. Africa Liquid Tea Concentrate Regional Analysis and Outlook
Chapter 9. North America Liquid Tea Concentrate Analysis and Outlook
9.1. North America Liquid Tea Concentrate Revenue (USD Million) by Segments (2021-2032)
9.1.1. North America Liquid Tea Concentrate Revenue (USD Million) by Type (2021-2032)
9.1.2. North America Liquid Tea Concentrate Revenue (USD Million) by Application (2021-2032)
9.1.3. North America Liquid Tea Concentrate Revenue (USD Million) by Product (2021-2032)
By Type
Black Tea
Green Tea
Oolong Tea
Pu'er Tea
Others
By Type
Organic
Conventional
Chapter 10. Europe Liquid Tea Concentrate Analysis and Outlook
10.1. Europe Liquid Tea Concentrate Revenue (USD Million), by Segments (USD Million) (2021-2032)
10.1.1. Europe Liquid Tea Concentrate Revenue (USD Million) by Type (2021-2032)
10.1.2. Europe Liquid Tea Concentrate Revenue (USD Million) by Application (2021-2032)
10.1.3. Europe Liquid Tea Concentrate Revenue (USD Million) by Product (2021-2032)
By Type
Black Tea
Green Tea
Oolong Tea
Pu'er Tea
Others
By Type
Organic
Conventional
Chapter 11. Asia Pacific Liquid Tea Concentrate Analysis and Outlook
11.1. Asia Pacific Liquid Tea Concentrate Revenue (USD Million), and Revenue (USD Million) by Segments (2021-2032)
11.1.1. Asia Pacific Liquid Tea Concentrate Revenue (USD Million) by Type (2021-2032)
11.1.2. Asia Pacific Liquid Tea Concentrate Revenue (USD Million) by Application (2021-2032)
11.1.3. Asia Pacific Liquid Tea Concentrate Revenue (USD Million) by Product (2021-2032)
By Type
Black Tea
Green Tea
Oolong Tea
Pu'er Tea
Others
By Type
Organic
Conventional
Chapter 12. South America Liquid Tea Concentrate Analysis and Outlook
12.1. South America Liquid Tea Concentrate Revenue (USD Million), by Segments (2021-2032)
12.1.1. South America Liquid Tea Concentrate Revenue (USD Million) by Type (2021-2032)
12.1.2. South America Liquid Tea Concentrate Revenue (USD Million) by Application (2021-2032)
12.1.3. South America Liquid Tea Concentrate Revenue (USD Million) by Product (2021-2032)
By Type
Black Tea
Green Tea
Oolong Tea
Pu'er Tea
Others
By Type
Organic
Conventional
Chapter 13. Middle East and Africa Liquid Tea Concentrate Analysis and Outlook
13.1. Middle East and Africa Liquid Tea Concentrate Revenue (USD Million), by Segments (2021-2032)
13.1.1. Middle East and Africa Liquid Tea Concentrate Revenue (USD Million) by Type (2021-2032)
13.1.2. Middle East and Africa Liquid Tea Concentrate Revenue (USD Million) by Application (2021-2032)
13.1.3. Middle East and Africa Liquid Tea Concentrate Revenue (USD Million) by Product (2021-2032)
By Type
Black Tea
Green Tea
Oolong Tea
Pu'er Tea
Others
By Type
Organic
Conventional
Chapter 14. Liquid Tea Concentrate Company Profiles
14.1 Business Overview
14.2 Product Profiles
14.3 SWOT Profiles
14.5 Recent Developments
14.6 Financial Profile
List of Companies
Damin
Dilmah
Fujian Xianyangyang Biological Technology
Minghuang
Nestlé SA
RFI
Shenzhen Shenbao Huacheng Tech
UniBioche
Xiamen Huari
Xumei Group
ZJT
15. Methodology and Data Sources
15.1 Customization Offerings
15.2 Subscription Services
15.3 Related Reports
15.4 Publisher Expertise
LIST OF TABLES
Table 1 Market Segmentation Analysis
Table 2 Global Liquid Tea Concentrate Market Share of Leading Companies, 2023
Table 3 Product Offerings of Leading Companies
Table 4 Low Growth Scenario Forecasts
Table 5 Reference Case Growth Scenario
Table 6 High Growth Case Scenario
Table 7 Global Liquid Tea Concentrate Revenue (USD Million) And CAGR (%) By Type (2021-2032)
Table 8 Global Liquid Tea Concentrate Revenue (USD Million) And CAGR (%) By Application (2021-2032)
Table 9 Global Liquid Tea Concentrate Revenue (USD Million) And CAGR (%) By Product (2021-2032)
Table 10 Global Liquid Tea Concentrate Market Revenue (USD Million) By Regions (2021-2032)
Table 11 Global Liquid Tea Concentrate Market Share (%) By Regions (2021-2032)
Table 12 North America Liquid Tea Concentrate Revenue (USD Million) By Country (2021-2032)
Table 13 Europe Liquid Tea Concentrate Revenue (USD Million) By Country (2021-2032)
Table 14 Asia Pacific Liquid Tea Concentrate Revenue (USD Million) By Country (2021-2032)
Table 15 South America Liquid Tea Concentrate Revenue (USD Million) By Country (2021-2032)
Table 16 Middle East and Africa Liquid Tea Concentrate Revenue (USD Million) By Region (2021-2032)
Table 17 North America Liquid Tea Concentrate Revenue (USD Million) By Type (2021-2032)
Table 18 North America Liquid Tea Concentrate Revenue (USD Million) By Application (2021-2032)
Table 19 North America Liquid Tea Concentrate Revenue (USD Million) By Product (2021-2032)
Table 20 Europe Liquid Tea Concentrate Revenue (USD Million) By Type (2021-2032)
Table 21 Europe Liquid Tea Concentrate Revenue (USD Million) By Application (2021-2032)
Table 22 Europe Liquid Tea Concentrate Revenue (USD Million) By Product (2021-2032)
Table 23 Asia Pacific Liquid Tea Concentrate Revenue (USD Million) By Type (2021-2032)
Table 24 Asia Pacific Liquid Tea Concentrate Revenue (USD Million) By Application (2021-2032)
Table 25 Asia Pacific Liquid Tea Concentrate Revenue (USD Million) By Product (2021-2032)
Table 26 South America Liquid Tea Concentrate Revenue (USD Million) By Type (2021-2032)
Table 27 South America Liquid Tea Concentrate Revenue (USD Million) By Application (2021-2032)
Table 28 South America Liquid Tea Concentrate Revenue (USD Million) By Product (2021-2032)
Table 29 Middle East and Africa Liquid Tea Concentrate Revenue (USD Million) By Type (2021-2032)
Table 30 Middle East and Africa Liquid Tea Concentrate Revenue (USD Million) By Application (2021-2032)
Table 31 Middle East and Africa Liquid Tea Concentrate Revenue (USD Million) By Product (2021-2032)
LIST OF FIGURES
Figure 1. Market Scope
Figure 2. Pricing Forecasts Per Unit, 2023- 2032
Figure 3. Porter’s Five Forces
Figure 4. Global Liquid Tea Concentrate Market Revenue (USD Million) By Regions (2021-2032)
Figure 5. Global Liquid Tea Concentrate Market Share (%) By Regions (2023)
Figure 6. North America Liquid Tea Concentrate Revenue (USD Million) By Country (2021-2032)
Figure 7. United States Liquid Tea Concentrate Revenue (USD Million) By Country (2021-2032)
Figure 8. Canada Liquid Tea Concentrate Revenue (USD Million) By Country (2021-2032)
Figure 9. Mexico Liquid Tea Concentrate Revenue (USD Million) By Country (2021-2032)
Figure 10. Europe Liquid Tea Concentrate Revenue (USD Million) By Country (2021-2032)
Figure 11. Germany Liquid Tea Concentrate Revenue (USD Million) By Country (2021-2032)
Figure 12. France Liquid Tea Concentrate Revenue (USD Million) By Country (2021-2032)
Figure 13. United Kingdom Liquid Tea Concentrate Revenue (USD Million) By Country (2021-2032)
Figure 14. Spain Liquid Tea Concentrate Revenue (USD Million) By Country (2021-2032)
Figure 15. Italy Liquid Tea Concentrate Revenue (USD Million) By Country (2021-2032)
Figure 16. Russia Liquid Tea Concentrate Revenue (USD Million) By Country (2021-2032)
Figure 17. Rest of Europe Liquid Tea Concentrate Revenue (USD Million) By Country (2021-2032)
Figure 11. Asia Pacific Liquid Tea Concentrate Revenue (USD Million) By Country (2021-2032)
Figure 12. China Liquid Tea Concentrate Revenue (USD Million) By Country (2021-2032)
Figure 13. Japan Liquid Tea Concentrate Revenue (USD Million) By Country (2021-2032)
Figure 14. India Liquid Tea Concentrate Revenue (USD Million) By Country (2021-2032)
Figure 15. South Korea Liquid Tea Concentrate Revenue (USD Million) By Country (2021-2032)
Figure 16. Australia Liquid Tea Concentrate Revenue (USD Million) By Country (2021-2032)
Figure 17. South East Asia Liquid Tea Concentrate Revenue (USD Million) By Country (2021-2032)
Figure 18. South America Liquid Tea Concentrate Revenue (USD Million) By Country (2021-2032)
Figure 19. Brazil Liquid Tea Concentrate Revenue (USD Million) By Country (2021-2032)
Figure 20. Argentina Liquid Tea Concentrate Revenue (USD Million) By Country (2021-2032)
Figure 21. Rest of Asia Pacific Liquid Tea Concentrate Revenue (USD Million) By Country (2021-2032)
Figure 22. Middle East and Africa Liquid Tea Concentrate Revenue (USD Million) By Region (2021-2032)
Figure 23. Saudi Arabia Liquid Tea Concentrate Revenue (USD Million) By Region (2021-2032)
Figure 24. The UAE Liquid Tea Concentrate Revenue (USD Million) By Region (2021-2032)
Figure 25. Rest of Middle East Liquid Tea Concentrate Revenue (USD Million) By Region (2021-2032)
Figure 26. South Africa Liquid Tea Concentrate Revenue (USD Million) By Region (2021-2032)
Figure 27. Africa Liquid Tea Concentrate Revenue (USD Million) By Region (2021-2032)
Figure 28. North America Liquid Tea Concentrate Revenue (USD Million) By Type (2021-2032)
Figure 29. North America Liquid Tea Concentrate Revenue (USD Million) By Application (2021-2032)
Figure 30. North America Liquid Tea Concentrate Revenue (USD Million) By Product (2021-2032)
Figure 31. Europe Liquid Tea Concentrate Revenue (USD Million) By Type (2021-2032)
Figure 32. Europe Liquid Tea Concentrate Revenue (USD Million) By Application (2021-2032)
Figure 33. Europe Liquid Tea Concentrate Revenue (USD Million) By Product (2021-2032)
Figure 34. Asia Pacific Liquid Tea Concentrate Revenue (USD Million) By Type (2021-2032)
Figure 35. Asia Pacific Liquid Tea Concentrate Revenue (USD Million) By Application (2021-2032)
Figure 36. Asia Pacific Liquid Tea Concentrate Revenue (USD Million) By Product (2021-2032)
Figure 37. South America Liquid Tea Concentrate Revenue (USD Million) By Type (2021-2032)
Figure 38. South America Liquid Tea Concentrate Revenue (USD Million) By Application (2021-2032)
Figure 39. South America Liquid Tea Concentrate Revenue (USD Million) By Product (2021-2032)
Figure 40. Middle East and Africa Liquid Tea Concentrate Revenue (USD Million) By Type (2021-2032)
Figure 41. Middle East and Africa Liquid Tea Concentrate Revenue (USD Million) By Application (2021-2032)
Figure 42. Middle East and Africa Liquid Tea Concentrate Revenue (USD Million) By Product (2021-2032)
By Type
Black Tea
Green Tea
Oolong Tea
Pu'er Tea
Others
By Type
Organic
Conventional
Countries Analyzed
North America (US, Canada, Mexico)
Europe (Germany, UK, France, Spain, Italy, Russia, Rest of Europe)
Asia Pacific (China, India, Japan, South Korea, Australia, South East Asia, Rest of Asia)
South America (Brazil, Argentina, Rest of South America)
Middle East and Africa (Saudi Arabia, UAE, Rest of Middle East, South Africa, Egypt, Rest of Africa)
