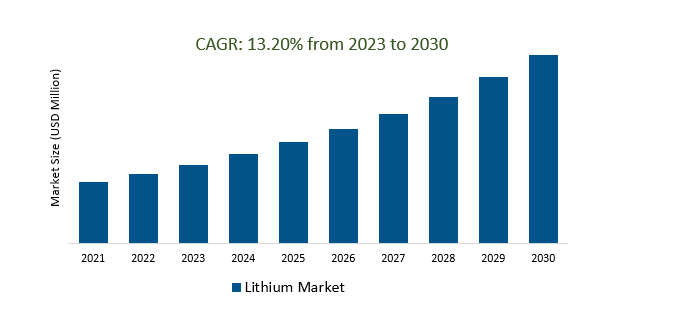
The Global Lithium Market Size is estimated to be US 8.5 Billion in 2023 and is poised to register 13.2% growth over the forecast period from 2023 to 2030 to reach US $ 20.25 billion in 2030.
The Lithium Market is influenced by various factors, including electric vehicle (EV) adoption, energy storage, renewable energy growth, government policies, supply dynamics, technological advancements, geopolitical factors, recycling, raw material prices, and consumer electronics. The demand for lithium batteries is driven by the increasing demand for electric cars, which are primarily lithium-ion batteries. Energy storage systems, including grid-level and home-based batteries, are becoming increasingly important for renewable energy integration and grid stability. The growth of renewable energy sources like solar and wind power relies on energy storage solutions, often using lithium-ion batteries. Government incentives, subsidies, and regulations related to EVs and clean energy can drive demand, while regulatory changes can affect supply chains. Technological advancements in battery technology, such as improvements in lithium-ion batteries and alternative chemistries, can also affect the competitiveness of lithium in the energy storage market. Geopolitical factors, such as trade disputes and supply chain disruptions, can also impact the availability and pricing of lithium and lithium-related materials.
The Impact of Electric Vehicle (EV) Adoption on the Lithium Industry is creating a demand in the market.
The rapid adoption of electric vehicles (EVs) is revolutionizing the global automotive industry and, in turn, fuelling a significant demand surge in the lithium market. Lithium is a critical component in the production of lithium-ion batteries, which are the primary power source for EVs. As more consumers and governments embrace sustainable transportation options, the demand for EVs continues to grow exponentially. This surge in demand has put immense pressure on the lithium industry to ramp up production and exploration efforts to secure a stable supply chain. Consequently, lithium producers and mining companies are expanding operations, and investors are closely monitoring the lithium market's dynamics as it plays a pivotal role in the clean energy transition. This evolving landscape is not only reshaping the automotive sector but also transforming the future of energy storage and renewable energy technologies.
The Significance of Energy Storage and Lithium-ion Batteries is boosting the market.
The significance of energy storage and lithium-ion batteries has propelled the lithium market to unprecedented heights. These advanced batteries have revolutionized various industries, including electric vehicles, renewable energy, and portable electronics. As the world shifts towards cleaner and more sustainable energy solutions, lithium-ion batteries play a pivotal role in storing intermittent renewable energy sources like solar and wind power, ensuring a consistent and reliable energy supply. Moreover, the exponential growth in the electric vehicle sector heavily relies on lithium-ion batteries, making them a critical component for reducing greenhouse gas emissions and combatting climate change. This increasing demand for lithium-ion batteries has spurred investments in lithium mining and production, driving the lithium market's expansion and positioning it as a key player in the global transition to a greener and more energy-efficient future.
The Impact of Consumer Electronics Trends on Lithium-ion Battery Demands.
Consumer electronics trends have a profound influence on the demand for lithium-ion batteries within the lithium market. As consumers increasingly embrace smartphones, laptops, wearables, and electric vehicles, the need for high-performance, long-lasting batteries has surged. This has led to a substantial uptick in lithium-ion battery production, with manufacturers striving to innovate and optimize battery technology to meet these growing demands. The lithium market, in turn, experiences fluctuations in supply and demand dynamics, impacting prices and the overall industry landscape. To keep pace with this evolving market, lithium producers are expanding their operations, exploring new mining techniques, and investing in research to ensure a sustainable and efficient supply chain for lithium-ion batteries in the face of ever-evolving consumer electronics trends.
Market Share Analysis:
Lithium hydroxide is the most dominant type of lithium in the market.
Lithium hydroxide, a crucial compound in the lithium industry, holds a prominent position as the most prevalent form of lithium sought after in today's market. Its significance stems from its widespread use in various applications, particularly in lithium-ion batteries, which power numerous electronic devices and electric vehicles. This compound is preferred due to its high purity and superior performance characteristics, making it ideal for energy storage solutions. As the global shift towards cleaner and more sustainable energy sources continues, lithium hydroxide's demand is poised to surge, further solidifying its dominance as the preferred lithium variant. Its pivotal role in shaping the future of renewable energy underscores its strategic importance in the modern industrial landscape. Manufacturers and researchers alike are actively exploring ways to optimize the production and utilization of lithium hydroxide, ensuring its continued reign in the ever-evolving lithium market.
The lithium market is significantly influenced by the automotive industry, which stands as its most dominant end user.
The prominence can be attributed to the escalating demand for lithium-ion batteries, primarily in electric vehicles (EVs). As the world shifts towards sustainable transportation solutions, lithium's role as a crucial component in these batteries has surged. Automakers are investing heavily in lithium technology to enhance battery performance, driving up demand. Additionally, government incentives and regulations favouring clean energy vehicles have bolstered lithium's importance in the automotive sector. Consequently, the lithium market's fortunes are closely intertwined with the continued growth of the automotive industry and the global transition to eco-friendly transportation alternatives.
Lithium Market Segmentation
Type
- Carbonates
- Hydroxide
- Others
End-User
- Automotive
- Consumer electronics
- Grid storage
- Glass & ceramics
- Others
By Region
- North America (United States, Canada, Mexico)
- Europe (Germany, France, United Kingdom, Spain, Italy, Others)
- Asia Pacific (China, India, Japan, South Korea, Australia, Others)
- Latin America (Brazil, Argentina, Others)
- Middle East and Africa (Saudi Arabia, UAE, Kuwait, Other Middle East, South Africa, Nigeria, Other Africa)
Lithium Market Companies
- Albemarle Corporation
- Ganfeng Lithium Co., Ltd.
- SQM S.A.
- Tianqi Lithium Corporation
- Livent Corporation
- Lithium Americas Corp
- Pilbara Minerals
- Orocobre Limited Pty Ltd
- Mineral Resources
*List not exhaustive
Lithium Market Outlook 2023
1 Market Overview
1.1 Introduction to the Lithium Market
1.2 Scope of the Study
1.3 Research Objective
1.3.1 Key Market Scope and Segments
1.3.2 Players Covered
1.3.3 Years Considered
2 Executive Summary
2.1 2023 Lithium Industry- Market Statistics
3 Market Dynamics
3.1 Market Drivers
3.2 Market Challenges
3.3 Market Opportunities
3.4 Market Trends
4 Market Factor Analysis
4.1 Porter’s Five Forces
4.2 Market Entropy
4.2.1 Global Lithium Market Companies with Area Served
4.2.2 Products Offerings Global Lithium Market
5 COVID-19 Impact Analysis and Outlook Scenarios
5.1.1 Covid-19 Impact Analysis
5.1.2 Post-COVID-19 Scenario- Low Growth Case
5.1.3 Post-COVID-19 Scenario- Reference Growth Case
5.1.4 Post-COVID-19 Scenario- Low Growth Case
6 Global Lithium Market Trends
6.1 Global Lithium Revenue (USD Million) and CAGR (%) by Type (2018-2030)
6.2 Global Lithium Revenue (USD Million) and CAGR (%) by Applications (2018-2030)
6.3 Global Lithium Revenue (USD Million) and CAGR (%) by Regions (2018-2030)
7 Global Lithium Market Revenue (USD Million) by Type, and Applications (2018-2022)
7.1 Global Lithium Revenue (USD Million) by Type (2018-2022)
7.1.1 Global Lithium Revenue (USD Million), Market Share (%) by Type (2018-2022)
7.2 Global Lithium Revenue (USD Million) by Applications (2018-2022)
7.2.1 Global Lithium Revenue (USD Million), Market Share (%) by Applications (2018-2022)
8 Global Lithium Development Regional Status and Outlook
8.1 Global Lithium Revenue (USD Million) By Regions (2018-2022)
8.2 North America Lithium Revenue (USD Million) by Type, and Application (2018-2022)
8.2.1 North America Lithium Revenue (USD Million) by Country (2018-2022)
8.2.2 North America Lithium Revenue (USD Million) by Type (2018-2022)
8.2.3 North America Lithium Revenue (USD Million) by Applications (2018-2022)
8.3 Europe Lithium Revenue (USD Million), by Type, and Applications (USD Million) (2018-2022)
8.3.1 Europe Lithium Revenue (USD Million), by Country (2018-2022)
8.3.2 Europe Lithium Revenue (USD Million) by Type (2018-2022)
8.3.3 Europe Lithium Revenue (USD Million) by Applications (2018-2022)
8.4 Asia Pacific Lithium Revenue (USD Million), and Revenue (USD Million) by Type, and Applications (2018-2022)
8.4.1 Asia Pacific Lithium Revenue (USD Million) by Country (2018-2022)
8.4.2 Asia Pacific Lithium Revenue (USD Million) by Type (2018-2022)
8.4.3 Asia Pacific Lithium Revenue (USD Million) by Applications (2018-2022)
8.5 South America Lithium Revenue (USD Million), by Type, and Applications (2018-2022)
8.5.1 South America Lithium Revenue (USD Million), by Country (2018-2022)
8.5.2 South America Lithium Revenue (USD Million) by Type (2018-2022)
8.5.3 South America Lithium Revenue (USD Million) by Applications (2018-2022)
8.6 Middle East and Africa Lithium Revenue (USD Million), by Type, Technology, Application, Thickness (2018-2022)
8.6.1 Middle East and Africa Lithium Revenue (USD Million) by Country (2018-2022)
8.6.2 Middle East and Africa Lithium Revenue (USD Million) by Type (2018-2022)
8.6.3 Middle East and Africa Lithium Revenue (USD Million) by Applications (2018-2022)
9 Company Profiles
10 Global Lithium Market Revenue (USD Million), by Type, and Applications (2023-2030)
10.1 Global Lithium Revenue (USD Million) and Market Share (%) by Type (2023-2030)
10.1.1 Global Lithium Revenue (USD Million), and Market Share (%) by Type (2023-2030)
10.2 Global Lithium Revenue (USD Million) and Market Share (%) by Applications (2023-2030)
10.2.1 Global Lithium Revenue (USD Million), and Market Share (%) by Applications (2023-2030)
11 Global Lithium Development Regional Status and Outlook Forecast
11.1 Global Lithium Revenue (USD Million) By Regions (2023-2030)
11.2 North America Lithium Revenue (USD Million) by Type, and Applications (2023-2030)
11.2.1 North America Lithium Revenue (USD) Million by Country (2023-2030)
11.2.2 North America Lithium Revenue (USD Million), by Type (2023-2030)
11.2.3 North America Lithium Revenue (USD Million), Market Share (%) by Applications (2023-2030)
11.3 Europe Lithium Revenue (USD Million), by Type, and Applications (2023-2030)
11.3.1 Europe Lithium Revenue (USD Million), by Country (2023-2030)
11.3.2 Europe Lithium Revenue (USD Million), by Type (2023-2030)
11.3.3 Europe Lithium Revenue (USD Million), by Applications (2023-2030)
11.4 Asia Pacific Lithium Revenue (USD Million) by Type, and Applications (2023-2030)
11.4.1 Asia Pacific Lithium Revenue (USD Million), by Country (2023-2030)
11.4.2 Asia Pacific Lithium Revenue (USD Million), by Type (2023-2030)
11.4.3 Asia Pacific Lithium Revenue (USD Million), by Applications (2023-2030)
11.5 South America Lithium Revenue (USD Million), by Type, and Applications (2023-2030)
11.5.1 South America Lithium Revenue (USD Million), by Country (2023-2030)
11.5.2 South America Lithium Revenue (USD Million), by Type (2023-2030)
11.5.3 South America Lithium Revenue (USD Million), by Applications (2023-2030)
11.6 Middle East and Africa Lithium Revenue (USD Million), by Type, and Applications (2023-2030)
11.6.1 Middle East and Africa Lithium Revenue (USD Million), by Region (2023-2030)
11.6.2 Middle East and Africa Lithium Revenue (USD Million), by Type (2023-2030)
11.6.3 Middle East and Africa Lithium Revenue (USD Million), by Applications (2023-2030)
12 Methodology and Data Sources
12.1 Methodology/Research Approach
12.1.1 Research Programs/Design
12.1.2 Market Size Estimation
12.1.3 Market Breakdown and Data Triangulation
12.2 Data Sources
12.2.1 Secondary Sources
12.2.2 Primary Sources
12.3 Disclaimer
List of Tables
Table 1 Market Segmentation Analysis
Table 2 Global Lithium Market Companies with Areas Served
Table 3 Products Offerings Global Lithium Market
Table 4 Low Growth Scenario Forecasts
Table 5 Reference Case Growth Scenario
Table 6 High Growth Case Scenario
Table 7 Global Lithium Revenue (USD Million) And CAGR (%) By Type (2018-2030)
Table 8 Global Lithium Revenue (USD Million) And CAGR (%) By Applications (2018-2030)
Table 9 Global Lithium Revenue (USD Million) And CAGR (%) By Regions (2018-2030)
Table 10 Global Lithium Revenue (USD Million) By Type (2018-2022)
Table 11 Global Lithium Revenue Market Share (%) By Type (2018-2022)
Table 12 Global Lithium Revenue (USD Million) By Applications (2018-2022)
Table 13 Global Lithium Revenue Market Share (%) By Applications (2018-2022)
Table 14 Global Lithium Market Revenue (USD Million) By Regions (2018-2022)
Table 15 Global Lithium Market Share (%) By Regions (2018-2022)
Table 16 North America Lithium Revenue (USD Million) By Country (2018-2022)
Table 17 North America Lithium Revenue (USD Million) By Type (2018-2022)
Table 18 North America Lithium Revenue (USD Million) By Applications (2018-2022)
Table 19 Europe Lithium Revenue (USD Million) By Country (2018-2022)
Table 20 Europe Lithium Revenue (USD Million) By Type (2018-2022)
Table 21 Europe Lithium Revenue (USD Million) By Applications (2018-2022)
Table 22 Asia Pacific Lithium Revenue (USD Million) By Country (2018-2022)
Table 23 Asia Pacific Lithium Revenue (USD Million) By Type (2018-2022)
Table 24 Asia Pacific Lithium Revenue (USD Million) By Applications (2018-2022)
Table 25 South America Lithium Revenue (USD Million) By Country (2018-2022)
Table 26 South America Lithium Revenue (USD Million) By Type (2018-2022)
Table 27 South America Lithium Revenue (USD Million) By Applications (2018-2022)
Table 28 Middle East and Africa Lithium Revenue (USD Million) By Region (2018-2022)
Table 29 Middle East and Africa Lithium Revenue (USD Million) By Type (2018-2022)
Table 30 Middle East and Africa Lithium Revenue (USD Million) By Applications (2018-2022)
Table 31 Financial Analysis
Table 32 Global Lithium Revenue (USD Million) By Type (2023-2030)
Table 33 Global Lithium Revenue Market Share (%) By Type (2023-2030)
Table 34 Global Lithium Revenue (USD Million) By Applications (2023-2030)
Table 35 Global Lithium Revenue Market Share (%) By Applications (2023-2030)
Table 36 Global Lithium Market Revenue (USD Million), And Revenue (USD Million) By Regions (2023-2030)
Table 37 North America Lithium Revenue (USD)By Country (2023-2030)
Table 38 North America Lithium Revenue (USD Million) By Type (2023-2030)
Table 39 North America Lithium Revenue (USD Million) By Applications (2023-2030)
Table 40 Europe Lithium Revenue (USD Million) By Country (2023-2030)
Table 41 Europe Lithium Revenue (USD Million) By Type (2023-2030)
Table 42 Europe Lithium Revenue (USD Million) By Applications (2023-2030)
Table 43 Asia Pacific Lithium Revenue (USD Million) By Country (2023-2030)
Table 44 Asia Pacific Lithium Revenue (USD Million) By Type (2023-2030)
Table 45 Asia Pacific Lithium Revenue (USD Million) By Applications (2023-2030)
Table 46 South America Lithium Revenue (USD Million) By Country (2023-2030)
Table 47 South America Lithium Revenue (USD Million) By Type (2023-2030)
Table 48 South America Lithium Revenue (USD Million) By Applications (2023-2030)
Table 49 Middle East and Africa Lithium Revenue (USD Million) By Region (2023-2030)
Table 50 Middle East and Africa Lithium Revenue (USD Million) By Region (2023-2030)
Table 51 Middle East and Africa Lithium Revenue (USD Million) By Type (2023-2030)
Table 52 Middle East and Africa Lithium Revenue (USD Million) By Applications (2023-2030)
Table 53 Research Programs/Design for This Report
Table 54 Key Data Information from Secondary Sources
Table 55 Key Data Information from Primary Sources
List of Figures
Figure 1 Market Scope
Figure 2 Porter’s Five Forces
Figure 3 Global Lithium Revenue (USD Million) By Type (2018-2022)
Figure 4 Global Lithium Revenue Market Share (%) By Type (2022)
Figure 5 Global Lithium Revenue (USD Million) By Applications (2018-2022)
Figure 6 Global Lithium Revenue Market Share (%) By Applications (2022)
Figure 7 Global Lithium Market Revenue (USD Million) By Regions (2018-2022)
Figure 8 Global Lithium Market Share (%) By Regions (2022)
Figure 9 North America Lithium Revenue (USD Million) By Country (2018-2022)
Figure 10 North America Lithium Revenue (USD Million) By Type (2018-2022)
Figure 11 North America Lithium Revenue (USD Million) By Applications (2018-2022)
Figure 12 Europe Lithium Revenue (USD Million) By Country (2018-2022)
Figure 13 Europe Lithium Revenue (USD Million) By Type (2018-2022)
Figure 14 Europe Lithium Revenue (USD Million) By Applications (2018-2022)
Figure 15 Asia Pacific Lithium Revenue (USD Million) By Country (2018-2022)
Figure 16 Asia Pacific Lithium Revenue (USD Million) By Type (2018-2022)
Figure 17 Asia Pacific Lithium Revenue (USD Million) By Applications (2018-2022)
Figure 18 South America Lithium Revenue (USD Million) By Country (2018-2022)
Figure 19 South America Lithium Revenue (USD Million) By Type (2018-2022)
Figure 20 South America Lithium Revenue (USD Million) By Applications (2018-2022)
Figure 21 Middle East and Africa Lithium Revenue (USD Million) By Region (2018-2022)
Figure 22 Middle East and Africa Lithium Revenue (USD Million) By Type (2018-2022)
Figure 23 Middle East and Africa Lithium Revenue (USD Million) By Applications (2018-2022)
Figure 24 Global Lithium Revenue (USD Million) By Type (2023-2030)
Figure 25 Global Lithium Revenue Market Share (%) By Type (2030)
Figure 26 Global Lithium Revenue (USD Million) By Applications (2023-2030)
Figure 27 Global Lithium Revenue Market Share (%) By Applications (2030)
Figure 28 Global Lithium Market Revenue (USD Million) By Regions (2023-2030)
Figure 29 North America Lithium Revenue (USD Million) By Country (2023-2030)
Figure 30 North America Lithium Revenue (USD Million) By Type (2023-2030)
Figure 31 North America Lithium Revenue (USD Million) By Applications (2023-2030)
Figure 32 Europe Lithium Revenue (USD Million) By Country (2023-2030)
Figure 33 Europe Lithium Revenue (USD Million) By Type (2023-2030)
Figure 34 Europe Lithium Revenue (USD Million) By Applications (2023-2030)
Figure 35 Asia Pacific Lithium Revenue (USD Million) By Country (2023-2030)
Figure 36 Asia Pacific Lithium Revenue (USD Million) By Type (2023-2030)
Figure 37 Asia Pacific Lithium Revenue (USD Million) By Applications (2023-2030)
Figure 38 South America Lithium Revenue (USD Million) By Country (2023-2030)
Figure 39 South America Lithium Revenue (USD Million) By Type (2023-2030)
Figure 40 South America Lithium Revenue (USD Million) By Applications (2023-2030)
Figure 41 Middle East and Africa Lithium Revenue (USD Million) By Region (2023-2030)
Figure 42 Middle East and Africa Lithium Revenue (USD Million) By Region (2023-2030)
Figure 43 Middle East and Africa Lithium Revenue (USD Million) By Type (2023-2030)
Figure 44 Middle East and Africa Lithium Revenue (USD Million) By Applications (2023-2030)
Figure 45 Bottom-Up and Top-Down Approaches For This Report
Figure 46 Data Triangulation
