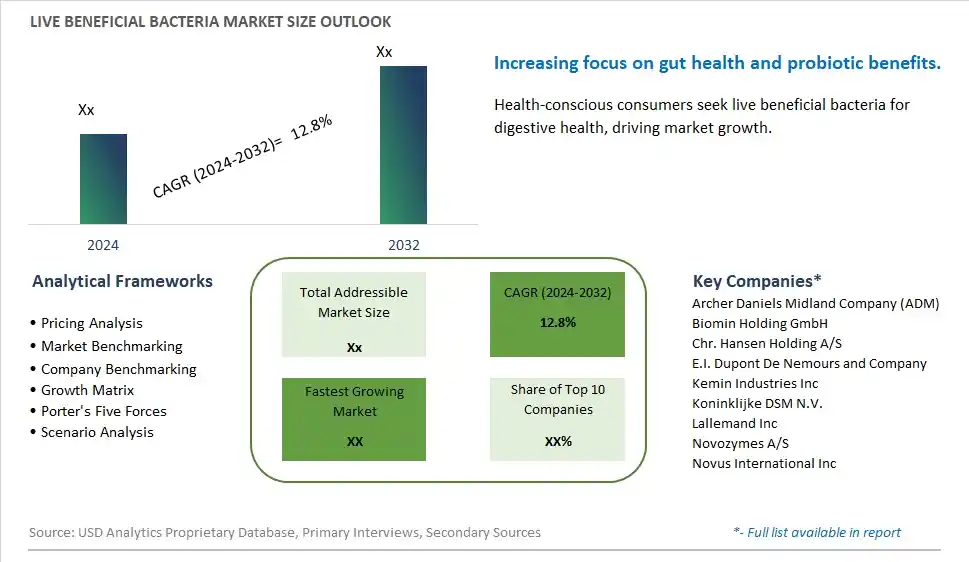
Global Live Beneficial Bacteria Market Size is valued at $XX Million in 2024 and is forecast to register a growth rate (CAGR) of 12.8% to reach $XX Million by 2032.
The global Live Beneficial Bacteria Market Comprehensive Study analyzes and forecasts the market size across 6 regions and 24 countries for diverse segments -By Type (Dry, Liquid), By Application (Poultry, Swine, Ruminants, Aquatic animals, Others)
An Introduction to Live Beneficial Bacteria Market
The live beneficial bacteria market in 2024 is expanding rapidly, fueled by the rising awareness of probiotics and their health benefits. Live beneficial bacteria, used in dietary supplements and functional foods, promote gut health, boost immunity, and support overall well-being. The market benefits from ongoing research validating the health benefits of probiotics and innovations in product formulations that enhance the stability and efficacy of live bacteria. The trend towards preventive healthcare and natural remedies is driving consumer interest, while the increasing availability of probiotic-rich products in retail and online channels is further supporting market growth.
Live Beneficial Bacteria Competitive Landscape
The market report analyses the leading companies in the industry including Archer Daniels Midland Company (ADM), Biomin Holding GmbH, Chr. Hansen Holding A/S, E.I. Dupont De Nemours and Company, Kemin Industries Inc, Koninklijke DSM N.V., Lallemand Inc, Novozymes A/S, Novus International Inc, and Others.
Live Beneficial Bacteria Market Dynamics
Live Beneficial Bacteria Market Trend: Growing Demand for Probiotics and Gut Health Products
The most prominent trend in the Live Beneficial Bacteria Market is the growing demand for probiotics and gut health products. Consumers are increasingly aware of the importance of maintaining a healthy gut microbiome for overall well-being, leading to a rise in the consumption of products containing live beneficial bacteria, such as yogurt, supplements, and functional foods.
Live Beneficial Bacteria Market Driver: Rising Health Consciousness and Preventive Healthcare
A key driver in the Live Beneficial Bacteria Market is rising health consciousness and preventive healthcare. As more people prioritize their health and seek to prevent illnesses through diet, there is a growing demand for products that offer health benefits, such as improved digestion and enhanced immunity. Probiotics are seen as a natural and effective solution, driving market growth.
Live Beneficial Bacteria Market Opportunity: Innovation in Delivery Formats and Applications
One significant opportunity in the Live Beneficial Bacteria Market lies in innovation in delivery formats and applications. Companies can develop new products that incorporate live beneficial bacteria in convenient and appealing forms, such as beverages, snack bars, and even skincare products. By expanding the range of applications, manufacturers can attract a broader consumer base and drive market growth.
Live Beneficial Bacteria Market Share Analysis: Liquid Type segment generated the highest revenue share in the industry
In the Live Beneficial Bacteria Market, the Liquid Type segment stands out as the largest category. This segment includes various formulations of beneficial bacteria suspended in liquid carriers, which are used in products like probiotic drinks, dairy products, and dietary supplements. The liquid form offers several advantages that contribute to its dominance in the market. Firstly, liquid formulations of beneficial bacteria are often more versatile and easier to incorporate into a wide range of food and beverage products compared to dry forms. They can be seamlessly blended into drinks, added to yogurts, or incorporated into health-focused juices, catering to consumer preferences for convenient and functional foods. Further, liquid probiotics are perceived to have higher viability and stability due to the protective environment provided by the liquid carrier, which helps maintain the bacteria's effectiveness until consumption. This perceived efficacy boosts consumer confidence and drives demand in health-conscious markets. Further, the liquid segment benefits from ongoing innovations in formulation technologies, allowing manufacturers to develop products with enhanced taste profiles and extended shelf life, further supporting its market dominance and growth trajectory in the live beneficial bacteria sector.
Live Beneficial Bacteria Market Share Analysis: Poultry Application is the fastest growing segment over the forecast period to 2032
Among the segments in the Live Beneficial Bacteria Market, the Poultry Application is projected to experience the fastest growth leading up to 2032. This growth is driven by several factors shaping the poultry industry globally. Poultry farming faces increasing pressure to improve efficiency, productivity, and animal health while reducing the reliance on antibiotics. Live beneficial bacteria, such as probiotics, offer a natural alternative to antibiotics by promoting gut health and enhancing immune function in poultry. They help to maintain a balanced intestinal microbiota, which is crucial for optimizing nutrient absorption and supporting overall bird health. Additionally, probiotics in poultry feed have shown potential in reducing incidences of digestive disorders and improving feed conversion ratios, thereby lowering production costs and environmental impacts. The rapid adoption of probiotics in poultry production is also influenced by shifting consumer preferences towards antibiotic-free poultry products and the tightening regulatory scrutiny over antibiotic use in livestock farming. As a result, poultry producers are increasingly integrating probiotics into feed formulations to meet these evolving market demands and regulatory standards. This trend is expected to drive significant growth in the poultry application segment of the Live Beneficial Bacteria Market as poultry producers seek sustainable and effective solutions to enhance animal health and meet consumer expectations for safer and healthier food products.
Live Beneficial Bacteria Market Segmentation
By Type
Dry
Liquid
By Application
Poultry
Swine
Ruminants
Aquatic animals
Others
Countries Analyzed
North America (US, Canada, Mexico)
Europe (Germany, UK, France, Spain, Italy, Russia, Rest of Europe)
Asia Pacific (China, India, Japan, South Korea, Australia, South East Asia, Rest of Asia)
South America (Brazil, Argentina, Rest of South America)
Middle East and Africa (Saudi Arabia, UAE, Rest of Middle East, South Africa, Egypt, Rest of Africa)
Live Beneficial Bacteria Companies Profiled in the Study
Archer Daniels Midland Company (ADM)
Biomin Holding GmbH
Chr. Hansen Holding A/S
E.I. Dupont De Nemours and Company
Kemin Industries Inc
Koninklijke DSM N.V.
Lallemand Inc
Novozymes A/S
Novus International Inc
*- List Not Exhaustive
Chapter 1. TABLE OF CONTENTS
Chapter 2. Introduction to Live Beneficial Bacteria Market
2.1. Market Overview
2.2. Key Statistics and Report Highlights
2.3. Scope of the Comprehensive Study
2.3.1. Market Definition
2.3.2 Countries and Regions Covered
2.3.3 Research Objective
2.3.4 Units, Currency, and Conversions
2.3.5 Industry Value Chain
2.4. Key Market Segments
2.5. Key Companies
2.6. Study Period
Chapter 3. Strategic Analysis Review
3.1. Live Beneficial Bacteria Pricing Analysis and Forecast
3.2. Porter’s Five Forces
3.3. Market Ecosystem
3.4. SWOT Analysis
3.5. Regulatory Scenario
3.3. Effects of Inflation, Russia-Ukraine War, moderating economic growth, and other macroeconomic factors
Chapter 4. Competitive Landscape
4.1. Market Share Analysis
4.1.1. Global Live Beneficial Bacteria Market Share by Company, 2023
4.1.2. Product Offerings of Leading Live Beneficial Bacteria Companies
4.2. Market Entropy
4.2.1. New Product Launches in the Industry
4.2.2. Mergers, Acquisitions, Joint ventures, and Partnerships
4.3. Key Strategies and Best Practices
Chapter 5. Global Market Projections: Best, Reference, and Low Case Scenarios
5.1. Growth Analysis- Case Scenario Definitions
5.2. Low Growth Case Scenario Forecasts
5.3. Reference Growth Case Scenario Forecasts
5.4. High Growth Case Scenario Forecasts
Chapter 6. Market Dynamics
6.1. Live Beneficial Bacteria Market Drivers
6.2. Live Beneficial Bacteria Market Challenges
6.6. Live Beneficial Bacteria Market Opportunities
6.4. Live Beneficial Bacteria Market Trends
Chapter 7. Global Live Beneficial Bacteria Market Outlook Trends
7.1. Global Live Beneficial Bacteria Revenue (USD Million) and CAGR (%) by Type (2021-2032)
7.2. Global Live Beneficial Bacteria Revenue (USD Million) and CAGR (%) by Application (2021-2032)
7.3. Global Live Beneficial Bacteria Revenue (USD Million) and CAGR (%) by Product (2021-2032)
By Type
Dry
Liquid
By Application
Poultry
Swine
Ruminants
Aquatic animals
Others
Chapter 8. Global Live Beneficial Bacteria Regional Analysis and Outlook
8.1. Global Live Beneficial Bacteria Revenue (USD Million) By Regions (2021- 2032)
8.2. North America Live Beneficial Bacteria Revenue (USD Million) by Country (2021-2032)
8.2.1. United States Live Beneficial Bacteria Regional Analysis and Outlook
8.2.2. Canada Live Beneficial Bacteria Regional Analysis and Outlook
8.2.3. Mexico Live Beneficial Bacteria Regional Analysis and Outlook
8.3. Europe Live Beneficial Bacteria Revenue (USD Million), by Country (2021-2032)
8.3.1. Germany Live Beneficial Bacteria Regional Analysis and Outlook
8.3.2. France Live Beneficial Bacteria Regional Analysis and Outlook
8.3.3. United Kingdom Live Beneficial Bacteria Regional Analysis and Outlook
8.3.4. Spain Live Beneficial Bacteria Regional Analysis and Outlook
8.3.5. Italy Live Beneficial Bacteria Regional Analysis and Outlook
8.3.6. Russia Live Beneficial Bacteria Regional Analysis and Outlook
8.3.7. Rest of Europe Live Beneficial Bacteria Regional Analysis and Outlook
8.4. Asia Pacific Live Beneficial Bacteria Revenue (USD Million) by Country (2021-2032)
8.4.1. China Live Beneficial Bacteria Regional Analysis and Outlook
8.4.2. Japan Live Beneficial Bacteria Regional Analysis and Outlook
8.4.3. India Live Beneficial Bacteria Regional Analysis and Outlook
8.4.4. South Korea Live Beneficial Bacteria Regional Analysis and Outlook
8.4.5. Australia Live Beneficial Bacteria Regional Analysis and Outlook
8.4.6. South East Asia Live Beneficial Bacteria Regional Analysis and Outlook
8.4.7. Rest of Asia Pacific Live Beneficial Bacteria Regional Analysis and Outlook
8.5. South America Live Beneficial Bacteria Revenue (USD Million), by Country (2021-2032)
8.5.1. Brazil Live Beneficial Bacteria Regional Analysis and Outlook
8.5.2. Argentina Live Beneficial Bacteria Regional Analysis and Outlook
8.5.3. Rest of South America Live Beneficial Bacteria Regional Analysis and Outlook
8.6. Middle East and Africa Live Beneficial Bacteria Revenue (USD Million) by Country (2021-2032)
8.6.1. Middle East Live Beneficial Bacteria Regional Analysis and Outlook
8.6.2. Africa Live Beneficial Bacteria Regional Analysis and Outlook
Chapter 9. North America Live Beneficial Bacteria Analysis and Outlook
9.1. North America Live Beneficial Bacteria Revenue (USD Million) by Segments (2021-2032)
9.1.1. North America Live Beneficial Bacteria Revenue (USD Million) by Type (2021-2032)
9.1.2. North America Live Beneficial Bacteria Revenue (USD Million) by Application (2021-2032)
9.1.3. North America Live Beneficial Bacteria Revenue (USD Million) by Product (2021-2032)
By Type
Dry
Liquid
By Application
Poultry
Swine
Ruminants
Aquatic animals
Others
Chapter 10. Europe Live Beneficial Bacteria Analysis and Outlook
10.1. Europe Live Beneficial Bacteria Revenue (USD Million), by Segments (USD Million) (2021-2032)
10.1.1. Europe Live Beneficial Bacteria Revenue (USD Million) by Type (2021-2032)
10.1.2. Europe Live Beneficial Bacteria Revenue (USD Million) by Application (2021-2032)
10.1.3. Europe Live Beneficial Bacteria Revenue (USD Million) by Product (2021-2032)
By Type
Dry
Liquid
By Application
Poultry
Swine
Ruminants
Aquatic animals
Others
Chapter 11. Asia Pacific Live Beneficial Bacteria Analysis and Outlook
11.1. Asia Pacific Live Beneficial Bacteria Revenue (USD Million), and Revenue (USD Million) by Segments (2021-2032)
11.1.1. Asia Pacific Live Beneficial Bacteria Revenue (USD Million) by Type (2021-2032)
11.1.2. Asia Pacific Live Beneficial Bacteria Revenue (USD Million) by Application (2021-2032)
11.1.3. Asia Pacific Live Beneficial Bacteria Revenue (USD Million) by Product (2021-2032)
By Type
Dry
Liquid
By Application
Poultry
Swine
Ruminants
Aquatic animals
Others
Chapter 12. South America Live Beneficial Bacteria Analysis and Outlook
12.1. South America Live Beneficial Bacteria Revenue (USD Million), by Segments (2021-2032)
12.1.1. South America Live Beneficial Bacteria Revenue (USD Million) by Type (2021-2032)
12.1.2. South America Live Beneficial Bacteria Revenue (USD Million) by Application (2021-2032)
12.1.3. South America Live Beneficial Bacteria Revenue (USD Million) by Product (2021-2032)
By Type
Dry
Liquid
By Application
Poultry
Swine
Ruminants
Aquatic animals
Others
Chapter 13. Middle East and Africa Live Beneficial Bacteria Analysis and Outlook
13.1. Middle East and Africa Live Beneficial Bacteria Revenue (USD Million), by Segments (2021-2032)
13.1.1. Middle East and Africa Live Beneficial Bacteria Revenue (USD Million) by Type (2021-2032)
13.1.2. Middle East and Africa Live Beneficial Bacteria Revenue (USD Million) by Application (2021-2032)
13.1.3. Middle East and Africa Live Beneficial Bacteria Revenue (USD Million) by Product (2021-2032)
By Type
Dry
Liquid
By Application
Poultry
Swine
Ruminants
Aquatic animals
Others
Chapter 14. Live Beneficial Bacteria Company Profiles
14.1 Business Overview
14.2 Product Profiles
14.3 SWOT Profiles
14.5 Recent Developments
14.6 Financial Profile
List of Companies
Archer Daniels Midland Company (ADM)
Biomin Holding GmbH
Chr. Hansen Holding A/S
E.I. Dupont De Nemours and Company
Kemin Industries Inc
Koninklijke DSM N.V.
Lallemand Inc
Novozymes A/S
Novus International Inc
15. Methodology and Data Sources
15.1 Customization Offerings
15.2 Subscription Services
15.3 Related Reports
15.4 Publisher Expertise
LIST OF TABLES
Table 1 Market Segmentation Analysis
Table 2 Global Live Beneficial Bacteria Market Share of Leading Companies, 2023
Table 3 Product Offerings of Leading Companies
Table 4 Low Growth Scenario Forecasts
Table 5 Reference Case Growth Scenario
Table 6 High Growth Case Scenario
Table 7 Global Live Beneficial Bacteria Revenue (USD Million) And CAGR (%) By Type (2021-2032)
Table 8 Global Live Beneficial Bacteria Revenue (USD Million) And CAGR (%) By Application (2021-2032)
Table 9 Global Live Beneficial Bacteria Revenue (USD Million) And CAGR (%) By Product (2021-2032)
Table 10 Global Live Beneficial Bacteria Market Revenue (USD Million) By Regions (2021-2032)
Table 11 Global Live Beneficial Bacteria Market Share (%) By Regions (2021-2032)
Table 12 North America Live Beneficial Bacteria Revenue (USD Million) By Country (2021-2032)
Table 13 Europe Live Beneficial Bacteria Revenue (USD Million) By Country (2021-2032)
Table 14 Asia Pacific Live Beneficial Bacteria Revenue (USD Million) By Country (2021-2032)
Table 15 South America Live Beneficial Bacteria Revenue (USD Million) By Country (2021-2032)
Table 16 Middle East and Africa Live Beneficial Bacteria Revenue (USD Million) By Region (2021-2032)
Table 17 North America Live Beneficial Bacteria Revenue (USD Million) By Type (2021-2032)
Table 18 North America Live Beneficial Bacteria Revenue (USD Million) By Application (2021-2032)
Table 19 North America Live Beneficial Bacteria Revenue (USD Million) By Product (2021-2032)
Table 20 Europe Live Beneficial Bacteria Revenue (USD Million) By Type (2021-2032)
Table 21 Europe Live Beneficial Bacteria Revenue (USD Million) By Application (2021-2032)
Table 22 Europe Live Beneficial Bacteria Revenue (USD Million) By Product (2021-2032)
Table 23 Asia Pacific Live Beneficial Bacteria Revenue (USD Million) By Type (2021-2032)
Table 24 Asia Pacific Live Beneficial Bacteria Revenue (USD Million) By Application (2021-2032)
Table 25 Asia Pacific Live Beneficial Bacteria Revenue (USD Million) By Product (2021-2032)
Table 26 South America Live Beneficial Bacteria Revenue (USD Million) By Type (2021-2032)
Table 27 South America Live Beneficial Bacteria Revenue (USD Million) By Application (2021-2032)
Table 28 South America Live Beneficial Bacteria Revenue (USD Million) By Product (2021-2032)
Table 29 Middle East and Africa Live Beneficial Bacteria Revenue (USD Million) By Type (2021-2032)
Table 30 Middle East and Africa Live Beneficial Bacteria Revenue (USD Million) By Application (2021-2032)
Table 31 Middle East and Africa Live Beneficial Bacteria Revenue (USD Million) By Product (2021-2032)
LIST OF FIGURES
Figure 1. Market Scope
Figure 2. Pricing Forecasts Per Unit, 2023- 2032
Figure 3. Porter’s Five Forces
Figure 4. Global Live Beneficial Bacteria Market Revenue (USD Million) By Regions (2021-2032)
Figure 5. Global Live Beneficial Bacteria Market Share (%) By Regions (2023)
Figure 6. North America Live Beneficial Bacteria Revenue (USD Million) By Country (2021-2032)
Figure 7. United States Live Beneficial Bacteria Revenue (USD Million) By Country (2021-2032)
Figure 8. Canada Live Beneficial Bacteria Revenue (USD Million) By Country (2021-2032)
Figure 9. Mexico Live Beneficial Bacteria Revenue (USD Million) By Country (2021-2032)
Figure 10. Europe Live Beneficial Bacteria Revenue (USD Million) By Country (2021-2032)
Figure 11. Germany Live Beneficial Bacteria Revenue (USD Million) By Country (2021-2032)
Figure 12. France Live Beneficial Bacteria Revenue (USD Million) By Country (2021-2032)
Figure 13. United Kingdom Live Beneficial Bacteria Revenue (USD Million) By Country (2021-2032)
Figure 14. Spain Live Beneficial Bacteria Revenue (USD Million) By Country (2021-2032)
Figure 15. Italy Live Beneficial Bacteria Revenue (USD Million) By Country (2021-2032)
Figure 16. Russia Live Beneficial Bacteria Revenue (USD Million) By Country (2021-2032)
Figure 17. Rest of Europe Live Beneficial Bacteria Revenue (USD Million) By Country (2021-2032)
Figure 11. Asia Pacific Live Beneficial Bacteria Revenue (USD Million) By Country (2021-2032)
Figure 12. China Live Beneficial Bacteria Revenue (USD Million) By Country (2021-2032)
Figure 13. Japan Live Beneficial Bacteria Revenue (USD Million) By Country (2021-2032)
Figure 14. India Live Beneficial Bacteria Revenue (USD Million) By Country (2021-2032)
Figure 15. South Korea Live Beneficial Bacteria Revenue (USD Million) By Country (2021-2032)
Figure 16. Australia Live Beneficial Bacteria Revenue (USD Million) By Country (2021-2032)
Figure 17. South East Asia Live Beneficial Bacteria Revenue (USD Million) By Country (2021-2032)
Figure 18. South America Live Beneficial Bacteria Revenue (USD Million) By Country (2021-2032)
Figure 19. Brazil Live Beneficial Bacteria Revenue (USD Million) By Country (2021-2032)
Figure 20. Argentina Live Beneficial Bacteria Revenue (USD Million) By Country (2021-2032)
Figure 21. Rest of Asia Pacific Live Beneficial Bacteria Revenue (USD Million) By Country (2021-2032)
Figure 22. Middle East and Africa Live Beneficial Bacteria Revenue (USD Million) By Region (2021-2032)
Figure 23. Saudi Arabia Live Beneficial Bacteria Revenue (USD Million) By Region (2021-2032)
Figure 24. The UAE Live Beneficial Bacteria Revenue (USD Million) By Region (2021-2032)
Figure 25. Rest of Middle East Live Beneficial Bacteria Revenue (USD Million) By Region (2021-2032)
Figure 26. South Africa Live Beneficial Bacteria Revenue (USD Million) By Region (2021-2032)
Figure 27. Africa Live Beneficial Bacteria Revenue (USD Million) By Region (2021-2032)
Figure 28. North America Live Beneficial Bacteria Revenue (USD Million) By Type (2021-2032)
Figure 29. North America Live Beneficial Bacteria Revenue (USD Million) By Application (2021-2032)
Figure 30. North America Live Beneficial Bacteria Revenue (USD Million) By Product (2021-2032)
Figure 31. Europe Live Beneficial Bacteria Revenue (USD Million) By Type (2021-2032)
Figure 32. Europe Live Beneficial Bacteria Revenue (USD Million) By Application (2021-2032)
Figure 33. Europe Live Beneficial Bacteria Revenue (USD Million) By Product (2021-2032)
Figure 34. Asia Pacific Live Beneficial Bacteria Revenue (USD Million) By Type (2021-2032)
Figure 35. Asia Pacific Live Beneficial Bacteria Revenue (USD Million) By Application (2021-2032)
Figure 36. Asia Pacific Live Beneficial Bacteria Revenue (USD Million) By Product (2021-2032)
Figure 37. South America Live Beneficial Bacteria Revenue (USD Million) By Type (2021-2032)
Figure 38. South America Live Beneficial Bacteria Revenue (USD Million) By Application (2021-2032)
Figure 39. South America Live Beneficial Bacteria Revenue (USD Million) By Product (2021-2032)
Figure 40. Middle East and Africa Live Beneficial Bacteria Revenue (USD Million) By Type (2021-2032)
Figure 41. Middle East and Africa Live Beneficial Bacteria Revenue (USD Million) By Application (2021-2032)
Figure 42. Middle East and Africa Live Beneficial Bacteria Revenue (USD Million) By Product (2021-2032)
By Type
Dry
Liquid
By Application
Poultry
Swine
Ruminants
Aquatic animals
Others
Countries Analyzed
North America (US, Canada, Mexico)
Europe (Germany, UK, France, Spain, Italy, Russia, Rest of Europe)
Asia Pacific (China, India, Japan, South Korea, Australia, South East Asia, Rest of Asia)
South America (Brazil, Argentina, Rest of South America)
Middle East and Africa (Saudi Arabia, UAE, Rest of Middle East, South Africa, Egypt, Rest of Africa)
