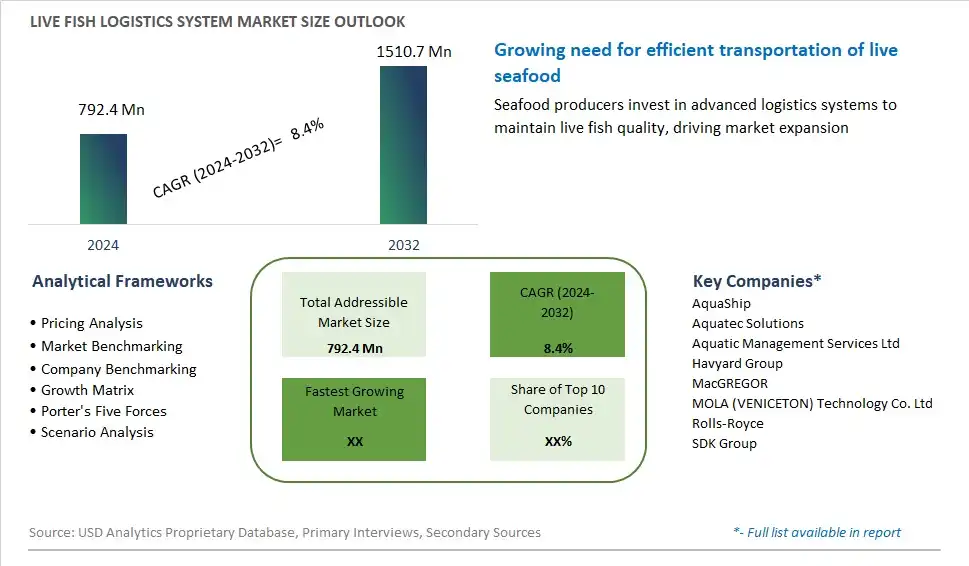
Global Live Fish Logistics System Market Size is valued at $792.4 Million in 2024 and is forecast to register a growth rate (CAGR) of 8.4% to reach $1510.7 Million by 2032.
The global Live Fish Logistics System Market Comprehensive Study analyzes and forecasts the market size across 6 regions and 24 countries for diverse segments -By Product (Finfish, Shellfish, Crustaceans), By End-User (Wholesale Distributors, Retailers, Restaurants and Catering Services, Aquaculture Farms, Seafood Processors), By Species (Salmon, Tilapia, Trout, Shrimp, Lobster)
An Introduction to Live Fish Logistics System Market
The live fish logistics system market in 2024 is witnessing substantial growth, driven by the increasing demand for fresh and live seafood in the foodservice and retail sectors. Live fish logistics systems, which include specialized transportation, storage, and handling solutions, ensure the safe and humane transport of live fish from aquaculture farms to markets and restaurants. The market benefits from the growing consumer preference for fresh and high-quality seafood, as well as the expansion of the aquaculture industry. Innovations in logistics technology, including advanced water quality monitoring, temperature control, and oxygenation systems, have improved the efficiency and reliability of live fish transportation. Additionally, the emphasis on sustainability and animal welfare supports the adoption of advanced logistics systems. As the demand for fresh seafood continues to rise, the live fish logistics system market is set to grow robustly.
Live Fish Logistics System Competitive Landscape
The market report analyses the leading companies in the industry including AquaShip, Aquatec Solutions, Aquatic Management Services Ltd, Havyard Group, MacGREGOR, MOLA (VENICETON) Technology Co. Ltd, Rolls-Royce, SDK Group, and Others.
Live Fish Logistics System Market Dynamics
Live Fish Logistics System Market Trend: Growing Demand for Fresh and Sustainable Seafood
A prominent trend in the live fish logistics system market is the growing demand for fresh and sustainable seafood. As consumers become more conscious of the environmental impact of their food choices and seek healthier and more ethically sourced protein options, there's a rising preference for live fish products that are harvested sustainably and delivered fresh to market. This trend is driven by factors such as increasing awareness of overfishing and habitat destruction, the desire for traceable and transparent food supply chains, and the recognition of the nutritional benefits of consuming fresh seafood. Consumers are willing to pay a premium for live fish that are transported and stored in optimal conditions to ensure freshness, taste, and quality. As a result, there's a growing need for efficient and reliable live fish logistics systems that can maintain the health and vitality of fish during transportation from farm to market.
Market Driver: Globalization of Seafood Supply Chains
An essential driver fueling the live fish logistics system market is the globalization of seafood supply chains driven by the expansion of international trade and the growing demand for seafood products worldwide. As the global population continues to grow, urbanize, and adopt more diverse diets, the demand for seafood, particularly from emerging markets, is increasing. This driver is reinforced by factors such as improvements in transportation infrastructure and technology, trade liberalization policies, and the rise of e-commerce platforms that facilitate cross-border seafood trade. Seafood producers and suppliers are seeking to capitalize on market opportunities by expanding their reach to new markets and delivering live fish products to consumers around the world. As a result, there's a growing need for efficient and cost-effective logistics systems that can ensure the safe and timely transport of live fish across long distances and international borders, while maintaining product quality and compliance with regulatory requirements.
Market Opportunity: Integration of IoT and Data Analytics
A significant opportunity within the live fish logistics system market lies in the integration of Internet of Things (IoT) technologies and data analytics to optimize supply chain operations and enhance fish welfare and product quality. By leveraging IoT sensors and devices, logistics companies can monitor crucial parameters such as water temperature, oxygen levels, pH levels, and stress indicators in real-time during transit. This real-time data can be analyzed to identify potential issues or deviations from optimal conditions and trigger proactive interventions to mitigate risks and ensure the well-being of live fish. Additionally, data analytics techniques such as predictive modeling and machine learning algorithms can be applied to historical and real-time data to optimize route planning, minimize transit times, and reduce transportation costs while maximizing the freshness and quality of live fish products. By embracing IoT and data analytics solutions, logistics providers can offer value-added services that differentiate their offerings, improve operational efficiency, and meet the evolving needs of seafood producers, suppliers, and consumers. As technology continues to advance and seafood supply chains become increasingly complex and globalized, the integration of IoT and data analytics in live fish logistics systems presents significant opportunities for innovation, differentiation, and market leadership within the seafood industry.
Live Fish Logistics System Market Share Analysis: Finfish held the dominant market share in 2024
The finfish segment is the largest segment in the live fish logistics system market due to several factors contributing to its widespread demand and consumption worldwide. Finfish, including salmon, trout, tilapia, and cod, are among the most popular and widely consumed seafood products globally, valued for their nutritional benefits, versatility in culinary applications, and appealing taste profiles. The demand for live finfish is particularly high in regions with a strong seafood culture and preference for fresh, high-quality products. Live fish logistics systems play a crucial role in maintaining the quality and freshness of finfish during transportation from aquaculture farms or fishing vessels to markets or processing facilities. Additionally, technological advancements in live fish logistics systems, such as oxygenation systems, temperature control, and water filtration, ensure optimal conditions for the safe and efficient transport of live finfish, meeting the stringent quality and regulatory standards of the seafood industry. With the growing consumer demand for fresh and sustainably sourced seafood products, the finfish segment dominates the live fish logistics system market, driving market growth and innovation in seafood transportation technologies.
Live Fish Logistics System Market Share Analysis: Aquaculture Farms market is poised to register the fastest growth rae over the forecast period to 2032
The aquaculture farms segment is the fastest-growing segment in the live fish logistics system market, propelled by the increasing demand for sustainable and high-quality seafood products worldwide. Aquaculture has become a significant source of seafood production, accounting for a substantial portion of the global fish supply. As aquaculture farms strive to meet the growing consumer demand for fresh and diverse fish species, efficient and reliable logistics systems become paramount to ensure the safe and timely transportation of live fish from farms to markets or processing facilities. Additionally, advancements in aquaculture practices and technologies have led to the expansion of aquaculture operations, resulting in higher production volumes and the need for more sophisticated logistics solutions to manage the increased throughput. With aquaculture farms playing a pivotal role in the supply chain of live fish, the demand for specialized logistics systems tailored to their unique requirements drives the rapid growth of the aquaculture farms segment in the live fish logistics system market, presenting new opportunities for logistics providers and technology innovators to support the sustainable growth of the aquaculture industry.
Live Fish Logistics System Market Share Analysis: Salmon held the dominant market share in 2024
The salmon segment is the largest segment in the live fish logistics system market due to several factors contributing to its widespread consumption and demand globally. Salmon is one of the most popular and highly valued seafood species, prized for its rich flavor, nutritional benefits, and versatile culinary applications. As a result, the demand for live salmon remains consistently high in both domestic and international markets, driving the need for efficient and reliable logistics systems to transport live fish from aquaculture farms to retailers, restaurants, and processing facilities. Further, salmon farming operations are well-established in various regions worldwide, including Norway, Chile, and Scotland, contributing to the significant production and export volumes of live salmon. With its prominent position in the seafood industry and continuous demand growth, the salmon segment dominates the live fish logistics system market, driving market expansion and innovation in fish transportation technologies and logistics solutions.
Live Fish Logistics System Market Segmentation
By Product
Finfish
Shellfish
Crustaceans
By End-User
Wholesale Distributors
Retailers
Restaurants and Catering Services
Aquaculture Farms
Seafood Processors
By Species
Salmon
Tilapia
Trout
Shrimp
Lobster
Countries Analyzed
North America (US, Canada, Mexico)
Europe (Germany, UK, France, Spain, Italy, Russia, Rest of Europe)
Asia Pacific (China, India, Japan, South Korea, Australia, South East Asia, Rest of Asia)
South America (Brazil, Argentina, Rest of South America)
Middle East and Africa (Saudi Arabia, UAE, Rest of Middle East, South Africa, Egypt, Rest of Africa)
Live Fish Logistics System Companies Profiled in the Study
AquaShip
Aquatec Solutions
Aquatic Management Services Ltd
Havyard Group
MacGREGOR
MOLA (VENICETON) Technology Co. Ltd
Rolls-Royce
SDK Group
*- List Not Exhaustive
Chapter 1. TABLE OF CONTENTS
Chapter 2. Introduction to Live Fish Logistics System Market
2.1. Market Overview
2.2. Key Statistics and Report Highlights
2.3. Scope of the Comprehensive Study
2.3.1. Market Definition
2.3.2 Countries and Regions Covered
2.3.3 Research Objective
2.3.4 Units, Currency, and Conversions
2.3.5 Industry Value Chain
2.4. Key Market Segments
2.5. Key Companies
2.6. Study Period
Chapter 3. Strategic Analysis Review
3.1. Live Fish Logistics System Pricing Analysis and Forecast
3.2. Porter’s Five Forces
3.3. Market Ecosystem
3.4. SWOT Analysis
3.5. Regulatory Scenario
3.3. Effects of Inflation, Russia-Ukraine War, moderating economic growth, and other macroeconomic factors
Chapter 4. Competitive Landscape
4.1. Market Share Analysis
4.1.1. Global Live Fish Logistics System Market Share by Company, 2023
4.1.2. Product Offerings of Leading Live Fish Logistics System Companies
4.2. Market Entropy
4.2.1. New Product Launches in the Industry
4.2.2. Mergers, Acquisitions, Joint ventures, and Partnerships
4.3. Key Strategies and Best Practices
Chapter 5. Global Market Projections: Best, Reference, and Low Case Scenarios
5.1. Growth Analysis- Case Scenario Definitions
5.2. Low Growth Case Scenario Forecasts
5.3. Reference Growth Case Scenario Forecasts
5.4. High Growth Case Scenario Forecasts
Chapter 6. Market Dynamics
6.1. Live Fish Logistics System Market Drivers
6.2. Live Fish Logistics System Market Challenges
6.6. Live Fish Logistics System Market Opportunities
6.4. Live Fish Logistics System Market Trends
Chapter 7. Global Live Fish Logistics System Market Outlook Trends
7.1. Global Live Fish Logistics System Revenue (USD Million) and CAGR (%) by Type (2021-2032)
7.2. Global Live Fish Logistics System Revenue (USD Million) and CAGR (%) by Application (2021-2032)
7.3. Global Live Fish Logistics System Revenue (USD Million) and CAGR (%) by Product (2021-2032)
By Product
Finfish
Shellfish
Crustaceans
By End-User
Wholesale Distributors
Retailers
Restaurants and Catering Services
Aquaculture Farms
Seafood Processors
By Species
Salmon
Tilapia
Trout
Shrimp
Lobster
Chapter 8. Global Live Fish Logistics System Regional Analysis and Outlook
8.1. Global Live Fish Logistics System Revenue (USD Million) By Regions (2021- 2032)
8.2. North America Live Fish Logistics System Revenue (USD Million) by Country (2021-2032)
8.2.1. United States Live Fish Logistics System Regional Analysis and Outlook
8.2.2. Canada Live Fish Logistics System Regional Analysis and Outlook
8.2.3. Mexico Live Fish Logistics System Regional Analysis and Outlook
8.3. Europe Live Fish Logistics System Revenue (USD Million), by Country (2021-2032)
8.3.1. Germany Live Fish Logistics System Regional Analysis and Outlook
8.3.2. France Live Fish Logistics System Regional Analysis and Outlook
8.3.3. United Kingdom Live Fish Logistics System Regional Analysis and Outlook
8.3.4. Spain Live Fish Logistics System Regional Analysis and Outlook
8.3.5. Italy Live Fish Logistics System Regional Analysis and Outlook
8.3.6. Russia Live Fish Logistics System Regional Analysis and Outlook
8.3.7. Rest of Europe Live Fish Logistics System Regional Analysis and Outlook
8.4. Asia Pacific Live Fish Logistics System Revenue (USD Million) by Country (2021-2032)
8.4.1. China Live Fish Logistics System Regional Analysis and Outlook
8.4.2. Japan Live Fish Logistics System Regional Analysis and Outlook
8.4.3. India Live Fish Logistics System Regional Analysis and Outlook
8.4.4. South Korea Live Fish Logistics System Regional Analysis and Outlook
8.4.5. Australia Live Fish Logistics System Regional Analysis and Outlook
8.4.6. South East Asia Live Fish Logistics System Regional Analysis and Outlook
8.4.7. Rest of Asia Pacific Live Fish Logistics System Regional Analysis and Outlook
8.5. South America Live Fish Logistics System Revenue (USD Million), by Country (2021-2032)
8.5.1. Brazil Live Fish Logistics System Regional Analysis and Outlook
8.5.2. Argentina Live Fish Logistics System Regional Analysis and Outlook
8.5.3. Rest of South America Live Fish Logistics System Regional Analysis and Outlook
8.6. Middle East and Africa Live Fish Logistics System Revenue (USD Million) by Country (2021-2032)
8.6.1. Middle East Live Fish Logistics System Regional Analysis and Outlook
8.6.2. Africa Live Fish Logistics System Regional Analysis and Outlook
Chapter 9. North America Live Fish Logistics System Analysis and Outlook
9.1. North America Live Fish Logistics System Revenue (USD Million) by Segments (2021-2032)
9.1.1. North America Live Fish Logistics System Revenue (USD Million) by Type (2021-2032)
9.1.2. North America Live Fish Logistics System Revenue (USD Million) by Application (2021-2032)
9.1.3. North America Live Fish Logistics System Revenue (USD Million) by Product (2021-2032)
By Product
Finfish
Shellfish
Crustaceans
By End-User
Wholesale Distributors
Retailers
Restaurants and Catering Services
Aquaculture Farms
Seafood Processors
By Species
Salmon
Tilapia
Trout
Shrimp
Lobster
Chapter 10. Europe Live Fish Logistics System Analysis and Outlook
10.1. Europe Live Fish Logistics System Revenue (USD Million), by Segments (USD Million) (2021-2032)
10.1.1. Europe Live Fish Logistics System Revenue (USD Million) by Type (2021-2032)
10.1.2. Europe Live Fish Logistics System Revenue (USD Million) by Application (2021-2032)
10.1.3. Europe Live Fish Logistics System Revenue (USD Million) by Product (2021-2032)
By Product
Finfish
Shellfish
Crustaceans
By End-User
Wholesale Distributors
Retailers
Restaurants and Catering Services
Aquaculture Farms
Seafood Processors
By Species
Salmon
Tilapia
Trout
Shrimp
Lobster
Chapter 11. Asia Pacific Live Fish Logistics System Analysis and Outlook
11.1. Asia Pacific Live Fish Logistics System Revenue (USD Million), and Revenue (USD Million) by Segments (2021-2032)
11.1.1. Asia Pacific Live Fish Logistics System Revenue (USD Million) by Type (2021-2032)
11.1.2. Asia Pacific Live Fish Logistics System Revenue (USD Million) by Application (2021-2032)
11.1.3. Asia Pacific Live Fish Logistics System Revenue (USD Million) by Product (2021-2032)
By Product
Finfish
Shellfish
Crustaceans
By End-User
Wholesale Distributors
Retailers
Restaurants and Catering Services
Aquaculture Farms
Seafood Processors
By Species
Salmon
Tilapia
Trout
Shrimp
Lobster
Chapter 12. South America Live Fish Logistics System Analysis and Outlook
12.1. South America Live Fish Logistics System Revenue (USD Million), by Segments (2021-2032)
12.1.1. South America Live Fish Logistics System Revenue (USD Million) by Type (2021-2032)
12.1.2. South America Live Fish Logistics System Revenue (USD Million) by Application (2021-2032)
12.1.3. South America Live Fish Logistics System Revenue (USD Million) by Product (2021-2032)
By Product
Finfish
Shellfish
Crustaceans
By End-User
Wholesale Distributors
Retailers
Restaurants and Catering Services
Aquaculture Farms
Seafood Processors
By Species
Salmon
Tilapia
Trout
Shrimp
Lobster
Chapter 13. Middle East and Africa Live Fish Logistics System Analysis and Outlook
13.1. Middle East and Africa Live Fish Logistics System Revenue (USD Million), by Segments (2021-2032)
13.1.1. Middle East and Africa Live Fish Logistics System Revenue (USD Million) by Type (2021-2032)
13.1.2. Middle East and Africa Live Fish Logistics System Revenue (USD Million) by Application (2021-2032)
13.1.3. Middle East and Africa Live Fish Logistics System Revenue (USD Million) by Product (2021-2032)
By Product
Finfish
Shellfish
Crustaceans
By End-User
Wholesale Distributors
Retailers
Restaurants and Catering Services
Aquaculture Farms
Seafood Processors
By Species
Salmon
Tilapia
Trout
Shrimp
Lobster
Chapter 14. Live Fish Logistics System Company Profiles
14.1 Business Overview
14.2 Product Profiles
14.3 SWOT Profiles
14.5 Recent Developments
14.6 Financial Profile
List of Companies
AquaShip
Aquatec Solutions
Aquatic Management Services Ltd
Havyard Group
MacGREGOR
MOLA (VENICETON) Technology Co. Ltd
Rolls-Royce
SDK Group
15. Methodology and Data Sources
15.1 Customization Offerings
15.2 Subscription Services
15.3 Related Reports
15.4 Publisher Expertise
LIST OF TABLES
Table 1 Market Segmentation Analysis
Table 2 Global Live Fish Logistics System Market Share of Leading Companies, 2023
Table 3 Product Offerings of Leading Companies
Table 4 Low Growth Scenario Forecasts
Table 5 Reference Case Growth Scenario
Table 6 High Growth Case Scenario
Table 7 Global Live Fish Logistics System Revenue (USD Million) And CAGR (%) By Type (2021-2032)
Table 8 Global Live Fish Logistics System Revenue (USD Million) And CAGR (%) By Application (2021-2032)
Table 9 Global Live Fish Logistics System Revenue (USD Million) And CAGR (%) By Product (2021-2032)
Table 10 Global Live Fish Logistics System Market Revenue (USD Million) By Regions (2021-2032)
Table 11 Global Live Fish Logistics System Market Share (%) By Regions (2021-2032)
Table 12 North America Live Fish Logistics System Revenue (USD Million) By Country (2021-2032)
Table 13 Europe Live Fish Logistics System Revenue (USD Million) By Country (2021-2032)
Table 14 Asia Pacific Live Fish Logistics System Revenue (USD Million) By Country (2021-2032)
Table 15 South America Live Fish Logistics System Revenue (USD Million) By Country (2021-2032)
Table 16 Middle East and Africa Live Fish Logistics System Revenue (USD Million) By Region (2021-2032)
Table 17 North America Live Fish Logistics System Revenue (USD Million) By Type (2021-2032)
Table 18 North America Live Fish Logistics System Revenue (USD Million) By Application (2021-2032)
Table 19 North America Live Fish Logistics System Revenue (USD Million) By Product (2021-2032)
Table 20 Europe Live Fish Logistics System Revenue (USD Million) By Type (2021-2032)
Table 21 Europe Live Fish Logistics System Revenue (USD Million) By Application (2021-2032)
Table 22 Europe Live Fish Logistics System Revenue (USD Million) By Product (2021-2032)
Table 23 Asia Pacific Live Fish Logistics System Revenue (USD Million) By Type (2021-2032)
Table 24 Asia Pacific Live Fish Logistics System Revenue (USD Million) By Application (2021-2032)
Table 25 Asia Pacific Live Fish Logistics System Revenue (USD Million) By Product (2021-2032)
Table 26 South America Live Fish Logistics System Revenue (USD Million) By Type (2021-2032)
Table 27 South America Live Fish Logistics System Revenue (USD Million) By Application (2021-2032)
Table 28 South America Live Fish Logistics System Revenue (USD Million) By Product (2021-2032)
Table 29 Middle East and Africa Live Fish Logistics System Revenue (USD Million) By Type (2021-2032)
Table 30 Middle East and Africa Live Fish Logistics System Revenue (USD Million) By Application (2021-2032)
Table 31 Middle East and Africa Live Fish Logistics System Revenue (USD Million) By Product (2021-2032)
LIST OF FIGURES
Figure 1. Market Scope
Figure 2. Pricing Forecasts Per Unit, 2023- 2032
Figure 3. Porter’s Five Forces
Figure 4. Global Live Fish Logistics System Market Revenue (USD Million) By Regions (2021-2032)
Figure 5. Global Live Fish Logistics System Market Share (%) By Regions (2023)
Figure 6. North America Live Fish Logistics System Revenue (USD Million) By Country (2021-2032)
Figure 7. United States Live Fish Logistics System Revenue (USD Million) By Country (2021-2032)
Figure 8. Canada Live Fish Logistics System Revenue (USD Million) By Country (2021-2032)
Figure 9. Mexico Live Fish Logistics System Revenue (USD Million) By Country (2021-2032)
Figure 10. Europe Live Fish Logistics System Revenue (USD Million) By Country (2021-2032)
Figure 11. Germany Live Fish Logistics System Revenue (USD Million) By Country (2021-2032)
Figure 12. France Live Fish Logistics System Revenue (USD Million) By Country (2021-2032)
Figure 13. United Kingdom Live Fish Logistics System Revenue (USD Million) By Country (2021-2032)
Figure 14. Spain Live Fish Logistics System Revenue (USD Million) By Country (2021-2032)
Figure 15. Italy Live Fish Logistics System Revenue (USD Million) By Country (2021-2032)
Figure 16. Russia Live Fish Logistics System Revenue (USD Million) By Country (2021-2032)
Figure 17. Rest of Europe Live Fish Logistics System Revenue (USD Million) By Country (2021-2032)
Figure 11. Asia Pacific Live Fish Logistics System Revenue (USD Million) By Country (2021-2032)
Figure 12. China Live Fish Logistics System Revenue (USD Million) By Country (2021-2032)
Figure 13. Japan Live Fish Logistics System Revenue (USD Million) By Country (2021-2032)
Figure 14. India Live Fish Logistics System Revenue (USD Million) By Country (2021-2032)
Figure 15. South Korea Live Fish Logistics System Revenue (USD Million) By Country (2021-2032)
Figure 16. Australia Live Fish Logistics System Revenue (USD Million) By Country (2021-2032)
Figure 17. South East Asia Live Fish Logistics System Revenue (USD Million) By Country (2021-2032)
Figure 18. South America Live Fish Logistics System Revenue (USD Million) By Country (2021-2032)
Figure 19. Brazil Live Fish Logistics System Revenue (USD Million) By Country (2021-2032)
Figure 20. Argentina Live Fish Logistics System Revenue (USD Million) By Country (2021-2032)
Figure 21. Rest of Asia Pacific Live Fish Logistics System Revenue (USD Million) By Country (2021-2032)
Figure 22. Middle East and Africa Live Fish Logistics System Revenue (USD Million) By Region (2021-2032)
Figure 23. Saudi Arabia Live Fish Logistics System Revenue (USD Million) By Region (2021-2032)
Figure 24. The UAE Live Fish Logistics System Revenue (USD Million) By Region (2021-2032)
Figure 25. Rest of Middle East Live Fish Logistics System Revenue (USD Million) By Region (2021-2032)
Figure 26. South Africa Live Fish Logistics System Revenue (USD Million) By Region (2021-2032)
Figure 27. Africa Live Fish Logistics System Revenue (USD Million) By Region (2021-2032)
Figure 28. North America Live Fish Logistics System Revenue (USD Million) By Type (2021-2032)
Figure 29. North America Live Fish Logistics System Revenue (USD Million) By Application (2021-2032)
Figure 30. North America Live Fish Logistics System Revenue (USD Million) By Product (2021-2032)
Figure 31. Europe Live Fish Logistics System Revenue (USD Million) By Type (2021-2032)
Figure 32. Europe Live Fish Logistics System Revenue (USD Million) By Application (2021-2032)
Figure 33. Europe Live Fish Logistics System Revenue (USD Million) By Product (2021-2032)
Figure 34. Asia Pacific Live Fish Logistics System Revenue (USD Million) By Type (2021-2032)
Figure 35. Asia Pacific Live Fish Logistics System Revenue (USD Million) By Application (2021-2032)
Figure 36. Asia Pacific Live Fish Logistics System Revenue (USD Million) By Product (2021-2032)
Figure 37. South America Live Fish Logistics System Revenue (USD Million) By Type (2021-2032)
Figure 38. South America Live Fish Logistics System Revenue (USD Million) By Application (2021-2032)
Figure 39. South America Live Fish Logistics System Revenue (USD Million) By Product (2021-2032)
Figure 40. Middle East and Africa Live Fish Logistics System Revenue (USD Million) By Type (2021-2032)
Figure 41. Middle East and Africa Live Fish Logistics System Revenue (USD Million) By Application (2021-2032)
Figure 42. Middle East and Africa Live Fish Logistics System Revenue (USD Million) By Product (2021-2032)
By Product
Finfish
Shellfish
Crustaceans
By End-User
Wholesale Distributors
Retailers
Restaurants and Catering Services
Aquaculture Farms
Seafood Processors
By Species
Salmon
Tilapia
Trout
Shrimp
Lobster
Countries Analyzed
North America (US, Canada, Mexico)
Europe (Germany, UK, France, Spain, Italy, Russia, Rest of Europe)
Asia Pacific (China, India, Japan, South Korea, Australia, South East Asia, Rest of Asia)
South America (Brazil, Argentina, Rest of South America)
Middle East and Africa (Saudi Arabia, UAE, Rest of Middle East, South Africa, Egypt, Rest of Africa)
