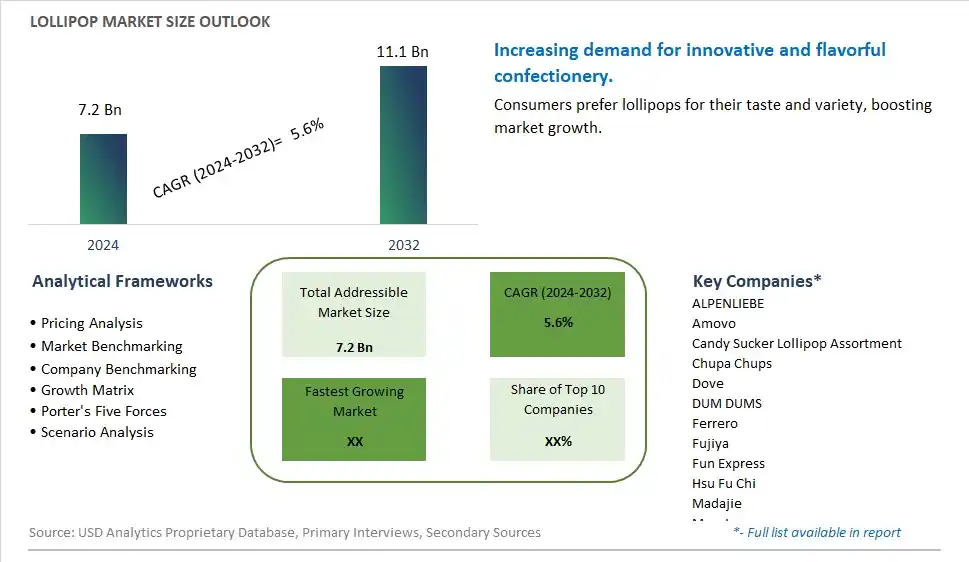
Global Lollipop Market Size is valued at $7.2 Billion in 2024 and is forecast to register a growth rate (CAGR) of 5.6% to reach $11.1 Billion by 2032.
The global Lollipop Market Comprehensive Study analyzes and forecasts the market size across 6 regions and 24 countries for diverse segments -By Type (Fruit Flavored, Milk Flavored, Chocolate, Others), By Application (Supermarkets/Hypermarkets, Independent Retailers, Convenience Stores, Specialist Retailers, Online Retailers, Others)
An Introduction to Lollipop Market
In 2024, the lollipop market is thriving, fueled by the enduring popularity of these sweet treats among children and adults alike. The market is benefiting from innovations in flavor, color, and shape, as well as the introduction of healthier options like sugar-free and organic lollipops. The trend towards clean label products and natural ingredients is influencing product development. Additionally, the increasing demand for novelty and themed lollipops, often tied to popular culture and events, is propelling market growth. Enhanced packaging and marketing strategies are also supporting the expansion of the lollipop market.
Lollipop Competitive Landscape
The market report analyses the leading companies in the industry including ALPENLIEBE, Amovo, Candy Sucker Lollipop Assortment, Chupa Chups, Dove, DUM DUMS, Ferrero, Fujiya, Fun Express, Hsu Fu Chi, Madajie, Mars Inc, Original Gourmet, QUIN Candy, Sugarfina, Yake, YumEarth, Zollipops, and Others.
Lollipop Market Dynamics
Lollipop Market Trend: Increasing Demand for Premium and Novelty Lollipops
The most prominent trend in the Lollipop Market is the increasing demand for premium and novelty lollipops. Consumers are seeking unique and high-quality confectionery products that offer new flavors, fun shapes, and even functional benefits, such as vitamins or natural ingredients. This trend is driven by the desire for indulgent yet innovative treats that stand out in the market.
Lollipop Market Driver: Growth of the Confectionery Industry
A key driver in the Lollipop Market is the overall growth of the confectionery industry. As consumer spending on sweets and snacks continues to rise, there is a growing demand for diverse and innovative products. Lollipops, as a popular and versatile candy, benefit from this trend, with manufacturers continuously introducing new varieties to capture consumer interest.
Lollipop Market Opportunity: Development of Health-Conscious and Functional Lollipops
One significant opportunity in the Lollipop Market lies in the development of health-conscious and functional lollipops. Companies can innovate by creating lollipops with added health benefits, such as reduced sugar content, natural flavors, or added vitamins and minerals. By appealing to health-conscious consumers and parents looking for better snack options for their children, manufacturers can expand their market share and drive growth.
Lollipop Market Share Analysis: Fruit Flavored segment generated the highest revenue share in the industry
The largest segment in the Lollipop Market by type is the Fruit Flavored segment. This dominance is due to the widespread consumer preference for fruity and refreshing tastes that appeal to a broad age range. Fruit flavored lollipops offer a diverse array of flavors, from classic favorites like strawberry and cherry to exotic options like mango and passionfruit, catering to varying taste preferences. The natural association of fruit flavors with health and freshness also contributes to their popularity, making them a preferred choice among parents for their children. Additionally, the vibrant and attractive colors of fruit-flavored lollipops make them visually appealing, which further enhances their marketability. This segment benefits from continuous innovation, with manufacturers frequently introducing new flavors and combinations to keep consumers engaged. The versatility and broad appeal of fruit-flavored lollipops ensure their position as the largest segment in the market.
Lollipop Market Share Analysis: Online Retailers is the fastest growing segment over the forecast period to 2032
The fastest-growing segment in the Lollipop Market by application is the Online Retailers segment. The rapid growth of this segment can be attributed to the increasing popularity of e-commerce and the convenience it offers to consumers. Online retailers provide a vast selection of lollipop brands and flavors, often at competitive prices, making it easy for consumers to compare and choose their preferred products. The ability to shop from the comfort of one's home and the availability of detailed product descriptions and customer reviews enhance the shopping experience, driving more consumers to opt for online purchases. Additionally, the rise of digital marketing and social media platforms has allowed lollipop brands to reach a wider audience, further boosting online sales. The Past few yearshas also accelerated the shift towards online shopping, with more consumers turning to e-commerce for their candy needs. As the trend towards digitalization continues, the online retailers segment is expected to witness substantial growth, making it the fastest-growing application in the lollipop market leading up to 2032.
Lollipop Market Segmentation
By Type
Fruit Flavored
Milk Flavored
Chocolate
Others
By Application
Supermarkets/Hypermarkets
Independent Retailers
Convenience Stores
Specialist Retailers
Online Retailers
Others
Countries Analyzed
North America (US, Canada, Mexico)
Europe (Germany, UK, France, Spain, Italy, Russia, Rest of Europe)
Asia Pacific (China, India, Japan, South Korea, Australia, South East Asia, Rest of Asia)
South America (Brazil, Argentina, Rest of South America)
Middle East and Africa (Saudi Arabia, UAE, Rest of Middle East, South Africa, Egypt, Rest of Africa)
Lollipop Companies Profiled in the Study
ALPENLIEBE
Amovo
Candy Sucker Lollipop Assortment
Chupa Chups
Dove
DUM DUMS
Ferrero
Fujiya
Fun Express
Hsu Fu Chi
Madajie
Mars Inc
Original Gourmet
QUIN Candy
Sugarfina
Yake
YumEarth
Zollipops
*- List Not Exhaustive
Chapter 1. TABLE OF CONTENTS
Chapter 2. Introduction to Lollipop Market
2.1. Market Overview
2.2. Key Statistics and Report Highlights
2.3. Scope of the Comprehensive Study
2.3.1. Market Definition
2.3.2 Countries and Regions Covered
2.3.3 Research Objective
2.3.4 Units, Currency, and Conversions
2.3.5 Industry Value Chain
2.4. Key Market Segments
2.5. Key Companies
2.6. Study Period
Chapter 3. Strategic Analysis Review
3.1. Lollipop Pricing Analysis and Forecast
3.2. Porter’s Five Forces
3.3. Market Ecosystem
3.4. SWOT Analysis
3.5. Regulatory Scenario
3.3. Effects of Inflation, Russia-Ukraine War, moderating economic growth, and other macroeconomic factors
Chapter 4. Competitive Landscape
4.1. Market Share Analysis
4.1.1. Global Lollipop Market Share by Company, 2023
4.1.2. Product Offerings of Leading Lollipop Companies
4.2. Market Entropy
4.2.1. New Product Launches in the Industry
4.2.2. Mergers, Acquisitions, Joint ventures, and Partnerships
4.3. Key Strategies and Best Practices
Chapter 5. Global Market Projections: Best, Reference, and Low Case Scenarios
5.1. Growth Analysis- Case Scenario Definitions
5.2. Low Growth Case Scenario Forecasts
5.3. Reference Growth Case Scenario Forecasts
5.4. High Growth Case Scenario Forecasts
Chapter 6. Market Dynamics
6.1. Lollipop Market Drivers
6.2. Lollipop Market Challenges
6.6. Lollipop Market Opportunities
6.4. Lollipop Market Trends
Chapter 7. Global Lollipop Market Outlook Trends
7.1. Global Lollipop Revenue (USD Million) and CAGR (%) by Type (2021-2032)
7.2. Global Lollipop Revenue (USD Million) and CAGR (%) by Application (2021-2032)
7.3. Global Lollipop Revenue (USD Million) and CAGR (%) by Product (2021-2032)
By Type
Fruit Flavored
Milk Flavored
Chocolate
Others
By Application
Supermarkets/Hypermarkets
Independent Retailers
Convenience Stores
Specialist Retailers
Online Retailers
Others
Chapter 8. Global Lollipop Regional Analysis and Outlook
8.1. Global Lollipop Revenue (USD Million) By Regions (2021- 2032)
8.2. North America Lollipop Revenue (USD Million) by Country (2021-2032)
8.2.1. United States Lollipop Regional Analysis and Outlook
8.2.2. Canada Lollipop Regional Analysis and Outlook
8.2.3. Mexico Lollipop Regional Analysis and Outlook
8.3. Europe Lollipop Revenue (USD Million), by Country (2021-2032)
8.3.1. Germany Lollipop Regional Analysis and Outlook
8.3.2. France Lollipop Regional Analysis and Outlook
8.3.3. United Kingdom Lollipop Regional Analysis and Outlook
8.3.4. Spain Lollipop Regional Analysis and Outlook
8.3.5. Italy Lollipop Regional Analysis and Outlook
8.3.6. Russia Lollipop Regional Analysis and Outlook
8.3.7. Rest of Europe Lollipop Regional Analysis and Outlook
8.4. Asia Pacific Lollipop Revenue (USD Million) by Country (2021-2032)
8.4.1. China Lollipop Regional Analysis and Outlook
8.4.2. Japan Lollipop Regional Analysis and Outlook
8.4.3. India Lollipop Regional Analysis and Outlook
8.4.4. South Korea Lollipop Regional Analysis and Outlook
8.4.5. Australia Lollipop Regional Analysis and Outlook
8.4.6. South East Asia Lollipop Regional Analysis and Outlook
8.4.7. Rest of Asia Pacific Lollipop Regional Analysis and Outlook
8.5. South America Lollipop Revenue (USD Million), by Country (2021-2032)
8.5.1. Brazil Lollipop Regional Analysis and Outlook
8.5.2. Argentina Lollipop Regional Analysis and Outlook
8.5.3. Rest of South America Lollipop Regional Analysis and Outlook
8.6. Middle East and Africa Lollipop Revenue (USD Million) by Country (2021-2032)
8.6.1. Middle East Lollipop Regional Analysis and Outlook
8.6.2. Africa Lollipop Regional Analysis and Outlook
Chapter 9. North America Lollipop Analysis and Outlook
9.1. North America Lollipop Revenue (USD Million) by Segments (2021-2032)
9.1.1. North America Lollipop Revenue (USD Million) by Type (2021-2032)
9.1.2. North America Lollipop Revenue (USD Million) by Application (2021-2032)
9.1.3. North America Lollipop Revenue (USD Million) by Product (2021-2032)
By Type
Fruit Flavored
Milk Flavored
Chocolate
Others
By Application
Supermarkets/Hypermarkets
Independent Retailers
Convenience Stores
Specialist Retailers
Online Retailers
Others
Chapter 10. Europe Lollipop Analysis and Outlook
10.1. Europe Lollipop Revenue (USD Million), by Segments (USD Million) (2021-2032)
10.1.1. Europe Lollipop Revenue (USD Million) by Type (2021-2032)
10.1.2. Europe Lollipop Revenue (USD Million) by Application (2021-2032)
10.1.3. Europe Lollipop Revenue (USD Million) by Product (2021-2032)
By Type
Fruit Flavored
Milk Flavored
Chocolate
Others
By Application
Supermarkets/Hypermarkets
Independent Retailers
Convenience Stores
Specialist Retailers
Online Retailers
Others
Chapter 11. Asia Pacific Lollipop Analysis and Outlook
11.1. Asia Pacific Lollipop Revenue (USD Million), and Revenue (USD Million) by Segments (2021-2032)
11.1.1. Asia Pacific Lollipop Revenue (USD Million) by Type (2021-2032)
11.1.2. Asia Pacific Lollipop Revenue (USD Million) by Application (2021-2032)
11.1.3. Asia Pacific Lollipop Revenue (USD Million) by Product (2021-2032)
By Type
Fruit Flavored
Milk Flavored
Chocolate
Others
By Application
Supermarkets/Hypermarkets
Independent Retailers
Convenience Stores
Specialist Retailers
Online Retailers
Others
Chapter 12. South America Lollipop Analysis and Outlook
12.1. South America Lollipop Revenue (USD Million), by Segments (2021-2032)
12.1.1. South America Lollipop Revenue (USD Million) by Type (2021-2032)
12.1.2. South America Lollipop Revenue (USD Million) by Application (2021-2032)
12.1.3. South America Lollipop Revenue (USD Million) by Product (2021-2032)
By Type
Fruit Flavored
Milk Flavored
Chocolate
Others
By Application
Supermarkets/Hypermarkets
Independent Retailers
Convenience Stores
Specialist Retailers
Online Retailers
Others
Chapter 13. Middle East and Africa Lollipop Analysis and Outlook
13.1. Middle East and Africa Lollipop Revenue (USD Million), by Segments (2021-2032)
13.1.1. Middle East and Africa Lollipop Revenue (USD Million) by Type (2021-2032)
13.1.2. Middle East and Africa Lollipop Revenue (USD Million) by Application (2021-2032)
13.1.3. Middle East and Africa Lollipop Revenue (USD Million) by Product (2021-2032)
By Type
Fruit Flavored
Milk Flavored
Chocolate
Others
By Application
Supermarkets/Hypermarkets
Independent Retailers
Convenience Stores
Specialist Retailers
Online Retailers
Others
Chapter 14. Lollipop Company Profiles
14.1 Business Overview
14.2 Product Profiles
14.3 SWOT Profiles
14.5 Recent Developments
14.6 Financial Profile
List of Companies
ALPENLIEBE
Amovo
Candy Sucker Lollipop Assortment
Chupa Chups
Dove
DUM DUMS
Ferrero
Fujiya
Fun Express
Hsu Fu Chi
Madajie
Mars Inc
Original Gourmet
QUIN Candy
Sugarfina
Yake
YumEarth
Zollipops
15. Methodology and Data Sources
15.1 Customization Offerings
15.2 Subscription Services
15.3 Related Reports
15.4 Publisher Expertise
LIST OF TABLES
Table 1 Market Segmentation Analysis
Table 2 Global Lollipop Market Share of Leading Companies, 2023
Table 3 Product Offerings of Leading Companies
Table 4 Low Growth Scenario Forecasts
Table 5 Reference Case Growth Scenario
Table 6 High Growth Case Scenario
Table 7 Global Lollipop Revenue (USD Million) And CAGR (%) By Type (2021-2032)
Table 8 Global Lollipop Revenue (USD Million) And CAGR (%) By Application (2021-2032)
Table 9 Global Lollipop Revenue (USD Million) And CAGR (%) By Product (2021-2032)
Table 10 Global Lollipop Market Revenue (USD Million) By Regions (2021-2032)
Table 11 Global Lollipop Market Share (%) By Regions (2021-2032)
Table 12 North America Lollipop Revenue (USD Million) By Country (2021-2032)
Table 13 Europe Lollipop Revenue (USD Million) By Country (2021-2032)
Table 14 Asia Pacific Lollipop Revenue (USD Million) By Country (2021-2032)
Table 15 South America Lollipop Revenue (USD Million) By Country (2021-2032)
Table 16 Middle East and Africa Lollipop Revenue (USD Million) By Region (2021-2032)
Table 17 North America Lollipop Revenue (USD Million) By Type (2021-2032)
Table 18 North America Lollipop Revenue (USD Million) By Application (2021-2032)
Table 19 North America Lollipop Revenue (USD Million) By Product (2021-2032)
Table 20 Europe Lollipop Revenue (USD Million) By Type (2021-2032)
Table 21 Europe Lollipop Revenue (USD Million) By Application (2021-2032)
Table 22 Europe Lollipop Revenue (USD Million) By Product (2021-2032)
Table 23 Asia Pacific Lollipop Revenue (USD Million) By Type (2021-2032)
Table 24 Asia Pacific Lollipop Revenue (USD Million) By Application (2021-2032)
Table 25 Asia Pacific Lollipop Revenue (USD Million) By Product (2021-2032)
Table 26 South America Lollipop Revenue (USD Million) By Type (2021-2032)
Table 27 South America Lollipop Revenue (USD Million) By Application (2021-2032)
Table 28 South America Lollipop Revenue (USD Million) By Product (2021-2032)
Table 29 Middle East and Africa Lollipop Revenue (USD Million) By Type (2021-2032)
Table 30 Middle East and Africa Lollipop Revenue (USD Million) By Application (2021-2032)
Table 31 Middle East and Africa Lollipop Revenue (USD Million) By Product (2021-2032)
LIST OF FIGURES
Figure 1. Market Scope
Figure 2. Pricing Forecasts Per Unit, 2023- 2032
Figure 3. Porter’s Five Forces
Figure 4. Global Lollipop Market Revenue (USD Million) By Regions (2021-2032)
Figure 5. Global Lollipop Market Share (%) By Regions (2023)
Figure 6. North America Lollipop Revenue (USD Million) By Country (2021-2032)
Figure 7. United States Lollipop Revenue (USD Million) By Country (2021-2032)
Figure 8. Canada Lollipop Revenue (USD Million) By Country (2021-2032)
Figure 9. Mexico Lollipop Revenue (USD Million) By Country (2021-2032)
Figure 10. Europe Lollipop Revenue (USD Million) By Country (2021-2032)
Figure 11. Germany Lollipop Revenue (USD Million) By Country (2021-2032)
Figure 12. France Lollipop Revenue (USD Million) By Country (2021-2032)
Figure 13. United Kingdom Lollipop Revenue (USD Million) By Country (2021-2032)
Figure 14. Spain Lollipop Revenue (USD Million) By Country (2021-2032)
Figure 15. Italy Lollipop Revenue (USD Million) By Country (2021-2032)
Figure 16. Russia Lollipop Revenue (USD Million) By Country (2021-2032)
Figure 17. Rest of Europe Lollipop Revenue (USD Million) By Country (2021-2032)
Figure 11. Asia Pacific Lollipop Revenue (USD Million) By Country (2021-2032)
Figure 12. China Lollipop Revenue (USD Million) By Country (2021-2032)
Figure 13. Japan Lollipop Revenue (USD Million) By Country (2021-2032)
Figure 14. India Lollipop Revenue (USD Million) By Country (2021-2032)
Figure 15. South Korea Lollipop Revenue (USD Million) By Country (2021-2032)
Figure 16. Australia Lollipop Revenue (USD Million) By Country (2021-2032)
Figure 17. South East Asia Lollipop Revenue (USD Million) By Country (2021-2032)
Figure 18. South America Lollipop Revenue (USD Million) By Country (2021-2032)
Figure 19. Brazil Lollipop Revenue (USD Million) By Country (2021-2032)
Figure 20. Argentina Lollipop Revenue (USD Million) By Country (2021-2032)
Figure 21. Rest of Asia Pacific Lollipop Revenue (USD Million) By Country (2021-2032)
Figure 22. Middle East and Africa Lollipop Revenue (USD Million) By Region (2021-2032)
Figure 23. Saudi Arabia Lollipop Revenue (USD Million) By Region (2021-2032)
Figure 24. The UAE Lollipop Revenue (USD Million) By Region (2021-2032)
Figure 25. Rest of Middle East Lollipop Revenue (USD Million) By Region (2021-2032)
Figure 26. South Africa Lollipop Revenue (USD Million) By Region (2021-2032)
Figure 27. Africa Lollipop Revenue (USD Million) By Region (2021-2032)
Figure 28. North America Lollipop Revenue (USD Million) By Type (2021-2032)
Figure 29. North America Lollipop Revenue (USD Million) By Application (2021-2032)
Figure 30. North America Lollipop Revenue (USD Million) By Product (2021-2032)
Figure 31. Europe Lollipop Revenue (USD Million) By Type (2021-2032)
Figure 32. Europe Lollipop Revenue (USD Million) By Application (2021-2032)
Figure 33. Europe Lollipop Revenue (USD Million) By Product (2021-2032)
Figure 34. Asia Pacific Lollipop Revenue (USD Million) By Type (2021-2032)
Figure 35. Asia Pacific Lollipop Revenue (USD Million) By Application (2021-2032)
Figure 36. Asia Pacific Lollipop Revenue (USD Million) By Product (2021-2032)
Figure 37. South America Lollipop Revenue (USD Million) By Type (2021-2032)
Figure 38. South America Lollipop Revenue (USD Million) By Application (2021-2032)
Figure 39. South America Lollipop Revenue (USD Million) By Product (2021-2032)
Figure 40. Middle East and Africa Lollipop Revenue (USD Million) By Type (2021-2032)
Figure 41. Middle East and Africa Lollipop Revenue (USD Million) By Application (2021-2032)
Figure 42. Middle East and Africa Lollipop Revenue (USD Million) By Product (2021-2032)
By Type
Fruit Flavored
Milk Flavored
Chocolate
Others
By Application
Supermarkets/Hypermarkets
Independent Retailers
Convenience Stores
Specialist Retailers
Online Retailers
Others
Countries Analyzed
North America (US, Canada, Mexico)
Europe (Germany, UK, France, Spain, Italy, Russia, Rest of Europe)
Asia Pacific (China, India, Japan, South Korea, Australia, South East Asia, Rest of Asia)
South America (Brazil, Argentina, Rest of South America)
Middle East and Africa (Saudi Arabia, UAE, Rest of Middle East, South Africa, Egypt, Rest of Africa)
