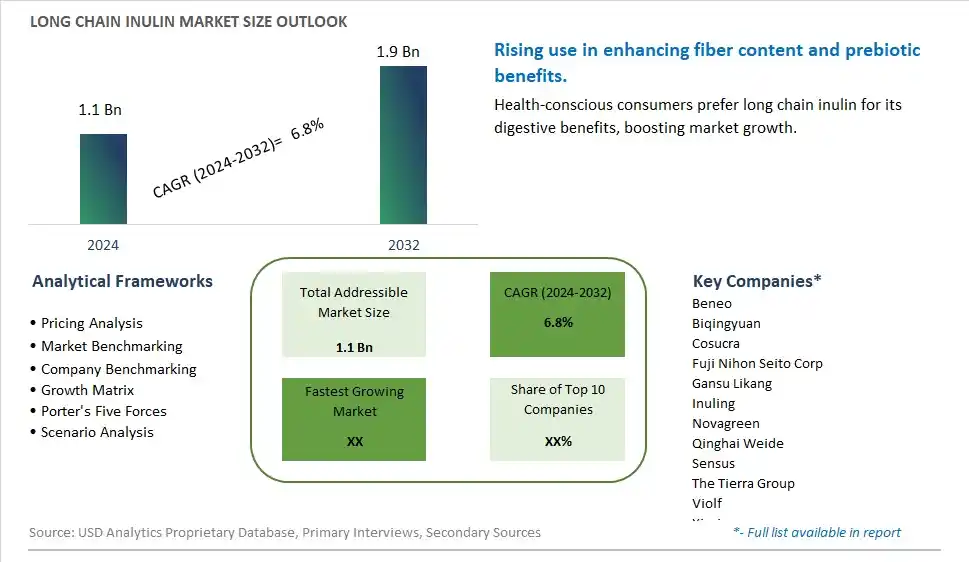
Global Long Chain Inulin Market Size is valued at $1.1 Billion in 2024 and is forecast to register a growth rate (CAGR) of 6.8% to reach $1.9 Billion by 2032.
The global Long Chain Inulin Market Comprehensive Study analyzes and forecasts the market size across 6 regions and 24 countries for diverse segments -By Type (Chicory Roots Inulin, Artichoke Inulin, Others), By Application (Bakery and Confectionary, Beverages, Dairy, Baby Foods, Animal Foods, Nutrition Supplements, Others)
An Introduction to Long Chain Inulin Market
In 2024, the long chain inulin market is expanding rapidly, driven by the increasing demand for dietary fibers with prebiotic properties. Long chain inulin, derived from chicory root and other plants, is valued for its ability to support gut health and improve digestive functions. The market benefits from innovations in extraction and processing techniques that enhance the purity and functionality of inulin. The trend towards clean label and natural ingredients is influencing product development, with long chain inulin being incorporated into a wide range of foods and beverages. The growing consumer awareness of the health benefits of dietary fibers is further supporting market growth.
Long Chain Inulin Competitive Landscape
The market report analyses the leading companies in the industry including Beneo, Biqingyuan, Cosucra, Fuji Nihon Seito Corp, Gansu Likang, Inuling, Novagreen, Qinghai Weide, Sensus, The Tierra Group, Violf, Xirui, and Others.
Long Chain Inulin Market Dynamics
Long Chain Inulin Market Trend: Rising Demand for Prebiotic Ingredients
The most prominent trend in the Long Chain Inulin Market is the rising demand for prebiotic ingredients. Long chain inulin, known for its beneficial effects on gut health, is increasingly used in functional foods, beverages, and dietary supplements. This trend is driven by the growing consumer awareness of the importance of digestive health and the role of prebiotics in maintaining a healthy microbiome.
Long Chain Inulin Market Driver: Health Consciousness and Preventive Healthcare
A key driver in the Long Chain Inulin Market is health consciousness and preventive healthcare. As consumers become more aware of the connection between diet and overall health, there is a growing demand for ingredients that support well-being and prevent health issues. Long chain inulin, with its ability to improve digestion and enhance nutrient absorption, is a sought-after ingredient in health-focused products.
Long Chain Inulin Market Opportunity: Innovation in Food and Beverage Applications
One significant opportunity in the Long Chain Inulin Market lies in innovation in food and beverage applications. Companies can develop new products that incorporate long chain inulin, such as high-fiber snacks, probiotic-rich drinks, and fortified foods. By creating appealing and convenient products that highlight the health benefits of inulin, manufacturers can attract health-conscious consumers and drive market growth.
Long Chain Inulin Market Share Analysis: Chicory Roots Inulin segment generated the highest revenue share in the industry
The largest segment in the Long Chain Inulin Market by type is the Chicory Roots Inulin. Chicory roots are the primary source of inulin, a natural polysaccharide that is widely used for its prebiotic properties and health benefits. The dominance of this segment can be attributed to the abundant availability of chicory roots and the established extraction processes that ensure high yield and quality. Chicory root inulin is highly favored in the food and beverage industry due to its ability to enhance texture, improve taste, and increase the fiber content of products. Its application spans across various sectors including bakery, confectionery, dairy, and beverages, making it a versatile ingredient. The growing consumer awareness of gut health and the demand for functional foods have further driven the popularity of chicory root inulin. Additionally, it is often used as a sugar and fat replacer in low-calorie and health-focused products, aligning with current dietary trends. This extensive use and consumer preference secure chicory roots inulin as the largest segment in the long chain inulin market.
Long Chain Inulin Market Share Analysis: Nutrition Supplements is the fastest growing segment over the forecast period to 2032
The fastest-growing segment in the Long Chain Inulin Market by application is the Nutrition Supplements segment. This rapid growth is driven by the increasing consumer focus on health and wellness, and the rising demand for dietary supplements that support digestive health. Inulin, being a prebiotic fiber, plays a crucial role in promoting gut health by stimulating the growth of beneficial bacteria in the intestine. The heightened awareness of the importance of gut microbiota in overall health has led to a surge in the incorporation of inulin in nutritional supplements. These supplements cater to a wide range of health-conscious consumers looking to improve their digestive health, enhance immune function, and maintain a healthy weight. Additionally, the convenience of supplement form, whether in powders, capsules, or gummies, makes it an attractive option for consumers. The ongoing research and positive endorsements by health professionals about the benefits of inulin further boost its application in the nutrition supplement segment. As the trend towards preventive health and wellness continues to rise, the nutrition supplements segment is expected to experience substantial growth leading up to 2032.
Long Chain Inulin Market Segmentation
By Type
Chicory Roots Inulin
Artichoke Inulin
Others
By Application
Bakery and Confectionary
Beverages
Dairy
Baby Foods
Animal Foods
Nutrition Supplements
Others
Countries Analyzed
North America (US, Canada, Mexico)
Europe (Germany, UK, France, Spain, Italy, Russia, Rest of Europe)
Asia Pacific (China, India, Japan, South Korea, Australia, South East Asia, Rest of Asia)
South America (Brazil, Argentina, Rest of South America)
Middle East and Africa (Saudi Arabia, UAE, Rest of Middle East, South Africa, Egypt, Rest of Africa)
Long Chain Inulin Companies Profiled in the Study
Beneo
Biqingyuan
Cosucra
Fuji Nihon Seito Corp
Gansu Likang
Inuling
Novagreen
Qinghai Weide
Sensus
The Tierra Group
Violf
Xirui
*- List Not Exhaustive
Chapter 1. TABLE OF CONTENTS
Chapter 2. Introduction to Long Chain Inulin Market
2.1. Market Overview
2.2. Key Statistics and Report Highlights
2.3. Scope of the Comprehensive Study
2.3.1. Market Definition
2.3.2 Countries and Regions Covered
2.3.3 Research Objective
2.3.4 Units, Currency, and Conversions
2.3.5 Industry Value Chain
2.4. Key Market Segments
2.5. Key Companies
2.6. Study Period
Chapter 3. Strategic Analysis Review
3.1. Long Chain Inulin Pricing Analysis and Forecast
3.2. Porter’s Five Forces
3.3. Market Ecosystem
3.4. SWOT Analysis
3.5. Regulatory Scenario
3.3. Effects of Inflation, Russia-Ukraine War, moderating economic growth, and other macroeconomic factors
Chapter 4. Competitive Landscape
4.1. Market Share Analysis
4.1.1. Global Long Chain Inulin Market Share by Company, 2023
4.1.2. Product Offerings of Leading Long Chain Inulin Companies
4.2. Market Entropy
4.2.1. New Product Launches in the Industry
4.2.2. Mergers, Acquisitions, Joint ventures, and Partnerships
4.3. Key Strategies and Best Practices
Chapter 5. Global Market Projections: Best, Reference, and Low Case Scenarios
5.1. Growth Analysis- Case Scenario Definitions
5.2. Low Growth Case Scenario Forecasts
5.3. Reference Growth Case Scenario Forecasts
5.4. High Growth Case Scenario Forecasts
Chapter 6. Market Dynamics
6.1. Long Chain Inulin Market Drivers
6.2. Long Chain Inulin Market Challenges
6.6. Long Chain Inulin Market Opportunities
6.4. Long Chain Inulin Market Trends
Chapter 7. Global Long Chain Inulin Market Outlook Trends
7.1. Global Long Chain Inulin Revenue (USD Million) and CAGR (%) by Type (2021-2032)
7.2. Global Long Chain Inulin Revenue (USD Million) and CAGR (%) by Application (2021-2032)
7.3. Global Long Chain Inulin Revenue (USD Million) and CAGR (%) by Product (2021-2032)
By Type
Chicory Roots Inulin
Artichoke Inulin
Others
By Application
Bakery and Confectionary
Beverages
Dairy
Baby Foods
Animal Foods
Nutrition Supplements
Others
Chapter 8. Global Long Chain Inulin Regional Analysis and Outlook
8.1. Global Long Chain Inulin Revenue (USD Million) By Regions (2021- 2032)
8.2. North America Long Chain Inulin Revenue (USD Million) by Country (2021-2032)
8.2.1. United States Long Chain Inulin Regional Analysis and Outlook
8.2.2. Canada Long Chain Inulin Regional Analysis and Outlook
8.2.3. Mexico Long Chain Inulin Regional Analysis and Outlook
8.3. Europe Long Chain Inulin Revenue (USD Million), by Country (2021-2032)
8.3.1. Germany Long Chain Inulin Regional Analysis and Outlook
8.3.2. France Long Chain Inulin Regional Analysis and Outlook
8.3.3. United Kingdom Long Chain Inulin Regional Analysis and Outlook
8.3.4. Spain Long Chain Inulin Regional Analysis and Outlook
8.3.5. Italy Long Chain Inulin Regional Analysis and Outlook
8.3.6. Russia Long Chain Inulin Regional Analysis and Outlook
8.3.7. Rest of Europe Long Chain Inulin Regional Analysis and Outlook
8.4. Asia Pacific Long Chain Inulin Revenue (USD Million) by Country (2021-2032)
8.4.1. China Long Chain Inulin Regional Analysis and Outlook
8.4.2. Japan Long Chain Inulin Regional Analysis and Outlook
8.4.3. India Long Chain Inulin Regional Analysis and Outlook
8.4.4. South Korea Long Chain Inulin Regional Analysis and Outlook
8.4.5. Australia Long Chain Inulin Regional Analysis and Outlook
8.4.6. South East Asia Long Chain Inulin Regional Analysis and Outlook
8.4.7. Rest of Asia Pacific Long Chain Inulin Regional Analysis and Outlook
8.5. South America Long Chain Inulin Revenue (USD Million), by Country (2021-2032)
8.5.1. Brazil Long Chain Inulin Regional Analysis and Outlook
8.5.2. Argentina Long Chain Inulin Regional Analysis and Outlook
8.5.3. Rest of South America Long Chain Inulin Regional Analysis and Outlook
8.6. Middle East and Africa Long Chain Inulin Revenue (USD Million) by Country (2021-2032)
8.6.1. Middle East Long Chain Inulin Regional Analysis and Outlook
8.6.2. Africa Long Chain Inulin Regional Analysis and Outlook
Chapter 9. North America Long Chain Inulin Analysis and Outlook
9.1. North America Long Chain Inulin Revenue (USD Million) by Segments (2021-2032)
9.1.1. North America Long Chain Inulin Revenue (USD Million) by Type (2021-2032)
9.1.2. North America Long Chain Inulin Revenue (USD Million) by Application (2021-2032)
9.1.3. North America Long Chain Inulin Revenue (USD Million) by Product (2021-2032)
By Type
Chicory Roots Inulin
Artichoke Inulin
Others
By Application
Bakery and Confectionary
Beverages
Dairy
Baby Foods
Animal Foods
Nutrition Supplements
Others
Chapter 10. Europe Long Chain Inulin Analysis and Outlook
10.1. Europe Long Chain Inulin Revenue (USD Million), by Segments (USD Million) (2021-2032)
10.1.1. Europe Long Chain Inulin Revenue (USD Million) by Type (2021-2032)
10.1.2. Europe Long Chain Inulin Revenue (USD Million) by Application (2021-2032)
10.1.3. Europe Long Chain Inulin Revenue (USD Million) by Product (2021-2032)
By Type
Chicory Roots Inulin
Artichoke Inulin
Others
By Application
Bakery and Confectionary
Beverages
Dairy
Baby Foods
Animal Foods
Nutrition Supplements
Others
Chapter 11. Asia Pacific Long Chain Inulin Analysis and Outlook
11.1. Asia Pacific Long Chain Inulin Revenue (USD Million), and Revenue (USD Million) by Segments (2021-2032)
11.1.1. Asia Pacific Long Chain Inulin Revenue (USD Million) by Type (2021-2032)
11.1.2. Asia Pacific Long Chain Inulin Revenue (USD Million) by Application (2021-2032)
11.1.3. Asia Pacific Long Chain Inulin Revenue (USD Million) by Product (2021-2032)
By Type
Chicory Roots Inulin
Artichoke Inulin
Others
By Application
Bakery and Confectionary
Beverages
Dairy
Baby Foods
Animal Foods
Nutrition Supplements
Others
Chapter 12. South America Long Chain Inulin Analysis and Outlook
12.1. South America Long Chain Inulin Revenue (USD Million), by Segments (2021-2032)
12.1.1. South America Long Chain Inulin Revenue (USD Million) by Type (2021-2032)
12.1.2. South America Long Chain Inulin Revenue (USD Million) by Application (2021-2032)
12.1.3. South America Long Chain Inulin Revenue (USD Million) by Product (2021-2032)
By Type
Chicory Roots Inulin
Artichoke Inulin
Others
By Application
Bakery and Confectionary
Beverages
Dairy
Baby Foods
Animal Foods
Nutrition Supplements
Others
Chapter 13. Middle East and Africa Long Chain Inulin Analysis and Outlook
13.1. Middle East and Africa Long Chain Inulin Revenue (USD Million), by Segments (2021-2032)
13.1.1. Middle East and Africa Long Chain Inulin Revenue (USD Million) by Type (2021-2032)
13.1.2. Middle East and Africa Long Chain Inulin Revenue (USD Million) by Application (2021-2032)
13.1.3. Middle East and Africa Long Chain Inulin Revenue (USD Million) by Product (2021-2032)
By Type
Chicory Roots Inulin
Artichoke Inulin
Others
By Application
Bakery and Confectionary
Beverages
Dairy
Baby Foods
Animal Foods
Nutrition Supplements
Others
Chapter 14. Long Chain Inulin Company Profiles
14.1 Business Overview
14.2 Product Profiles
14.3 SWOT Profiles
14.5 Recent Developments
14.6 Financial Profile
List of Companies
Beneo
Biqingyuan
Cosucra
Fuji Nihon Seito Corp
Gansu Likang
Inuling
Novagreen
Qinghai Weide
Sensus
The Tierra Group
Violf
Xirui
15. Methodology and Data Sources
15.1 Customization Offerings
15.2 Subscription Services
15.3 Related Reports
15.4 Publisher Expertise
LIST OF TABLES
Table 1 Market Segmentation Analysis
Table 2 Global Long Chain Inulin Market Share of Leading Companies, 2023
Table 3 Product Offerings of Leading Companies
Table 4 Low Growth Scenario Forecasts
Table 5 Reference Case Growth Scenario
Table 6 High Growth Case Scenario
Table 7 Global Long Chain Inulin Revenue (USD Million) And CAGR (%) By Type (2021-2032)
Table 8 Global Long Chain Inulin Revenue (USD Million) And CAGR (%) By Application (2021-2032)
Table 9 Global Long Chain Inulin Revenue (USD Million) And CAGR (%) By Product (2021-2032)
Table 10 Global Long Chain Inulin Market Revenue (USD Million) By Regions (2021-2032)
Table 11 Global Long Chain Inulin Market Share (%) By Regions (2021-2032)
Table 12 North America Long Chain Inulin Revenue (USD Million) By Country (2021-2032)
Table 13 Europe Long Chain Inulin Revenue (USD Million) By Country (2021-2032)
Table 14 Asia Pacific Long Chain Inulin Revenue (USD Million) By Country (2021-2032)
Table 15 South America Long Chain Inulin Revenue (USD Million) By Country (2021-2032)
Table 16 Middle East and Africa Long Chain Inulin Revenue (USD Million) By Region (2021-2032)
Table 17 North America Long Chain Inulin Revenue (USD Million) By Type (2021-2032)
Table 18 North America Long Chain Inulin Revenue (USD Million) By Application (2021-2032)
Table 19 North America Long Chain Inulin Revenue (USD Million) By Product (2021-2032)
Table 20 Europe Long Chain Inulin Revenue (USD Million) By Type (2021-2032)
Table 21 Europe Long Chain Inulin Revenue (USD Million) By Application (2021-2032)
Table 22 Europe Long Chain Inulin Revenue (USD Million) By Product (2021-2032)
Table 23 Asia Pacific Long Chain Inulin Revenue (USD Million) By Type (2021-2032)
Table 24 Asia Pacific Long Chain Inulin Revenue (USD Million) By Application (2021-2032)
Table 25 Asia Pacific Long Chain Inulin Revenue (USD Million) By Product (2021-2032)
Table 26 South America Long Chain Inulin Revenue (USD Million) By Type (2021-2032)
Table 27 South America Long Chain Inulin Revenue (USD Million) By Application (2021-2032)
Table 28 South America Long Chain Inulin Revenue (USD Million) By Product (2021-2032)
Table 29 Middle East and Africa Long Chain Inulin Revenue (USD Million) By Type (2021-2032)
Table 30 Middle East and Africa Long Chain Inulin Revenue (USD Million) By Application (2021-2032)
Table 31 Middle East and Africa Long Chain Inulin Revenue (USD Million) By Product (2021-2032)
LIST OF FIGURES
Figure 1. Market Scope
Figure 2. Pricing Forecasts Per Unit, 2023- 2032
Figure 3. Porter’s Five Forces
Figure 4. Global Long Chain Inulin Market Revenue (USD Million) By Regions (2021-2032)
Figure 5. Global Long Chain Inulin Market Share (%) By Regions (2023)
Figure 6. North America Long Chain Inulin Revenue (USD Million) By Country (2021-2032)
Figure 7. United States Long Chain Inulin Revenue (USD Million) By Country (2021-2032)
Figure 8. Canada Long Chain Inulin Revenue (USD Million) By Country (2021-2032)
Figure 9. Mexico Long Chain Inulin Revenue (USD Million) By Country (2021-2032)
Figure 10. Europe Long Chain Inulin Revenue (USD Million) By Country (2021-2032)
Figure 11. Germany Long Chain Inulin Revenue (USD Million) By Country (2021-2032)
Figure 12. France Long Chain Inulin Revenue (USD Million) By Country (2021-2032)
Figure 13. United Kingdom Long Chain Inulin Revenue (USD Million) By Country (2021-2032)
Figure 14. Spain Long Chain Inulin Revenue (USD Million) By Country (2021-2032)
Figure 15. Italy Long Chain Inulin Revenue (USD Million) By Country (2021-2032)
Figure 16. Russia Long Chain Inulin Revenue (USD Million) By Country (2021-2032)
Figure 17. Rest of Europe Long Chain Inulin Revenue (USD Million) By Country (2021-2032)
Figure 11. Asia Pacific Long Chain Inulin Revenue (USD Million) By Country (2021-2032)
Figure 12. China Long Chain Inulin Revenue (USD Million) By Country (2021-2032)
Figure 13. Japan Long Chain Inulin Revenue (USD Million) By Country (2021-2032)
Figure 14. India Long Chain Inulin Revenue (USD Million) By Country (2021-2032)
Figure 15. South Korea Long Chain Inulin Revenue (USD Million) By Country (2021-2032)
Figure 16. Australia Long Chain Inulin Revenue (USD Million) By Country (2021-2032)
Figure 17. South East Asia Long Chain Inulin Revenue (USD Million) By Country (2021-2032)
Figure 18. South America Long Chain Inulin Revenue (USD Million) By Country (2021-2032)
Figure 19. Brazil Long Chain Inulin Revenue (USD Million) By Country (2021-2032)
Figure 20. Argentina Long Chain Inulin Revenue (USD Million) By Country (2021-2032)
Figure 21. Rest of Asia Pacific Long Chain Inulin Revenue (USD Million) By Country (2021-2032)
Figure 22. Middle East and Africa Long Chain Inulin Revenue (USD Million) By Region (2021-2032)
Figure 23. Saudi Arabia Long Chain Inulin Revenue (USD Million) By Region (2021-2032)
Figure 24. The UAE Long Chain Inulin Revenue (USD Million) By Region (2021-2032)
Figure 25. Rest of Middle East Long Chain Inulin Revenue (USD Million) By Region (2021-2032)
Figure 26. South Africa Long Chain Inulin Revenue (USD Million) By Region (2021-2032)
Figure 27. Africa Long Chain Inulin Revenue (USD Million) By Region (2021-2032)
Figure 28. North America Long Chain Inulin Revenue (USD Million) By Type (2021-2032)
Figure 29. North America Long Chain Inulin Revenue (USD Million) By Application (2021-2032)
Figure 30. North America Long Chain Inulin Revenue (USD Million) By Product (2021-2032)
Figure 31. Europe Long Chain Inulin Revenue (USD Million) By Type (2021-2032)
Figure 32. Europe Long Chain Inulin Revenue (USD Million) By Application (2021-2032)
Figure 33. Europe Long Chain Inulin Revenue (USD Million) By Product (2021-2032)
Figure 34. Asia Pacific Long Chain Inulin Revenue (USD Million) By Type (2021-2032)
Figure 35. Asia Pacific Long Chain Inulin Revenue (USD Million) By Application (2021-2032)
Figure 36. Asia Pacific Long Chain Inulin Revenue (USD Million) By Product (2021-2032)
Figure 37. South America Long Chain Inulin Revenue (USD Million) By Type (2021-2032)
Figure 38. South America Long Chain Inulin Revenue (USD Million) By Application (2021-2032)
Figure 39. South America Long Chain Inulin Revenue (USD Million) By Product (2021-2032)
Figure 40. Middle East and Africa Long Chain Inulin Revenue (USD Million) By Type (2021-2032)
Figure 41. Middle East and Africa Long Chain Inulin Revenue (USD Million) By Application (2021-2032)
Figure 42. Middle East and Africa Long Chain Inulin Revenue (USD Million) By Product (2021-2032)
By Type
Chicory Roots Inulin
Artichoke Inulin
Others
By Application
Bakery and Confectionary
Beverages
Dairy
Baby Foods
Animal Foods
Nutrition Supplements
Others
Countries Analyzed
North America (US, Canada, Mexico)
Europe (Germany, UK, France, Spain, Italy, Russia, Rest of Europe)
Asia Pacific (China, India, Japan, South Korea, Australia, South East Asia, Rest of Asia)
South America (Brazil, Argentina, Rest of South America)
Middle East and Africa (Saudi Arabia, UAE, Rest of Middle East, South Africa, Egypt, Rest of Africa)
